
AI Summary
The video explains the rules for identifying a diagonal pattern on price charts, using Bitcoin's daily timeframe as an example. It outlines five specific rules that must be met for a structure to qualify as a diagonal, emphasizing the importance of using an arithmetic scale rather than a logarithmic one.
Chapters
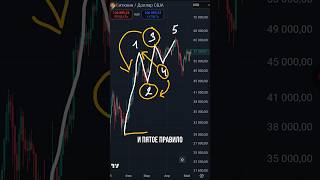
The presenter introduces the concept of a diagonal pattern and shows a Bitcoin daily chart with a completed diagonal structure labeled as waves 1 through 5.
A diagonal is similar to a compressed 5-wave impulse, so the first rule is the same as for an impulse: wave 2 must not exceed the start of wave 1.
The second rule is that wave 3 must be shorter than wave 1, which is opposite to the impulse rule where wave 3 is typically the longest.
The third rule states that wave 4 must be shorter than wave 2, continuing the pattern of shrinking wave sizes.
The fifth rule is that wave 5 must be shorter than wave 3, completing the sequence of progressively smaller waves.
After the diagonal completes, a strong opposite impulse often follows, as seen in the Bitcoin example where a downward impulse occurred after the diagonal.
The rules must be checked on an arithmetic (linear) scale, not a logarithmic scale, because patterns may appear valid on log charts but fail on linear charts.
The video provides a clear, rule-based method for identifying diagonal patterns, which are reliable signals of an impending trend reversal. The key takeaway is to always verify the rules on an arithmetic scale to avoid false identifications.
Tutorial Checklist
💡 Key Takeaways
Diagonal as Compressed Impulse
Establishes the foundational similarity between diagonals and impulses, which is key to understanding the pattern.
00:13Wave 3 Shorter Than Wave 1
This is the critical opposite rule to impulses, making it a defining characteristic of diagonals.
00:41Trend Reversal Signal
Highlights the practical value of diagonals as a reliable reversal indicator.
01:26Arithmetic Scale Requirement
A crucial practical tip that prevents false pattern identification on log charts.
01:44Full Transcript
[00:00] Хочу поделиться с вами правилами диагонали, чтобы вы смогли выявлять данную структуру на графике. Перед вами криптовалюта Bitcoin дневной таймфрейм. Здесь мы видим структуру конечной диагонали.
[00:13] Это волна 1, это волна 2, волна 3, волна 4 и волна 5. Диагональ похожа на сжатый 5-волновой импульс, поэтому первое правило аналогично структуре импульса.
[00:28] То есть волна 2, вот эта вот волна, не должна выходить за начало волны 1. Начало волны 1 находится у нас в данном месте. А далее правило становится противоположным импульсу.
[00:41] То есть волна 3 обязательно должна быть меньше, чем волна 1. Это второе правило. Третье правило, волна 4, то есть вот эта волна,
[00:53] 1 1 4 1 4
[01:09] чем волна 2. И пятое правило. Волна 5 должна быть меньше, чем волна 3. Таким образом, мы видим постепенное сужение диапазона после которого тренд меняется на противоположный
[01:26] обратите внимание что после образования конечной диагонали который мы отметили у нас произошел сильный нисходящий импульс правило диагонали сейчас высветились на экране если какое-либо правило нарушена то структура не будет являться диагональю и очень важное примечание
[01:44] Примечание. Правила должны соблюдаться в обычном арифметическом масштабе. То есть если мы увидим соблюдение правил на логарифмическом графике, то не факт, что они соблюдаются.
[01:56] Нужно обязательно использовать обычный арифметический график.