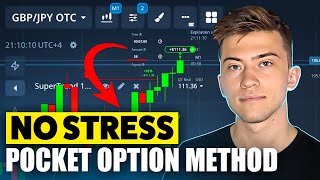

3 Indicators to Predict Market Moves
42sViewers are drawn to a clear, step-by-step indicator setup that promises to eliminate guesswork, appealing to both beginners and experienced traders.
▶ Play Clip"The title promises a 'sureshot' strategy, but the content is a basic indicator setup with no proof of consistency—classic overselling."
This video presents a binary options trading strategy for Pocket Option, using SuperTrend and ADX indicators on a 1-minute chart. The presenter demonstrates the setup and walks through several trades, claiming consistent profits.
Use classic candlesticks on a 1-minute timeframe. Add SuperTrend with multiplier 2 and ADX with DI length 5. In ADX style, disable ADX, set +DI to green and -DI to red, both with width 2.
A green SuperTrend line below the candles signals an uptrend. This indicates a change in direction and the start of bullish momentum.
The green +DI line crossing above the red -DI line confirms strengthening momentum, meaning the move is supported by real trend strength.
A clean breakout from a sideways range, without returning into consolidation, is a strong additional factor that reinforces the setup.
The presenter's balance grew from $58 to $2,950 in a single session, using 1-minute expirations and following the strategy's signals.
What two indicators are used in this strategy?
SuperTrend and ADX
00:49
What is the SuperTrend multiplier setting?
Multiplier 2
00:49
What is the ADX DI length setting?
DI length 5
01:04
What does a green SuperTrend line below the candles indicate?
Green line below the candles
02:13
What ADX crossover confirms momentum?
The green +DI line crosses above the red -DI line
02:44
What additional factor reinforces the setup?
A clean breakout from a consolidation range
05:20
What was the balance growth in the example session?
From $58 to $2,950
07:57
SuperTrend as a Trend Filter
Provides a clear visual signal for trend direction, making it accessible for beginners.
02:13ADX Crossover Confirmation
Adds a momentum filter to avoid false signals, increasing reliability.
02:44Breakout from Consolidation
Highlights how energy accumulation leads to strong directional moves, a key trading principle.
05:20Session Profit Example
Demonstrates the strategy's potential with a concrete result, though not a guarantee.
07:57[00:07] want to show you a strategy that can help absolutely anyone. [music] Beginners, experienced traders, and even those who are afraid to enter the market. It doesn't require guessing. It simply [music] shows when the market is
[00:21] ready to move. In this video, I'll break [music] down its logic, explain why it's so consistent, and how it helps limit [music] in motion from trading. Make sure to watch it till the end. I'll reveal the main secret [music] behind
[00:35] its accuracy. And I really appreciate your subscription to the channel and a like on the video. Let's [music] get started. First of all, let's prepare the tools. I use classic candlesticks time frame 1 minute. Then go to the
[00:49] indicators tab and select ADX and super trend. Super trend settings. Super easy. trend. Super trend settings. Super easy. Multiplier 2. Then click save. ADX settings DI length five. Then go to
[01:04] style. Disable ADX. Set the plus D line to green with the two. [music] And set the minus D line to red with the two as well. Then click save. The
[01:16] indicators are ready to go. [music] If you're trading on your phone, just set everything up the same way. And whether you're a beginner or experienced, I help everyone in my Telegram channel. I share market plans, show how I navigate
[01:31] realtime situations, and offer automatic copy [music] trading. Besides, I provide materials and strategies that I don't publish here. Entry is completely free,
[01:43] but the group is small, so message me while the doors are still open. I kick off the day with the first valid entry, expiration 1 minute, and I'm opening a expiration 1 minute, and I'm opening a buy trade for $58. Now, I'll explain in
[01:58] detail how the strategy works and why its signals are considered reliable. The first reference point here is super trend. When the indicator forms a green line below the candles, it clearly signals that the market is shifting into
[02:13] a growth phase. This positioning indicates a change in direction and the beginning of an uptrend. Price stays above a key level. Structure becomes stable and bullish momentum starts forming. This signal is very easy to
[02:29] read visually and gives a clear understanding of the overall direction. understanding of the overall direction. Next comes the confirming factor ADX. Its green line crosses the red line from bottom to top signaling strengthening
[02:44] momentum. This means the move is not random or short-lived but supported by real trend strength. The indicator shows that momentum is building and the market
[02:56] is ready to continue moving in the chosen direction. chosen direction. [music]
[03:09] continue watching the market. A few minutes later, the next opportunity appears. Expiration 1 minute and I'm opening a buy trade for $111. After a strong push upward and a short sideways phase, the market doesn't lose
[03:26] momentum. On the contrary, it confidently continues higher. The pause clearly worked in favor of the trend. Structure stayed intact. Direction didn't break and bullish rhythm remains fully under buyer control. Candles form
[03:43] clean and confident without chaos or sharp spikes. Each new move logically continues the previous one, making the signal very clean in e and easy to read.
[03:55] The chart looks organized, momentum is stable, and price behaves exactly as stable, and price behaves exactly as expected during a strong uptrend. The indicators also clearly point upward, fully confirming what we see on
[04:09] the chart. In this situation, expecting profit is completely justified. The consistently, and in the right direction. [music]
[04:29] to the next setup. [music]
[05:03] with a one minute expiration. I'm opening a sell trade for $778. The market was previously moving sideways, accumulating energy without showing a clear direction. Now the situation becomes much clearer. Price
[05:20] confidently breaks downward out of the range and this breakout looks clean without hesitation or returns back into consolidation. This is a very strong additional factor that reinforces the overall setup.
[05:36] A downside breakout from consolidation often means that all the previously accumulated energy is now being released to the downside. Candles become more directional. Market structure aligns cleanly and selling pressure becomes
[05:52] increasingly obvious. In this configuration, the market looks logical and predictable, which is why I'm confident the downtrend will continue. And this setup has a high probability of delivering profit.
[06:08] Friend, if you still have questions after watching this video, feel free to message me privately on Telegram and I'll be happy to help. I'll be happy to help. [music]
[06:26] in $725 profit and the streak continues. At the end of the trading day, the final conference signal forms. Timer one minute and I'm opening a trade for 1,513.
[06:45] sideways phase, spending some time in a range and building energy. But this time, the breakout develops especially clean. Candles constantly break upward with no return back into the consolidation.
[07:00] This serves as an excellent additional confirmation that strengthens the entire setup. An upside breakout from a range often signals that accumulated energy is now being released upward. Candles become more directional. Structure forms
[07:17] clearly and momentum looks alive and consistent. In this picture, confidence in the outcome only increases. The market has clearly chosen direction and the move develops logically and all conditions
[07:32] point toward a high probability of profit.
[07:44] $1,392 profit. The balance rises to $2,95. It's time to sum the session up. I'm very satisfied with this session. My
[07:57] balance grew from $58 all the way to $2,95. If you have any questions about the strategy or you want to dive deeper, feel free to message me on Telegram and I'll gladly help. Thanks a lot for
[08:12] watching, for liking the video, and subscribing to the channel. See you next subscribing to the channel. See you next time.




⚡ Saved you 0h 08m reading this? Transcribe any YouTube video for free — no signup needed.