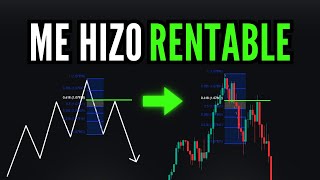

3 Entry Patterns for Profitable Trading
44sOpens with a bold promise of profitability, hooking traders seeking an edge.
▶ Play Clip"Title promises three entry patterns and delivers exactly that with clear examples."
This video presents three entry patterns for trading that the speaker has used for years to achieve profitability. The patterns rely on Fibonacci retracements and candlestick parity, emphasizing pattern recognition over price prediction.
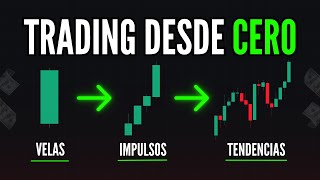
Instead of predicting price, identify entry patterns that repeat on charts. If the chart shows a known pattern, trade it.
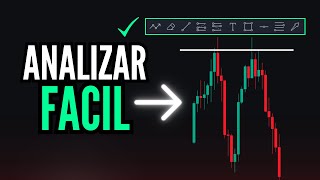
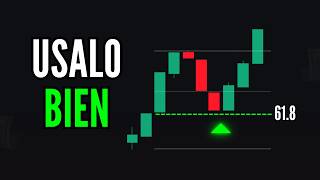
Use in trending markets when the trend is ending. Look for a double top or impulse that fails to surpass the previous high, then a break of the last low. Mark Fibonacci retracement and enter at 61.8% level.
After a trend reversal, if the chart respects the 61.8% Fibonacci retracement at least twice, trade on the third impulse at the 61.8% level.
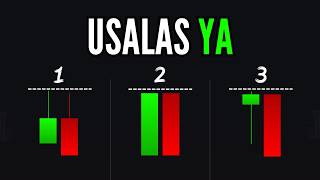
When the chart touches a support/resistance with a high-volume candle and retraces with similar volume, that zone becomes a reference. If the chart returns in the same way, trade the candlestick parity.
The speaker uses no indicators, only these three patterns: Fibonacci reversals, Fibonacci trend reversals, and candlestick parities. This has allowed profitability for 8 years.
By focusing on these three entry patterns, traders can simplify their decision-making and achieve consistent profitability without relying on indicators or complex analysis.
What is the core philosophy of trading according to the speaker?
Instead of predicting price, identify entry patterns that repeat on charts and trade when the pattern appears.
00:01
What Fibonacci level is used for entry in the reversal pattern?
61.8% retracement level.
01:54
What condition must be met before marking Fibonacci in the reversal pattern?
The price must break the last low, confirming a change in structure.
01:41
In the basic trend pattern, how many times must the 61.8% level be respected before trading on the third impulse?
At least twice.
05:31
What is a candlestick parity?
When price touches a support/resistance with a high-volume candle and retraces with a similar volume candle.
09:41
What confirmation does the speaker use for entry in the reversal pattern?
The candle closes exactly on the 61.8% Fibonacci line.
04:05
How long has the speaker been profitable using these patterns?
Almost 8 years.
12:34
Pattern Recognition Over Prediction
Core principle that simplifies trading by focusing on repeatable patterns.
00:01Fibonacci 61.8% Entry
Key technical level used across multiple patterns.
01:54Respect of Fibonacci Level
Confirmation that the pattern is valid before trading.
05:31Candlestick Parity Definition
Clear explanation of a powerful reversal signal.
09:41No Indicators Needed
Demonstrates a minimalist approach to trading.
12:20[00:01] then you need to use the right tools. In this video, I'm going to show you the three entry patterns I've used for many years, which have allowed me to be easily profitable. In
[00:15] mentioned to traders that the simplest way to trade, instead of trying to predict the price on a chart, is by identifying entry patterns. This means having a pattern, an
[00:30] entry pattern that you know the chart repeats or has repeated on several occasions, and trying to match it to your chart. It all boils down to this: if the chart is showing the pattern, the pattern, or the
[00:44] entry pattern you know, then you're going to trade, and that will result in a simple and effective trade. So, I'm going to show you the first entry pattern, which is one of my favorites and which I
[00:57] use practically every day: the reversal entry pattern. Obviously, for these first two entry patterns, we'll use Fibonacci as our main tool. So, I'll explain it here. You
[01:10] can use the first entry pattern in trending markets. Bullish as well as in a bearish trend. But what you need is for this trend to be ending, that is, for you to be at the highest or lowest point of a trend,
[01:25] depending on whether it's bullish or bearish. And when the chart has formed a double top or an impulse that no longer surpasses the previous one, and when this same retracement surpasses our last low, that's where I start to confirm this
[01:41] where I start to confirm this entry pattern. I mark a Fibonacci retracement level throughout this movement, and when the chart returns, obviously depending on how it returns, obviously depending on how it returns, to touch this 61.8% value line,
[01:54] returns, to touch this 61.8% value line, that's why I decide whether or not to enter the trade. So at the end of the day... Remember that we must know these entry patterns, and this will result in
[02:07] relatively simple trades. So let's see here, as an example, in the euro/dollar pair. We see that the chart is at the highest point of a trend, and to be able to start marking this entry pattern, we need
[02:21] this impulse to no longer surpass the previous one. Here you can see we were seeing impulse, retracement, impulse, retracement, but this impulse has already surpassed the previous one; that is, it has just left us with a double top. Perfect, that's the first signal to
[02:38] next thing we need is for the chart to break this last low. This will give us confirmation to mark our Fibonacci retracement. It's also where we'd get a "shot," for example, or
[02:52] confirmation of a change in structure. Once it does, that's the point where I usually mark my Fibonacci retracement. Now, some of you were asking, " Hey, but this is also a pullback model," meaning I could trade there.
[03:06] But whether you're going to trade a pullback also depends on how strongly it broke the last low. But this entry model is quite simple: we mark our entry point at the
[03:21] 61.8% retracement level. And I'm telling you, I couldn't trade here, I mean, I couldn't trade the pullback down here. Because first, the breakout didn't have that much depth because the confirmation of the candle that's reaching this support or this
[03:37] resistance in this case isn't giving me the proper confirmation. So the best option or the entry model that I usually use is to mark Fibonacci and that usually gives me super easy trades. There we see that
[03:50] the candle extends to touch the 61.8%. Furthermore, one of the confirmations I've already explained in other classes is candlestick parity. This means that the chart extends to reach the line you're going to
[04:05] trade, this block of support or resistance orders, but it does so decisively. Once the candlestick closes exactly on the line you have, that's when you confirm your trade. I often use
[04:19] the previous values to place my stop loss or take profit, and as a result, I always have simple, effective trades using a change in structure and confirming it with the Fibonacci tool. That
[04:34] would be the first entry model that has allowed me to be profitable over the years. Remember that if you want to open an account with the broker I use for forex, metals, cryptocurrencies, and CFDs, you have the registration link in the description of this video,
[04:46] and you also have all the details and information about my private academy. Okay, traders, so the second entry model would be a basic trend with Fibonacci. For example, if here on the
[05:00] same chart where we're looking at the euro/ dollar, I confirm that I have a change in structure—that is, I had an upward trend and now I confirm that I have a change in structure—then It will probably have a
[05:15] trend reversal. And from this new trend, I can use this entry model. It tells me that if the chart has previously tells me that if the chart has previously respected the 60% Fibonacci retracement at
[05:31] least twice, then I can mark a Fibonacci retracement at each of the impulses. And every time the chart retraces to the 61.8% Fibonacci retracement, that's
[05:44] where I'll be placing my trades, marking my Fibonacci retracements. I can follow this same pattern or entry model as long as the chart continues to respect the
[06:01] allow me to place trades in a regular trend. So, in the case of this chart, what would I need to operate this second entry model? Well, I see that my first retracement reached the
[06:15] 61.8% Fibonacci retracement. Excellent, so once the momentum surpasses the previous one, I can mark another Fibonacci retracement. There it is, mark another Fibonacci retracement. There it is, and I'm going to mark my line at 61.8%.
[06:28] Now, what do I need to be able to operate with this second perfect entry model? I need the chart to decisively reach the line, not just by chance. That's when I can confirm whether
[06:42] or not I have a trade. Look, if you notice, the chart is reaching the line. But what's happening is that perhaps it's not giving me the best confirmation of all; the candle isn't closing exactly on the line. So I'm not
[06:55] confirming that I have a trade. Okay? Remember that what will be the difference between you succeeding or failing in your trades will be the confirmation.
[07:07] Exactly. What I usually do is use candlestick pairs, and that's where we're going to start with the third entry model. But let me give you an example of this second model. Okay, traders, pay very close attention.
[07:20] We're here at a change in structure, and if I mark a Fibonacci retracement on this first impulse, I can see that the chart reached chart reached 61.8. Perfect. Now, on my second
[07:34] impulse, remember the entry model is like this: impulse, retracement, impulse, retracement, impulse, retracement, impulse, and you're going to mark your Fibonaccis. So, on the second mark your Fibonaccis. So, on the second impulse, I mark my Fibonacci retracement. Perfect. I
[07:47] mark my line. 61.8 per. And if the chart respects it, then it's respecting it. So, on the third impulse, that's where I'm going to trade. Here, I mark my Fibonacci again, marking my
[08:03] entry point at 61.8%. Okay, and on this yellow line, that's where we're going to trade, always confirming that the chart has already respected it at least twice, meaning that it has
[08:18] respected it here again. And you're going to trade on the third impulse. Okay, so what happens is that we mark our entry point using the previous values as confirmation, and you'll realize that you're going to have a
[08:33] spectacular trade there, as long as the chart has respected these previous values. Remember that the chart moves based on patterns. So, if the chart is telling you that it's respecting a certain type of pattern, we're
[08:48] simply going to follow it. This will make our trading simple and effective, instead of trying to decipher whether our chart at this point is going to go up or down. But we don't know what it's
[09:01] doing. Just do this: identify these three entry patterns that I'm talking about in this video, and that's it. You'll see that you'll have simple and effective trades. And this is basically what I do every
[09:13] day. I open any kind of chart, and if I see that any of these charts is following the entry pattern or a similar entry pattern to what I trade every day, then I trade it. And if it's not following it, I don't trade it. And that
[09:27] saves me time, saves me money, saves me from bad analyses, and, well, I don't have losses in trading. This way, you'll be trading with the entry patterns you already know, that you already know work, and that will give you good
[09:41] trades. And finally, traders, one of my all-time favorite entry patterns is probably the clash of tops or candlestick patterns. In other videos, I've explained that a candlestick pattern is when the
[09:55] chart extends to touch a support, a resistance, or a block of orders with a high-volume candlestick and returns with a similar volume. This is what you see here. This is called a candlestick pattern. Normally, if you want to know if the
[10:09] chart is going to respect a reference line, support, or resistance, try to see if it's giving you candlestick patterns, and you'll realize that most of the best points... A turning point is what will happen with
[10:24] candlestick pairs. So I use candlestick pairs a lot to confirm non- trend trades. For example, here I mark this line over here. Why? Because I previously had an excellent candlestick pair. I also
[10:37] mark my lower line because this is where I had the perfect candlestick pair. So, to confirm a trade here in this range, I would need the chart to follow the same pattern, that is, to
[10:51] reach one of these two extremes with a high-volume candlestick that closes exactly on the line. Then it would be following the candlestick pair pattern. Here you can see it arriving in the same way as before.
[11:07] And what we're going to look for is a candlestick pair, and this is one of the simplest and most effective entry models you can use. Once the candlestick closes on the line where I marked the previous pair,
[11:21] here I'll mark it where I marked the previous pair. So, this is where the chart respects the candlestick pairs and ends up giving you simply spectacular movements, since it ends up respecting the zones or places where it had
[11:36] arrived with candlestick pairs previously. As you can see here, it arrived, but since it did n't arrive With a volume candle, then I can't trade against it. But then the last entry model would be candlestick parities. When the
[11:50] chart extends to touch a reference line, it arrives with a volume candlestick and retraces with a similar volume candlestick. This is a candlestick parity, and we're going to use this high or low for a future trade.
[12:06] If the chart arrives again in exactly the same way, then we're going to take advantage of it to trade the candlestick parity. So, traders, these are the three entry models that I use practically every day. I
[12:20] don't use indicators, I don't use templates, I don't use absolutely anything else. Every time I open a chart, I try to identify these three entry models: Fibonacci reversals, Fibonacci trend reversals, and if I
[12:34] have a range, then reversal points with candlestick parities. And these are the three entry models that have allowed me to be profitable and live off trading for almost 8 years now. So, I hope these models can help you
[12:46] continue advancing in trading. Make sure to subscribe to our channel, comments if you're already using any of these entry models. Here's see it. Click here and we'll see you next time.
⚡ Saved you 0h 13m reading this? Transcribe any YouTube video for free — no signup needed.