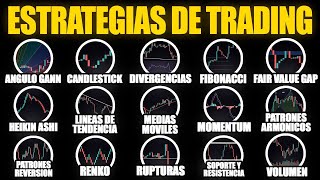

21 Trading Strategies in 15 Min
43sHigh educational value with a promise of covering many strategies, appealing to beginners and advanced traders.
▶ Play ClipThis video covers 21 profitable trading strategies for beginners and advanced traders, including indicator-based, price action, oscillator, volume, and no-volume strategies. It explains techniques like support/resistance, candlestick patterns, Renko charts, Elliott Waves, and more, aiming to help traders start profitably regardless of capital.
[00:02] basics of the best trading strategies out there, defining a total trading strategies out there, defining a total of 21 profitable trading strategies. trading strategies, for beginner and
[00:16] advanced traders, as well as for traders with more capital and traders with less capital: strategies with indicators, strategies based on price action, strategies with oscillators, with volume, and without volume.
[00:30] As I mentioned, I'll discuss 21 profitable trading strategies. I assure you that whatever your situation, these trading strategies will allow you to start trading profitably. In the
[00:43] first pinned comment and in the description of this video, you'll find other links of interest that complement this content: other trading strategies, courses, tutorials, and training. All content is 100% free
[00:58] so you can continue learning as a trader without needing to invest your money. without needing to invest your money. [Music]
[01:12] key levels that form horizontally where the price has bounced in the past and could bounce again in the future. If the level is below the price, it's called support, where you can take a
[01:25] buy position. If the level is above the price, it's called resistance. where you can take a sell position. Candlestick patterns are a technique traders use to analyze future price movements
[01:39] by observing specific shapes of different candlesticks. Some of the most typical candlestick patterns are engulfing patterns, which signal a strong impulse in the direction of the engulfing candlestick; Hammer patterns;
[01:53] Low Test; High Test; Morning Star; and Evening Star. Each pattern indicates the probability of the price moving in one direction or another. This technique replaces a traditional candlestick chart
[02:06] with a Renco chart. Unlike a traditional candlestick, which forms a new candle based on a certain period of time, a Renco chart forms its block based on price changes. For example, for every
[02:21] 1% change in price, a Renco block appears. This means that each Renco block represents a 1% change the parameters of this through the indicator settings.
[02:35] Traders who use this type of chart do so primarily to filter out noise and identify specific trends. A green Renco block indicates an upward trend, and a red Renco block indicates
[02:48] a downward trend. Keep in mind that Renco charts only act as an indicator; they do not show the actual price in the market. Elliott Waves is a theory that suggests the market tends to move in a series of five
[03:02] waves before reversing and forming a set of waves in the opposite direction. By understanding the Elliott Wave sequence, traders can predict where the price is headed. We can then label each
[03:16] We can then label each point of the waves as 1, 2, 3, 4, and 5, and then an A-C structure would follow. There are specific rules to ensure a move is considered a valid Elliott Wave. First, wave number
[03:31] one has to make higher highs if it is an uptrend, and wave number two has to confirm higher lows. From then on,
[03:43] second wave to reach the 0.618 Fibonacci level, and then we enter wave number three, which is usually the longest of the three waves (waves 1, 3, and C-C), which are the impulsive waves. Then comes wave number four, which adjusts based on
[03:58] wave number three and is a correction slightly longer than the wave itself. Number two, and finally comes wave number five, which, as I said, is usually shorter than wave number three and reaches approximately
[04:12] the previous highs. From then on, we could expect an a-c pattern in the opposite direction, although it is not strictly necessary. Moon phases or cycles are a concept that uses lunar cycles to
[04:27] time the market. Traders who follow lunar phases believe that lunar cycles are correlated with market. It is believed that specific lunar phases are favorable towards a
[04:41] certain trend. A new moon means that the market tends to be bullish, and a full moon means that the market tends to be bearish. used as a confirmation tool. Fire value gaps, or FVGs,
[04:57] occur when a candle forms a significant gap due to a buying or selling imbalance. To find a fire value gap, you first need to find a candle with a large body. Then, draw a rectangle in the gap
[05:09] between the wick of candle number one and the wick of candle number three. This level It will now act as a potential magnet that the price may test before continuing its previous movement. Trend lines are
[05:23] key levels that form diagonally during a trending market. trend lines to identify the overall direction of the price, and an ascending trend line signifies an uptrend, while a
[05:37] descending trend line signifies a downtrend. It is similar to support and resistance, as you can also use the trend line to identify example, when the price retraces towards a
[05:50] trend line, it can be a good opportunity for a buy position in the case of an uptrend. Market structures are when traders analyze the behavior, condition, and structure of the price
[06:04] and trade in its favor. An uptrend structure is characterized by the price forming higher highs and higher lows, while a downtrend structure is characterized by the price
[06:17] forming lower highs and lower lows. A change in structure occurs previous structure during a trend, often signaling a reversal of that current trend. For example, if the price is making highs and lows... When prices
[06:33] previous lows, they can start forming lower highs and lower lows. This is how you trade that trend change. Heikin Nashi candles are a traditional candlestick chart with a Heikin Nashi candlestick chart. When
[06:48] applied, it tends to be less noisy than a traditional candlestick. A green Heikin Nashi candlestick indicates that the price is in an uptrend, and a red Heikin Nashi candlestick indicates that the price is in a downtrend. The size of the
[07:02] candlestick body also indicates how strong the trend is; the larger the candlestick, the stronger the trend. Again, keep in mind that Heikin Nashi only acts as an indicator and does not show the actual
[07:15] market price. Breakout patterns occur when the price makes a sudden and significant move in a specific direction. This usually forms after a period of consolidation in the market. For example,
[07:27] here we can see that the price is consolidating and then moves sharply downwards. This is called a breakout. To take advantage of this, traders can use specific patterns as a guide to identify breakouts
[07:40] beforehand. The most notable breakout patterns would be wedges, triangles, and also the rectangle pattern. Gan angles, or Gan fan, is a tool that displays multiple lines extending
[07:55] continuously at different angles. These lines can act as potential key levels and can also help you measure the strength of a trend. Price moving within the tool's steep angles indicates
[08:08] a strong trend, and price moving within the tool's shallow angles indicates a weak trend. To apply Gan angles, first go to the settings and make sure the option shown on the
[08:21] screen is checked. Then, identify a market range and mark the minimum and maximum of that range. Next, draw a straight vertical line at the beginning of the range and select the trend angle tool,
[08:34] measuring 45 degrees. Then, use the Gan angle tool and place it at that 45-degree angle. Fibonacci retracements are a tool that displays horizontal lines based on Fibonacci numbers. These lines
[08:48] support and resistance levels. To use this Fibonacci retracement tool, you must first identify a minimum and A high on a chart, then drag the tool from the low to the high, and then wait
[09:02] for the price to retrace to one of these levels, ideally these levels, ideally 0.382, 0.5, or 0.618—that is, one-third, one-half, or two-thirds. The moment the price touches one of these levels
[09:14] could be a good entry point. But keep in mind that the price can reverse from any of these levels. So combine it with other confirmation signals for better entry points. Divergences
[09:26] occur when an indicator shows a signal opposite to the actual price movement. When this happens, it is generally a sign that the trend could reverse. Divergences can occur in many indicators, such as the
[09:39] Magdi, Stochastic, and even the RSI. For example, here, using the Magdi, you can see that the price is forming higher highs, which is an uptrend, but the indicator shows the opposite: lower highs,
[09:53] seeing a bearish divergence, which indicates that the price may form a reversal, and thus you can take a sell position. Harmonic patterns are... With advanced price patterns that follow a
[10:07] specific shape based on Fibonacci numbers, traders can use these specific shapes to predict future price movements. For example, a bearish pattern forms when the price makes a series of
[10:19] four moves that have the shape of the letter M. Each point can be of the letter M. Each point can be labeled X, A, B, C, and D, and each of these points has a specific guideline. For example, from point X to
[10:33] point B, you need a value between 0.382 and 0.5; from point A to point C, 0.382 and 0.5; from point A to point C, you need a value between 0.382 and 0.886; and the same works for the other points below. These
[10:48] specific guidelines can be applied to a real chart. So, if you see that the price forms a series of four moves, you can apply the harmonic pattern tool to check if the price that formed
[11:00] matches the pattern guideline. If so, you can take a position based on the pattern that formed. There are multiple harmonic patterns; the most notable are the butterfly, the bat, and the crab, and each has its own
[11:13] unique values. Reversal patterns occur when the price moves in the opposite direction of the current trend and forms a Contrary to trend, specific patterns can be identified on charts that can help
[11:26] traders predict reversals before they occur. The most notable reversal patterns are the double top, the double bottom, and the head and shoulders. Dynamic support and resistance are similar to static support and resistance. Dynamic support and
[11:40] resistance also act as key levels, but instead of using static horizontal lines, they use indicators such as moving averages to determine entry points. Volume indicators
[11:53] are types of indicators that show the strength behind a price movement by tracking trading volume. The most notable volume indicators include price-to-volume, which shows the volume for each candlestick. The
[12:05] longer the candlestick, the greater the volume. WP/V shows the relationship of an asset's price to its total volume, which can be traded as a moving average or as dynamic support or resistance.
[12:19] Volume profiles show a horizontal volume bar that can be treated as key levels for potential entry positions. indicators that measure the direction and strength of a trend and are most
[12:34] effective when used in trending markets. Some of the most notable momentum indicators are the In the Mati indicator, an upward crossover indicates an upward trend, while a downward crossover indicates a downward trend. With
[12:47] moving averages, a price above the moving average indicates an upward trend, and a price below indicates a downward trend. The Parabolic SAR indicator shows a point below the price indicating an upward trend, and a point
[13:00] above the price indicating a downward trend. The Supertrend indicator shows a green signal indicating an upward trend and a red signal indicating a downward trend. Oscillators are types of indicators that show the relative strength of a price. They
[13:13] are most effective when used in sideways or range-bound markets. The most notable oscillators are the RSI; when the line is in the oversold zone, it indicates a possible upward reversal, and when it is in the
[13:25] overbought zone, it indicates a possible downward reversal. The Stochastic oscillator also shows that if both lines are oversold, it indicates a possible upward reversal, and when both lines are overbought, it indicates a possible downward reversal. Supply and
[13:39] demand, also known as order blocks, are areas where significant price movements have occurred. If the price moves significantly towards the supply and demand line, it indicates a possible upward reversal. A price movement above a certain level is considered a demand zone. If the price
[13:52] moves significantly downward from another level, it's considered a supply zone. Like support and resistance, these zones can be treated as key levels for potential entry positions. This video obviously
[14:05] wasn't intended to offer an exact description of how to trade with each of these elements; however, it did aim to reflect the If you're interested in delving deeper into practically all
[14:19] of these trading methods, check the first pinned comment below video. Remember that you'll find other links of interest, not only courses, training, and tutorials, but
[14:31] also well-defined and profitable trading strategies using practically all of these elements. I'll leave this video here. I hope you liked it and found it helpful, which is the important thing. If so, please like,
[14:44] subscribe, and share it with friends and family. See you in with friends and family. See you in the next video! Goodbye!
⚡ Saved you 0h 14m reading this? Transcribe any YouTube video for free — no signup needed.