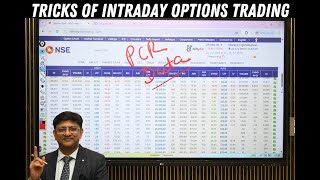

The Center Strike Secret for Options Trading
43sReveals a simple yet powerful trick using the opening range to identify the center strike for options analysis.
▶ Play Clip"Title promises 'tricks' and delivers a practical method, though some segments are filler (self-promotion, repeated explanations)."
In this video, Nitin Murarka teaches two key tricks for trading Nifty options intraday using the NSE option chain data. He focuses on analyzing changes in open interest and price changes to determine market direction, specifically highlighting how heavy call side open interest suggests trading puts instead of calls.
Open a browser and search 'Option Chain Data NSE'; the NSE website displays call and put data with columns like OI, change in OI, volume, IV, LTP, etc.
Focus on two columns: 'Change in Open Interest' (positions being created or cut) and 'Change' (price change). These help predict intraday direction.
Note the market opening price (9:08 AM pre-open close), round it to the nearest strike. That becomes the center strike for analysis.
At center strike 25150, call OI change was 55,000 contracts. Lower strikes (25100) had 69,000; higher strikes (25200) had 73,000. Heavy OI buildup indicates strong call sides.
All call options were down: at 25150 down ₹34, at 25200 down ₹29, etc. Negative price change confirms bearish bias on calls.
At center strike 25150, put OI change was only 6,914 contracts vs 55,000 on calls. Other strikes also had minimal OI buildup. Positive price changes on some put strikes.
Heavy call OI + falling call prices = avoid buying calls. Light put OI + rising/less falling put prices = trade puts. The opportunity lies in puts.
Open NSE option chain, select center strike, compare OI heaviness between calls and puts. Trade the side with lighter OI and favorable price change.
By using change in open interest and price change from option chain data, traders can identify intraday direction with higher accuracy. The key is to trade against the heavy side (calls heavy = trade puts) to reduce risk.
What is the first trick for intraday options trading using option chain?
Identify the center strike by rounding the market opening price (9:08 AM) to the nearest strike.
05:02
Which two columns in the option chain are most important for this strategy?
Change in Open Interest and Price Change (Change column).
03:37
What does heavy call side OI with falling prices indicate?
Avoid buying calls; instead, consider trading puts as the market may fall or stay range-bound.
10:37
On 22nd July, what was the change in OI at call strike 25150?
55,000 contracts.
06:10
How did the put side OI compare to call side OI at the same center strike?
Put side OI change was only 6,914 contracts vs 55,000 on calls.
08:31
What does positive price change in put options suggest?
Put premiums are increasing or falling less than calls, indicating strength in puts.
11:04
Option Chain as 'Panacea'
The speaker emphasizes that the option chain is the best indicator for intraday Nifty options direction.
02:01Heavy Call OI vs Light Put OI
The comparison (500-600 kg vs no weight) vividly illustrates how to spot the uneven positioning.
09:55Trade Where Position is Light
This principle of trading against the heavy side is counterintuitive to many retail traders and can reduce losses.
11:46Focus on Two Columns Only
Simplifying the analysis to just change in OI and price change makes the strategy accessible to beginners.
03:22Call Side Heavy = Trade Put
The key recommendation directly contradicts the common bias to trade calls in a rising market, showing data-based decision making.
10:37[00:04] make some new videos for all of you and in this we will talk about education, trading related matters, market data and what seems to be happening in the market in future and
[00:16] what can happen. So in today's video, we are going to talk about video, we are going to talk about and you can also make money by looking at it. So I will talk about what that trick is
[00:31] and there are one or two tricks in the option chain data which comes on the NSC website, which I am going to teach you in this video today and after understanding those tricks, and after understanding those tricks,
[00:47] It is that simple. So let us move ahead and before coming to our main content, I want to give you some information that I connect with you every day on Zee Business
[01:00] that I connect with you every day on Zee Business and the time and the time I connect with you every day is between 12:35 to 12:50 and during this time I do one trade of Nifty and one trade of Nifty Options every day.
[01:14] So you can join there and see, trade. And the second I connect with you again. I can join anytime between 2:15 and 2:30. So these are the two timings when you must visit Zee Business and at that time I
[01:30] give you Nifty options trades and all those trades are based on data analysis. So you can watch and trade on top of that. Now let us move ahead to today's topic and we are going to talk about NSC Option Chain Data.
[01:46] about NSC Option Chain Data. So it is simple, open the browser in your mobile and write Option Chain Data NSC in it. When you write Option Chain Data NSC, this option chain data which you can see on my screen right now will
[02:01] open like this. This is the panacea. If you want to trade Nifty options , then this is one of the best indicators through which you can predict the intraday direction of the market. Now
[02:18] So see, when you open this, we can see that we can see that we get the call data on one side. Here we can see the call data. And if I look at this, I
[02:33] get the put data here. So we are getting call data and put data on both sides. and on the right hand side you can see that this is put data. And the data that we will discuss today is the data of 22nd July. So this is the latest data and we are going to understand
[02:51] how to analyse this data in the live market. So first of all let us go to the call side and analyze the call side data. Now let us see what options we are getting in this and the columns. Firstly,
[03:06] we get OI data from the exchange. You can see the OI column here. This is what we are column shows the change in open interest data. And thirdly, we are getting data on volumes. The
[03:22] fourth IV is what we call Implied Volatility VIX. Vicks became a different thing. IVs come in different strikes. So we will talk about this in detail sometime. And today our focus is on change in open interest. And our
[03:37] focus will be on getting data about another change. Change data means price change data. This is the data of the changes taking place in the price. And change in open interest happened. That is, the data of the positions being created and cut is change in open interest.
[03:52] So today our focus is on column number two and the focus is on change. With these two tricks you can catch the market movement in the live market. Then comes bid
[04:04] quantity, ask quantity, strike prices and in the same way strike prices and in the same way we get to see all this data on the put side also. Just like you just saw on the call side, similarly if you
[04:16] go to the put side, you will see the same data in the put side also. What will be getting? You will get change, LTP, IV , volume, change in open interest. Now what are we focusing on today ? Change in open interest pay. And we are
[04:32] focusing on price change. Now you have to concentrate only on these two columns. In the upcoming videos I will also teach you how to watch on IV. We will also discuss volumes. But now let's take our main steps one by one. So
[04:46] that you can implement it, learn it and do live trading and gradually live trading and gradually we can move forward. So let's now see that when we are making the video today, it is 22nd July and the most important trick in this on 22nd July is
[05:02] that you have to note down the market opening at 9:08 in the morning. For example, suppose the pre-opens at 9:8.
[05:14] When does the pre-opening closing of the market take place? It happens at 9:8. So suppose the market opened at 9:8 and the So suppose the market opened at 9:8 and the when you round this off, it will come out to be 25150. So you have to take the round off strike, the
[05:29] center strike which becomes 25150. That means, when you open the NSC India website on your mobile means, when you open the NSC India website on your mobile 25150 because that is the center strike. You rounded it off. This is a trick number
[05:45] one. Now in this we move on to trick number two. And what do you have to do there now? Here you will see the column of Change in Open Interest.
[05:58] column of change in open interest, we will first come to our center strike. You see the center strike. What was our center strike? Our What was our center strike? Our center strike was 25150.
[06:10] Now if we analyze its change in open interest, then see this is our center strike and how much change in open interest do we see in it? 55,000 contracts. 55,000 contracts. Now let us look at it from front,
[06:24] back, up and down to see what is happening. So let's get a little bit is happening. So let's get a little bit into the money at 25100. The bottom strike happened. So if we look at it, what is its price brother? The price is ₹56, so
[06:40] what is the change in open interest in this? 69000 contracts. Let's go down a step further and let's go a little bit in the money. So how much is the change in open interest at 2550?
[06:52] 17500 Please listen very carefully. This is a very important trick. Now we go down one step further to 25,000. So let's go down one more step. So how much is mine? 4957 So now let us move one step up, that is, let us
[07:05] look at 25200 which is our center strike, let us move one step above it, so 73000 contracts, let us move one step further up to 250, so 28000 contracts,
[07:17] okay let us move one step further to 25300, so how much is it, 27000 contracts, that is, how much is it, 27000 contracts, that is, in every strike, 25000, 30000, 400, 70000, such These are not shares, they are contracts. So now we have seen the call side,
[07:34] brother, what is change in open interest ? Now let us take a look at the price change on the call side. Now if you look at Add the Money, it is down by ₹34. If you go one step up, it is ₹29 down. Now suppose if you see its price is Rs 25,200. Now if we
[07:50] look at 25,250, it has gone down by ₹25 today. And if we look at 25,800, it is ₹20 down. making this video after the market and not in the live market. But you have to watch it live and trade
[08:02] in the live market. This entire model will work in the live market. So what did we just see? We saw what is change in open interest? Got the call side. What is price change? I see all the price changes being negative on the call side.
[08:16] This is the call side. So now let us analyze the put side and see what is the situation in the put and what kind of positions have been created in the put. So come on brother, now let us come to the put side and catch these strikes on the put side. This is
[08:31] our 25150 25150, what is its price? 110 110 Now the 25150, what is its price? 110 110 Now the price in this is 110.
[08:43] price in this is 110. 25150 price 110 ok the main thing is what is 25150 price 110 ok the main thing is what is our change in open interest 6914 contracts now use your brain a little bit and see how much was on the call side
[08:56] 55000 contracts and how much is on the put side 6900 contracts where is the heavy 55000 contracts there here there are only 6900 contracts now let's go down one step
[09:08] and when we go down one step we saw there how much was there in 25100 73000 contracts and how much is there here 6500 contracts only let's go down two more steps and see if we look there also then there are only 16000
[09:23] contracts and 800 contracts and if we look at the call side then there is double triple i.e. there are 2000 25000 contracts there. Let's climb up each step and see. So how much is visible in 25,200? This is showing in minus brother. 587
[09:37] contract is negative. On the call side, 60-70,000 contracts were positive. So overall, let's take one step and look up also. There are only 40 contracts here at 25250. That means lot size of 75 * 40 means positions are created for only 40 * 75 shares. If you
[09:55] look at the call side, at least 25 positions of 3000 contracts have been created. So overall the summary is that the call has a lot of weight. 500 kg, 600 kg on every strike means a lot of weight. There
[10:09] is no weight on the putting side. So what does this mean ? What do you want to trade? Have to trade a put. The call does not have to be touched at all. Because there is a lot of call side heaviness. It won't work and there are absolutely no positions on the putting side. So there
[10:23] are more chances of it working. This means where does trading opportunity arise on 22nd July ? It is formed in put, it is not formed at all in call. Now let us understand one more thing, let us understand the change here, what is the relevance of change. So you saw the call side
[10:37] relevance of change. So you saw the call side which was at the money at 25150, how much down was it? Was down ₹34. How much is this here? ₹6 down. So let's say today it happened that the calls did not increase. The call broke down more and the put broke down less but at least the put broke down less.
[10:52] If you had taken the call, you would have lost ₹34. If you are in put then there is a loss of ₹6. But the point is in put then there is a loss of ₹6. But the point is that you have to decide the direction in which to trade. So overall, are you able to grasp the direction here?
[11:04] How are you able to catch it? If the call is too heavy then you have to take a put. Secondly, you have to keep an eye on the changes and see where the change is on the positive side. If the change is on the positive side in more puts, what does it mean for you to trade? Have to trade a put. Do
[11:18] look at all the strikes. I I go down. If I look at 25250, it has increased by ₹5. If I look at 25300, it has increased by ₹7. If I look at 25350, it has increased by ₹13. If I look at 25400, it increased by ₹23.
[11:32] Well, these are in the money puts but still the prices have increased in these money puts. If you look at the calls, all the calls are broken. So the summary that emerges from this is that when the price itself is falling and so
[11:46] many positions are being created in calls, then why should we as a retail trader buy call options? What do we need to buy? We have to focus on the put. Do n't focus on the call at all. So this data is available on the NSC website.
[12:00] Open it on your mobile. Select center strike and quickly see where the position is heavy. Where is the position light? Trade where there is light. Do
[12:12] that you will be able to control your losses intraday to a great extent. You will be as you keep practicing and keep looking at this data, your accuracy will keep increasing. So, you get it? You must have understood it completely. If you have
[12:26] any question in your mind then you can ask that question in the comment. I will try to reply to your comments. I will answer your questions and whatever query you have in your mind, you can ask in the comments. Thank you very much.
[12:41] Thank you very much. Thank you very much to all of you for your time. Thank you.
⚡ Saved you 0h 12m reading this? Transcribe any YouTube video for free — no signup needed.