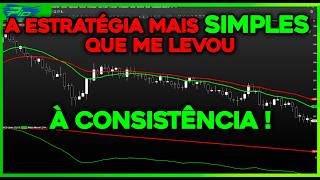

I Lost Money Until I Found This Simple Strategy
45sRelatable failure-to-success story that hooks struggling traders.
▶ Play Clip"Delivers a solid, simple strategy as promised, but includes a lengthy promo for a paid course, slightly diluting the value."
The video presents a simple day trading strategy called 'scalp fishing' that uses two exponential moving averages (17 and 72 periods) and a MACD indicator to identify trends, entry points, and exit signals. The creator shares how this strategy helped them overcome common trading doubts and emphasizes the importance of simplicity and testing. The video also demonstrates how to refine the strategy with additional indicators like the Aroon oscillator and a third moving average, and promotes a paid training method.
The creator started day trading with R$10,000 from severance and unemployment insurance, spent money on technical analysis courses, but froze when it came to executing trades because they couldn't answer three basic questions: where to enter, when they are most likely to be right, and when to stop believing in a trend.
The strategy uses a 17-period EMA, a 72-period EMA, and a MACD with settings: long-term 72, short-term 17, and signal 144. When both moving averages and MACD cross upwards, it indicates an uptrend; when they cross downwards, a downtrend.
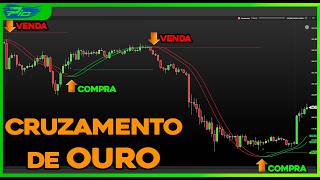
The key principle is that price far from the average returns to the average. In an uptrend, price retraces between the moving averages (taking a 'breath') before making a new push. This creates dynamic support and resistance zones.
After understanding the concept, the creator tested it on historical charts and found that upward-crossing averages with MACD support formed dynamic support zones, and downward-crossing averages formed dynamic resistance zones. This shifted their mindset from guessing to looking for evidence and probabilities.
Entry point: between the moving averages. Best chance of being right: when MACD confirms the trend. Stop believing: when MACD no longer supports the movement (e.g., averages cross up but MACD crosses down).
The creator refined the strategy by adding a third moving average (305 periods) and replacing MACD with the Aroon oscillator (200 periods) to gauge trend strength. The Aroon oscillator shows strong trends when bars are above 75 or below -75.
An extreme example uses four ATR stops (20 periods, deviations 3, 4, C, D6) and a flow diffuser (settings: medium-long 72, medium-short 17, DF-72, DF+144). The concept remains the same: identify trend, wait for pullback, enter with confirmation, and exit when support fails.
The creator emphasizes: 1) Learn a simple concept that works (scalp fishing), 2) Test until you understand why it works, 3) Refine as you progress, 4) Repeat the process to develop new strategies with increasing accuracy.
The creator promotes a paid training method (Pilsar 3.0) that includes updated strategies and robots, with enrollment open until October 31st. YouTube content is educational and not updated, but the method's strategies are regularly monitored.
The video teaches a simple, beginner-friendly day trading strategy based on moving averages and MACD, and shows how to refine it with additional indicators. The core message is that simplicity and testing lead to consistency, and the creator encourages viewers to apply the concept and consider his paid method for updated strategies.
What are the three questions that the creator initially couldn't answer in day trading?
Where to enter, when they are most likely to be right, and when to stop believing in a trend.
00:15
What are the settings for the MACD in the scalp fishing strategy?
Long-term moving average of 72 periods, short-term moving average of 17 periods, and signal line of 144 periods.
01:13
What is the core concept of the scalp fishing strategy?
Price far from average returns to average. Price retraces between moving averages to 'breathe' before making a new push.
01:41
In an uptrend, where is the entry point for a buy trade?
Between the moving averages, when the price retraces and the MACD confirms the uptrend.
04:39
When should you stop believing in an upward trend according to the strategy?
When the MACD no longer supports the movement, e.g., when the MACD crosses downwards while the moving averages are still crossed upwards.
05:29
What does the Aroon oscillator indicate when its bars are above 75?
It indicates a strong upward trend.
06:38
What is the purpose of adding a third moving average (e.g., 305 periods) to the strategy?
It filters the trend better and avoids multiple false signals.
08:47
What are the four steps the creator recommends for developing trading strategies?
1) Learn a simple concept that works, 2) Test until you understand why it works, 3) Refine as you progress, 4) Repeat the process.
11:56
Price Returns to Average
This is the foundational principle of the strategy, explaining why pullbacks occur and providing a clear entry logic.
01:41From Guessing to Probabilities
The shift in mindset from predicting price to seeking evidence and probabilities is a key insight for traders.
03:47Refining with Aroon Oscillator
Demonstrates how adding a trend strength indicator can filter out weak signals and improve reliability.
06:08Advanced Example with ATR Stops
Shows that the same concept applies even with different indicators and chart types, proving its universality.
09:28Four-Step Process for Strategy Development
Provides a repeatable framework for developing and refining trading strategies, applicable beyond this specific strategy.
11:56[00:01] welder to try to be a day trader, I had around R$ 10,000 from my severance pay plus unemployment insurance money. I spent a good portion of that on technical analysis courses, and in those courses I learned to identify
[00:15] trends on the chart, but when it came time to press the buy or sell button, I froze. That's because I couldn't answer three basic questions. Where better chance of being right and when I stop
[00:28] believing in a trend. Until a ridiculously simple strategy, using two moving averages and a MACD, answered those three questions for me. simple strategy has become the basis for most of my strategies to this day.
[00:43] So stick with me until the end because I'm going to show you exactly how it works and how you can use it to finally gain clarity in your trading. Dude, this ridiculously simple strategy is called scalp fishing. And look
[00:58] how simple it is. In our setup, we use a 17-period exponential moving average, shown we used a 72-period exponential moving average. And in the footer we use a MACD line, where we have this first MACD line with the long-term moving average
[01:13] of 72 periods, the short-term moving average of 17 periods in green, and in red we use the exponential moving average of 144 periods. Just that. And what I learned from that simple strategy, I still carry with me today. Hey, let me
[01:28] show you how it works. Look, when the moving averages are crossing upwards and the MAC is also crossing upwards, we consider that we are in an uptrend, an upward movement. And that's where the
[01:41] upward movement. And that's where the most important concept comes in, my friend. Price far from average, returns to average. Price far from average, returns to average. Dude, when the price retraces between moving averages that are crossed upwards with the MACD supporting it,
[01:55] that is, with the MACD also crossed upwards, it's as if the price is taking a breath before making a new push. Taking a breath to then make a 'm showing you here, this happened several times. Look, the price is
[02:10] way above average, way above average, way above average, way above average. He returns to the middle to breathe, returns to the middle to breathe, returns to the middle to breathe. And then he makes the new push. Look, new momentum, new
[02:24] momentum, new momentum. And of course, man, the same applies, just look over here to the opposite side. If the moving averages are crossing downwards and the MACD is also crossing downwards, then we believe in a downward movement. The price, far from the
[02:38] averages, returns to the averages, as if it were breathing, taking a breath before making a new push. But then he moves away from averages again. He needs to get back to the midfield to breathe. He took a breath for a new
[02:52] push, then fell again, moving away from the averages. So, you see, man, this happens a lot. The price moves away from the averages several times, but eventually it returns to the averages, and then makes a new
[03:07] push, okay? So, man, that was exactly the idea behind scalping fishing. We wait for the price to move away from the averages, and then, in a selling scenario, we wait between the averages to start fishing here, looking at the
[03:21] price, making a short position, you understand? Doing a scalping. For moved away from the averages. We wait to find a price that falls between the averages so we can make a short-term trade. The same applies at the point of purchase. The price has
[03:34] moved away from the averages within a buying scenario. We waited to find a price between the averages so we could make a short-term purchase. short buy operation, doing scalping, you understand? And, man, when I
[03:47] understood that, I realized it was possible to identify zones where the price was more likely to react. And that's when I started testing. I pulled the graph back and I saw that it made sense. I saw that the moving averages crossed
[04:01] upwards, with the support of the McD, forming a dynamic support zone. And the downward-crossing averages, supported by the MCD (Moving Common Divisor), formed a zone of
[04:13] dynamic resistance. And there I also realized something else : I was no longer trying to guess what the price would do. I was looking for evidence, I was looking for probabilities. And it was at that moment that this vision became the basis for
[04:26] most of my strategies to this day . Hey man, remember those three questions that were holding me back at the beginning? Where exactly do I come in? When am I most likely to be right, and when should I stop believing in a trend? Now
[04:39] I had all the answers. Let's get to the question: where exactly do I fit into the operation? Wow, in a buying scenario I enter the trade between the moving averages. Simple as that. This is my entry point. So, in that case, if
[04:52] the price moves away from the averages, my entry point, as I said, will be between the moving averages, you understand? And here comes question number two. When am I most likely to be right? Wow, we have a better chance of success when we
[05:04] buy between the moving averages, with the MACD supporting it, that is, with the MACD confirming the upward trend, the upward movement. So, at the points where I perform these operations, in this case buying, having the support of MAC gives me a
[05:17] better chance of success. And the third question is when do I stop believing in the trend? In this case, for example, we have the moving averages crossing upwards, but the MAC is crossing downwards, meaning the MACD
[05:29] is not supporting the buying movement. So, it's much riskier for me to try to buy in this situation here, look, than it was back here, when I had the support of the MACD. So, when I don't have the MACD, which is the
[05:42] support indicator, supporting the movement, that's when I stop believing, in this case, in the upward trend. And look how crazy that is, right, man? Three questions that initially puzzled me for months were answered by two moving averages and a
[05:55] MACD. So, man, a simple, beginner-friendly strategy gave me exactly what I was looking for. But of course I didn't stop there. Over time, I refined this concept more and more, making my
[06:08] strategies increasingly reliable. And look how interesting, the indicators have changed, the settings have changed, but the foundation, man, the foundation remains the examples. Look at this, man. Instead of using just two moving averages,
[06:23] I could have a strategy where I use a third moving average of 305 periods. Instead of using the MACD, I could use the Arum oscillator indicator with 200 periods. And why, man? Because the Arum oscillator does
[06:38] n't just show us the trend, it also shows us the strength of the trend. If the Arum bars go below here, look, -75, I know the downtrend is strong. If the AROM bars are above the 75 level, I know the
[06:53] trend is strong, you understand? So, man, these changes already make the strategy more reliable. Just look at this situation, man. The moving averages at that point oscillator was also showing an
[07:06] was demonstrating that the upward trend had strength, right? Since the bars are above the 75 level here, then, in our strategy, we could be buying when the price retraces between the moving averages,
[07:21] right? Because Arum would be supporting the moving averages. So we could be making short trades between the moving averages. But from this point on , look, Arum has already started pointing out weaknesses to us. Based on this candle
[07:36] weakness in the downtrend. So, from this point on, we wouldn't do was already signaling to us that this was likely to happen. Look, the price was going to end up leaking through the moving averages. If we were
[07:51] using the MACD instead of the Arum oscillator, we would perform this operation here, look closely here, because the MACD was still showing us an upward trend. And there are several other situations where the Arum oscillator in this
[08:05] 200-period configuration would save us from having to perform this type of operation. Then you realize that a simple change has already made the strategy more sophisticated. Here's averages crossed upwards. If we were to use the MACD as support, we would
[08:21] buy here in this region, look, between the moving averages. And the price, look at that, it broke through the moving averages again. But if we used the Arum oscillator indicator instead of the MACD, we would never make a trade here, because the
[08:34] Arum indicator wasn't showing a strong upward trend, right? It was showing a weak upward trend. Not to mention, man, that this third moving average, the 305- period average, filters the trend much better
[08:47] . avoiding multiple false signals. For example, if we weren't using the 305- period moving average here, and were only using the two moving averages, the averages would be showing a downward trend because
[08:59] 305-period moving average is passing through here, it would already be showing us that the trend wasn't yet downward. Look at the price going down and then going into an upward trend, you understand? So, man, this third moving average combined with the
[09:13] Arum oscillator makes the scalping strategy even more robust. What does this using different indicators that give us more confidence in both upward and downward trends . But the logic is the same. It's the
[09:28] same logic as scalping and fishing. Take a look now, man, at a really extreme example. This is the 10- record chart for the mini-index. And here we have four ATR stops. The first has a deviation of three, the second a deviation of four, the
[09:42] third a deviation of C, and the fourth and last have a deviation of D6. All of them are 20 periods of the elitm type. And at the bottom we have here, man, the flow diffuser, where the setting I put is medium-long 72, medium-short 17, then
[09:55] medium-long 72, medium-short 17, then DF- 72, DF+ 144. This here, man, looks quite different from the Scalpa Pescaria, right? Yes, man, it's different, but the concept is the same as scalpescaria. Just imagine that ETR stops are
[10:09] moving averages. So, when they are all green, we have an upward trend, an upward movement. If the flow diffuser has all three moving averages crossing upwards, it's as if the MACD is supporting the
[10:21] upward trend, you understand? And then when the price pulls back to this zone here, look, at the ATR stops, with the support of the flow diffuser, we can make a short operation, in this case, a buy. And you 'll find plenty of examples of that
[10:34] in the chart, right? And then, when the ETR stops turn red, and the flow diffuser also shows the downward trend, when the price returns to this ETR stop region, look here too, we could
[10:48] be doing a short sell operation, a short scalp, okay? So, dude, the concept is simply the same. You can identify the trend using ETR stops and the flow diffuser. You have the entry point, which in the case
[11:02] of a buy operation is in the region here, look, from the stops to the green. And then when the diffuser stops confirming the trend, for example, confirming the upward trend and the ATR stops all turn red. The
[11:15] selling region, right? The entry point for selling would be here, look, even at the red stop losses, you understand? Provided, of course, that the flow diffuser is supporting it. Like I said, man, it's different from scalpescaria. Yes, but the concept is the
[11:29] same as scalpescaria. Identify the trend, wait for the pullback in the support or resistance zone, enter the trade if you have confirmation from the support indicator, and stop believing in the movement, whether it's
[11:43] upward or downward, when the support indicator ceases to support the movement. Do you see the pattern, man? The indicators changed, the settings changed, even the chart type changed. In this case, we are using the
[11:56] Renco chart, but the fundamental principle is the same. So, man, sometimes the simplest concept leads you to success much faster than chasing complex strategies that you can barely execute. And in the beginning, I wasted
[12:09] a lot of time until I understood that the way forward was to learn a simple concept that works. In this case, the simple concept was scalpescaria. Two, test until you understand why it works. In this case, it's because I had a dynamic support and
[12:25] resistance zone and a supporting indicator. Three, refine as I progressed. So, I started changing the indicators, I started changing the timeframes, I started adding new things that improved the results I was getting
[12:40] using pure scalping, which was just two moving averages and a MACD. And four, repeat the process. In other words, I was doing all of that again to develop new strategies, you understand? With
[12:53] ever-increasing accuracy and greater reliability. Listen, if you don't have the time or the profile to develop strategies from scratch and you want ready-made, up-to-date strategies, don't worry, I
[13:07] have a solution for you. In my complete Pilsar 3.0 method training, you will find the same strategies and robots that I use in my daily work. And that's the key difference. These strategies are constantly monitored and
[13:21] updated by me and my team, man. Because, man, one thing is for sure, strategies don't end up working the same way forever, because the market changes and strategies need to evolve along with it. Look, the
[13:35] strategies I post here on YouTube are educational content; they don't include supervision. I don't update the strategies that are here on YouTube, but the strategies and robots of the Pilsar 3.0 method follow a
[13:49] strict update schedule. So, if any strategy falls short of our performance criteria, well, we'll update it for you. Simple as that, understand? Hey there , the spots for the Pilsar 3.0 method are open now, but only
[14:03] Pilsar 3.0 method are open now, but only until October 31st at 11:59 PM, okay? And then it closes. So it's only until the end of this month of October. The link is in the description and also in the first pinned comment. I'll see you in the
[14:15] members area, okay? Hey, before you go, answer me one thing. Which of these three questions is holding you back the most today? Where to enter? When is the best time to succeed, or when is the best time to break the trend? Comment below, I want to know where
[14:28] you're having trouble, okay? And dude, every Sunday I bring content like this, I bring strategies straight to the point, in an objective way, without beating around the bush. So leave a like, subscribe to this channel with notifications turned on, because, of
[14:41] course, I'm not going to rest until you become a successful trader. [Music] [Applause]
[15:30] [Music] [Applause]

⚡ Saved you 0h 15m reading this? Transcribe any YouTube video for free — no signup needed.