The Strategy That Almost Bankrupted a Brokerage
43sThe controversial story of a strategy that nearly bankrupted a firm but made money for many creates high curiosity and engagement.
▶ Play Clip
[00:02] known by many as the strategy that almost bankrupted the Ike brokerage firm. I know, I know it might sound like a joke, but believe it or not , this was a strategy that
[00:16] put a lot of money in a lot of people's pockets. And the Option brokerage strategy, especially since not everyone used it. But I guarantee you that if everyone had used this strategy during
[00:32] strategy during its peak period, then yes, option would have lost a lot of money. And today I'm going to teach you what that strategy is and how to use it. Does it still work today? Does it work
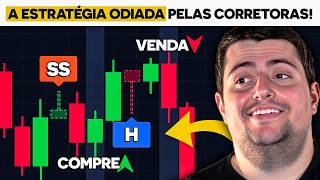
[00:45] with other brokers? Stay there, I'm about to reveal everything to you. The strategy is based on, and has as its principle, these two candlestick patterns. The name of this strategy is strategy T5. And if you've been in the market for a while, you've certainly
[00:59] heard of this strategy. She uses these two patterns in a simple and straightforward way. And besides, there's a way for you to automate it. She wo n't click for you, but she will appear exactly when you should
[01:13] perform your operation on the chart. Then it becomes very simple, you just have to look and repeat. But first, I'll show you how the strategy works. As I said, it's a strategy based on two candlestick patterns. Here on the side, we
[01:27] have the hammer pattern. And it can be either green or red, but what defines this candlestick pattern is a shadow size at least 2.5 times those who don't know, the shadow is that thin part, the body is the thicker part of the
[01:42] sail. On the right we have the shooting star pattern, or shuring star. The You'll soon understand why I'm saying their names in English, okay? Furthermore, ideally, for it to be a perfect pattern, there should be no
[01:57] shadow on the opposite side. So this would n't be a good enough standard to be considered perfect. And that wouldn't be good here either. So ideally, it shouldn't have one. too much about that, because as I told you, you're going to automate this strategy and it
[02:12] will show you exactly only the valid signals for you to trade with it. And here's one last detail: even though we're here to talk about strategy, I want to teach you about the market. These two candlestick patterns
[02:24] will only be called hammers or shooting stars depending on their location on the chart. So, for example, the hammer, it is only considered a hammer when it is in a downward trend movement.
[02:36] So, the market is falling, this candlestick pattern appears, it's a hammer pattern that theoretically will cause the price to rise, okay? That's in theory; in practice, you'll see that it doesn't end up impacting the price that much,
[02:50] especially on 1- minute or 5-minute timeframes, but because of the pattern, it ends up presenting a very good trading opportunity, which is precisely the trigger for the T5 strategy. And the shooting star will appear at the top, so an
[03:04] upward trend has emerged, and then theoretically the market will fall, okay? So, how would we easily understand if the pattern is downtrend? Simply use a moving average, a 50-period moving average for
[03:19] example, a simple moving average, which is a trend indicator. And when the would indicate an upward trend. And then we would look for the shooting star pattern were below average, we would only look for the hammer pattern,
[03:33] we're going to do in an automated way. I'm not even going to use moving averages; I'm going to implement the automated strategy directly . And for you to do this, it's important that you use the website tradingview.com, which is a 100%
[03:47] free site where you can analyze various charts from different markets. use, which is Binex, is that it pulls the charts directly from Binance, and we can see all the charts here on Binance in real time,
[04:01] okay? Another important detail is that the broker I use, TradingView chart. Exactly the TradingView chart. We have the same tools, everything is the same, you just can't automate the strategy there, but
[04:15] you can just open a new tab on your computer or phone and configure it when a signal appears. So let's go, I'm going to teach you now, in practice, how to configure it. Stay tuned in a moment,
[04:28] number of wins and also what management strategy you should use with this approach. Okay, let's click on " indicators" up there. We'll be there for technical information and here for standards. Mine is in English, so it's pattern. That's
[04:42] precisely why I taught you the names of the patterns in English. Look, you see it brag by showing off my English accent, no. It was because we were going to need to use it, okay? Here in chart patterns and below are the candlestick patterns, which
[04:55] what we are going to use. And we have to configure the only two, Shuring Star, the shooting star. So, we come here to Hummer, I clicked, and then to Shuring Star. Let's look here, Shuring Star. Okay,
[05:09] I clicked. OK, our two candle patterns are now configured. So you on the image that's appearing. You can see that there's already an input, there's already an automated configuration by TradingView itself, which is the "detect
[05:23] trend based on" feature. This, translated, means detecting the trend based on... And here we already have an SMA, which is a simple moving average with a period of 50. So it's already taking the moving average into account to show us whether it's
[05:38] a shooting star or a hammer based on the trend, okay? And by the way, look at this crazy thing, it's over, we just had two first-round wins here 'm recording this, we've had a victory, and a first-round victory at that.
[05:54] Beauty? Look how cool. Right now, in real time , I'll practically explain to you why and how you're going to use the strategy. So, let's go. I'll use the chart itself directly here. How are you going to do it? As soon as
[06:07] a hammer or a Shuring Star appears, it will have this light blue background and this little red symbol here. It appeared, it doesn't matter what color that candle is, okay? What matters is that this entry indicator appears . So, as soon as it appears,
[06:21] you'll observe the next candle, okay? The next candle will be green, and as it 's closing, you'll perform a trade so that the next candle is the opposite color to it, okay? Remember? You will observe the color and
[06:37] movement of the candle that comes after the signal. Then the signal came, regardless of the color. Look at the next candle. If the next candle is green, the one after that has to be the opposite. So, in this case, it was a green candle, and then the other one, which is this one
[06:50] here, would have to be the opposite, which is a red candle. What happened here? first-round victory. And just now, the same thing happened . The color of this candle doesn't matter here. Here we had a red candle after the signal. And what should the next one be
[07:04] ? The opposite, right? In other words, what is the opposite of red? Green. Right? And real time. That's enough already, right? We have to wait and see what color this candle is, and the next one has to be the opposite. But here's a
[07:19] detail you'll also learn about the management aspect: you have three consecutive attempts to get that entry right. Whether you win on the first, second, or third try, it doesn't matter, you'll profit. If you win
[07:31] on the second try, you recover the loss from the mistake on the first try and end up with a profit. If you win on the third try, you recover the losses from the first and second tries , but you still finish with a profit and it's considered a take, okay? So
[07:43] here we had, here we had a green candle and this one has to be a red candle. If it's a red candle on the first try, which is what it looks like it's going to be, it's an instant win. But there's a very important detail I need to
[07:55] following. You can see that this candle here was green by a very small margin, look. I'm going to zoom in here. It was green by a very small margin, right? When this pattern occurs here, it's called a doji pattern, which is a pattern of
[08:07] indecision. From my point of view, okay? In general, so you don't get confused, when a doji appears, it's best not to trade on that signal, okay? So you don't get confused, because sometimes you look at the doji, it's green, but
[08:21] in reality the price hasn't gone up, it opened and closed at the same price. It will only between the previous candle and the current candle, you understand? So it's best to avoid trading when there's a dojo because it slightly reduces the reliability of the signal, okay?
[08:35] would have been a first-rate victory. Now I'm going to show you an example that isn't a first-round victory because we had the standard. That candle was green, this one has to be the opposite. First-rate profit. Here we had the pattern, this candle
[08:49] was red, this one was green, first profit. Right? Here we have a victory on the second attempt. So, look, the signal candle. That was a green candle, and this one was supposed to be a red candle, but it was green,
[09:02] so you would have taken a loss, and then with the next candle you would have won, okay? It's OK. But what is the amount you need to deposit? Very simple. You'll get in here on your first try. Let's assume you're trading with
[09:14] low values. The minimum amount you could trade with on the brokerage I use would be... So you would start with a zero balance, you entered with a zero balance here and you took a loss. So you lost pity. What are you going to do on the next entry, at the very end of this one, if
[09:27] you just move on to the next candle. So, how much would you contribute? You would enter much would you contribute? You would enter with 2 and in that case it would have been a victory. and then entered with won. This
[09:42] won. This profitable operation will cover the losses from the previous operation, and you 'll even end up with a profit. The payout from the brokerage I use is at least 90% for trades in the new
[09:54] options model. So you invested $2, you win 90%, how much do you win? For 1.80 you pay one and still have 80 cents left in net profit, a positive profit for you in your pocket, okay? Ah, but let's suppose I don't win on the first try or the
[10:11] second, okay? Here's an example, look, the strategy pattern was followed here. Here was green, but it resulted in a loss. That was supposed to be green, but it resulted in a loss. And this place was supposed to be green, and it was green. So you won on your last try.
[10:25] How much did you lose here? Here you lost, you're putting red. D negative. Then you lost, but here it is. You lost, oh. And
[10:38] how much did you put into that green candle? You entered with $4 and then you won the trade. Entering a then you won the trade. Entering a $4 trade and winning, you recover the three, which is the sum of the last two, and still have a profit,
[10:52] profit of at least 60 cents. Keep in mind that it's a small profit, but it's in dollars. And it's only low because I 'm simulating with small trades; with larger trades you can achieve a higher profit. But remember that if you
[11:06] lose all three trades in a row, it's a relatively high loss. So the risk-reward ratio, let's say, is not so favorable when you use Martingale management. So you have to use it in the right way, with the right strategies. And
[11:21] don't be surprised if you encounter a negative cycle right away. It's going to be a backup. can easily adopt and backtest at home. Before you listen to me, try out what I'm telling you. Then you test it and see if it works for you, okay?
[11:36] You'll see that this is a strategy that really brings positive results if you base it on everything that has already happened in the chart from today backwards, which is what we call backtesting. And it was a profitable strategy all these
[11:49] last few days, using it correctly with the right management. So, even if you take a hit after three consecutive losses, it's a big setback, yes, but you can compensate for that by winning little by little.
[12:01] Remember, focus on the process; the result will follow. To learn more subscribe to the channel, like this video, and YouTube will start You can also join the Binary Class, which is my exclusive content,
[12:15] but it's free. It used to cost R$ 2,000, and now you don't have to pay description; you'll also find a live trading group with proven profitable results. It has a link to the brokerage firm, a link to Bicass, and a link to the
[12:28] signals room. Go ahead, get started, create your account, do all the necessary things, and let's your account, do all the necessary things, and let's make money.
⚡ Saved you time reading this? Transcribe any YouTube video for free — no signup needed.