
3-Minute Binary Options Strategy Revealed!
42sPromises a quick, effective strategy that professionals use, creating curiosity and high engagement.
▶ Play Clip"The title promises an 'amazing strategy' and delivers a specific Bollinger Bands + RSI method, though results are not proven."
This video presents a trading strategy combining Bollinger Bands and RSI indicators for binary options. The strategy aims to identify overbought and oversold conditions by looking for simultaneous crossovers of both indicators' upper or lower levels, with a recommended expiration time of 3-4 minutes.
The video introduces a trading strategy using Bollinger Bands and RSI indicators, claiming it is highly effective and used by professional traders.
Add Bollinger Bands without changing default settings, then customize colors: upper line thickness increased, middle line changed to white with reduced opacity, lower line changed to white with increased thickness. Add RSI indicator with period set to 13.
When price crosses the upper Bollinger Band and RSI crosses its upper level simultaneously, it's a bearish signal (overbought). When both cross lower levels, it's a bullish signal (oversold).
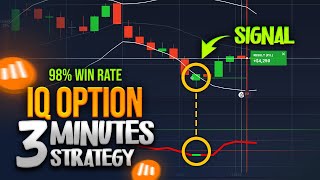
The presenter opens a trade on IQ Option: market broke lower Bollinger Band and RSI broke lower level, indicating oversold. He recommends expiration time of at least 3-4 minutes to allow the trend to develop.
Another trade to the downside is opened when market broke upper Bollinger Band and RSI broke upper level, indicating overbought. Again, 3-4 minute expiration is advised.
The presenter encourages practicing the strategy on a demo account before trading real money and asks for feedback.
The strategy relies on simultaneous crossovers of Bollinger Bands and RSI to signal overbought or oversold conditions, with a recommended expiration time of 3-4 minutes. Practice on a demo account is advised before live trading.
What two indicators are used in this strategy?
Bollinger Bands and RSI.
00:02
What RSI period is recommended?
13.
00:55
What does a simultaneous cross of upper Bollinger Band and upper RSI level indicate?
A bearish signal (market is overbought).
01:37
What does a simultaneous cross of lower Bollinger Band and lower RSI level indicate?
A bullish signal (market is oversold).
01:49
What minimum expiration time is recommended for trades?
3 to 4 minutes.
02:29
Strategy Logic
Core concept of using dual indicator crossovers to confirm overbought/oversold conditions.
01:09Expiration Time Advice
Emphasizes the importance of giving the market time to move, avoiding very short expirations.
02:29[00:02] option strategy video I am making on my Channel today I am going to show you an amazing strategy with very effective results in just 3 minutes stick with me till the end to learn this amazing strategy we are using Ballinger bands
[00:14] and RSI indicators for this strategy but don't worry this is not the same strategy you've tried before this is highly effective and many professional traders who trade in stock markets are even using this amazing strategy on
[00:26] trading view platforms so first I am going to add our indicators first Ballinger bands search for Ballinger bands and click on it now don't change any settings here go to the color and display settings change the upper line
[00:41] thickness a little bit now change the middle line color to bit now change the middle line color to white and decrease the opacity a little bit finally change the lower line color to white and increase the thickness a
[00:55] little bit okay now let's add the RSI indicator Ator search for it and click on it in settings change the period to 13 and leave other settings as they are
[01:09] bit and click apply now listen carefully this is how the strategy works when the market crosses the upper Ballinger line there is a possibility the market will turn and start going downwards but not every
[01:24] time sometimes Market candles break the upper Binger line but nothing happens and the market still goes higher so that's why we use the RSI indicator when the market crosses the upper Ballinger line look at the RSI indicator if the
[01:37] RSI indicator crosses its upper level and also the Ballinger bands cross their upper level at the same time that's a bearish signal for us because both the Ballinger bands and RSI indicators are showing the market is overbought
[01:49] indicating the market should go down for the next few candles also when the Ballinger bands and RSI both cross their lower line at the same time it's a bullish signal for us in the next few candles the market is likely to move
[02:01] upwards okay now let's open a trade in IQ option using this strategy here look because the market broke the lower Ballinger line and also the RSI indicator broke the lower level that means our Market is oversold and now the
[02:16] market is likely to turn and start moving upwards also remember when we open a trade we need to give some time to the market to move in its Trend because the market is always fluctuating it's important to follow the current
[02:29] trend so opening trades with very short time periods can be very dangerous for this strategy therefore open a trade with at least 3 or 4 minutes of with at least 3 or 4 minutes of expiration time okay let's wait for the
[02:56] try to open a trade for one last time today here I am opening a trade trade to the downside because as you can clearly see the market broke the upper Ballinger line and also the RSI indicator broke the upper level that means our Market is
[03:08] overbought and now the market is likely to turn and start moving downwards I'll need to give some time to the market to move in its Trend so opening trades with very short time periods can be very dangerous for this strategy therefore
[03:23] open a trade with at least 3 or 4 minutes of expiration time okay let's wait for the result
[03:35] strategy that I wanted to show you practice this in your demo account first before you get into the real deal let me know how the strategy is working for you and subscribe if you want to learn more binary options strategies I will see you
[03:47] binary options strategies I will see you in my next video peace
⚡ Saved you 0h 03m reading this? Transcribe any YouTube video for free — no signup needed.