

The Mistake That Gets You Stopped Out
42sDirectly addresses a common trader frustration with a clear, relatable problem, promising a solution.
▶ Play Clip"Title promises to explain why you get stopped out, and the video delivers by teaching BOS vs CHoCH, which directly addresses that issue."
This video explains the critical difference between a trend continuation (BOS) and a trend reversal (CHoCH) in trading. The presenter, Kirill, teaches how to identify these structural signals to avoid confusing a pullback with a real reversal, ultimately improving trade entries and stop-loss management.
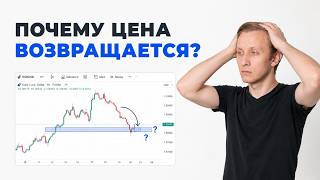
Traders often mistake a continuation of a trend for a change in movement direction, leading to premature entries and stop-outs.
Market structure reveals who controls the market (buyers or sellers) and provides the first signal when the situation changes.
BOS (Break of Structure) confirms trend continuation; CHoCH (Change of Character) signals a potential reversal.
BOS occurs when price breaks and closes above a previous significant high (uptrend) or below a previous significant low (downtrend) with the candle body, not just a shadow.
CHoCH happens when price breaks a previous local low in an uptrend (or high in a downtrend) for the first time, indicating a change in market behavior.
In ICT methodology, CHoCH is also called Market Structure Shift (MSS). Both terms refer to the same signal of a change in market character.
Often, a liquidity grab (false breakout) precedes a CHoCH: price takes out stops above a high, then reverses and breaks the opposite structure.
1) Continuation or change of character? 2) Was there a liquidity grab? 3) What timeframe am I analyzing? Higher timeframe sets context, lower provides entry.
Not every candle is a BOS or CHoCH. Focus on key levels that truly change the picture to reduce noise.
BOS confirms trend continuation; CHoCH warns of a potential reversal. Understanding this difference leads to conscious, not random, entries.
Mastering the distinction between BOS (trend continuation) and CHoCH (change of character) is essential for disciplined trading. By asking three key questions before each trade and focusing on higher timeframe context, traders can avoid false signals and improve their decision-making.
What does BOS stand for in trading?
Break of Structure.
00:42
What does CHoCH stand for?
Change of Character.
00:42
How is a BOS confirmed in an uptrend?
Price breaks and closes above a previous significant high with the candle body.
02:05
What is the key difference between a BOS and a liquidity grab?
A BOS closes with the body beyond the level; a liquidity grab only touches with a shadow and returns.
02:29
What does a CHoCH indicate?
A change in market behavior, the first hint of a potential reversal or deep correction.
03:19
In ICT methodology, what is another name for CHoCH?
Market Structure Shift (MSS).
04:10
What often precedes a CHoCH?
A liquidity grab (false breakout) that takes out stops before reversing.
04:59
What are the three questions to ask before every trade?
1) Continuation or change of character? 2) Was there a liquidity grab? 3) What timeframe am I analyzing?
06:40
Why should you start with a higher timeframe?
To determine the global BOS/CHoCH and the overall market direction before looking for local entries.
07:19
What is the main takeaway about BOS vs CHoCH?
BOS confirms trend continuation; CHoCH warns of a potential reversal.
08:28
The Common Mistake
Identifies the core problem traders face: confusing trend continuation with reversal.
00:02Structure is Everything
Emphasizes that market structure is the foundation of understanding who controls the market.
00:30BOS Definition
Provides a clear, actionable definition of BOS with the important nuance of body vs shadow.
02:05CHoCH Definition
Explains CHoCH as a change in market behavior, not necessarily an immediate reversal.
03:19Liquidity Grab + CHoCH
Reveals the classic pattern of liquidity grab followed by structure change, a key insight for entries.
04:59Three Questions Framework
Provides a simple, repeatable mental checklist to avoid emotional trading.
06:40BOS vs CHoCH Summary
Succinctly contrasts the two signals: BOS says 'continue', CHoCH says 'prepare for change'.
08:28[00:02] and you think: "That's it, a reversal." You enter a trade, set a stop, and an hour later you get knocked out, and the price goes where you expected. Are you familiar with them? The problem is not the confusing the usual continuation of a trend with a change in the nature of the movement. And these are two
[00:17] traders, unfortunately, don’t distinguish between them at all . And today I will teach you to see this difference. When I first started smartmania, I thought that the main thing was levels, zones and liquidity. But the deeper I delved, the clearer
[00:30] one thing became: everything starts with structure. It is this that shows who really controls the market: buyers or sellers. It is she who gives the first signal when the situation changes. Today I want to talk about two key
[00:42] signals of the structure: Boss and choke. I will highlight four points. And first of all, what is Boss Break of Structure? Next, what is CH, change of Character, and how is it related to the fact that on the network it is called Market Structure Ship. then
[00:55] how they work together with liquidity collection. And finally, I will give three questions that I ask myself before every transaction. And after watching this video to the end, you will stop confusing a pullback with a real reversal and will see
[01:07] when it is worth following the trend, and when it is time to prepare for a change in direction. Also, if you're watching me for the first time, my name is Kirill, I've been trading for 4 years, and I work with the IC and SmartMoney systems on Forex, gold, and crypto.
[01:21] so you can see that with the right approach, it's possible to achieve I have Telegram channels Free trading community. There I analyze show where the boss is formed, where the
[01:35] choke appears, and how this is related to liquidity and entry zones. If you want to this on graphs and in real time, the link is in the description, follow it. Let's start with the most basic. Structure is simply how the price moves up or down.
[01:50] the previous one and each new low is also higher, the market is rising. If, on the contrary, the maximum, the minimum becomes lower, the market falls. All. I have already talked about this in detail correctly, in a separate video. Today we move further into these two signals
[02:05] that work on top of the structure. Now we are talking about the first Boss Break of Structure signal. Imagine the market is going up. Each new high is higher than the previous one and each new low is also higher. And at some point, the price breaks through the
[02:17] previous significant maximum and closes above it. This is the boss. Breakdown of the structure according to the trend. Prino seems to be saying: "I continue to move and the trend is alive." And an important point: a boss is not just a touch of a level or a candle
[02:29] whose shadow flies beyond the level and immediately returns. The boss is precisely the closing of the candle by the body behind the key high or low. That is, the market did not just touch, but actually broke through and consolidated. And if they closed only with a shadow, this is not a boss, this is a
[02:42] liquidity collection. They knocked out the stops and came back. In an uptrend, a boss up confirms the continuation of the trend. In the downtrend, the boss down confirms that sellers are still in control of the market. And this is a signal that the structure is preserved and
[02:54] we can continue to look for entries in the direction of the main movement. And remembering one simple thing. The boss is not just a technical signal. This is a reflection of the real behavior of market participants. When the price breaks through a key level and
[03:06] holds, it means that one of the buying or selling parties has imposed its strength and displaced the opposite party. This is the result of big capital continuing to push the price in the chosen direction. And the cleaner and more confident
[03:19] this breakout looks, the higher the likelihood that the movement will continue further. Now let's talk about chck Change of Character. That's a whole other story. Chock is not about continuation, but about a change in market behavior. Imagine
[03:31] that the market has been going up for a long time, forming higher highs and higher lows. And suddenly, instead of another higher low, we see that the price breaks through the previous local first zanok. For the first time in a long time, the market broke its usual pattern. Chok is
[03:46] not always an immediate reversal of the global trend, but it is a change in the nature of the movement. held control, an aggressive seller suddenly appears, breaking through an
[03:58] important minimum. And here I want to make one important note so that you do n’t have any confusion in the future. In the IC methodology, this same process is called Mark Structure Shift or a change in market structure. The logic is absolutely the same. The market breaks
[04:10] the structure in the opposite direction and shows that the nature of the movement the name. If you hear Market Structure or Chok from me, it is the same signal of a change in market behavior. I'll be using both in my analyses,
[04:23] so get used to them right away. And always keep in mind that CHC or Market Structure Shift is not just a breakout of a level in the opposite direction. It is always a combination of factors. Speed of movement, appearance of aggressive candles,
[04:35] reaction to key zones. Sometimes the choke is formed smoothly, sometimes abruptly. But in both cases, this is the first signal that the market no longer wants to move according to the old rules. And to reinforce this, the boss is a confirmation of the trend. A choke or
[04:47] Market Structure Shift is a change in character, the first hint of a reversal or this difference, you will stop confusing a simple pullback with a real change in direction. And that's already half the battle.
[04:59] connection with the liquidity dispute. Very often the front. The market first takes away liquidity, that is, it knocks out stops. For example, we have an upward trend, a maximum is formed, then a correction, then the price approaches this
[05:12] maximum again. They make a false breakout with a shadow, take away the stops of those who placed them above the level, and only after that does it sharply turn down and break through the previous minimum. This is a classic scenario. First a liquidity grab,
[05:24] then a choke. And the key point is that the removal of liquidity in itself is not a choke. It's just a collection of stops. A shock occurs when, after this breakout, the market changes structure and breaks through a key minimum or maximum in the
[05:37] opposite direction. The boss, on the contrary, often follows the impulse along the trend. For example, the market took liquidity below the lows, turned around and went up. And at some point it breaks through the previous maximum and closes higher. This will be the
[05:51] boss. Confirmation that a new upward structure has formed and the trend continues to develop. When a choke occurs, don't think in terms of now we're bullish or now we're bearish, think in terms of a change in the nature of the movement. The algorithm
[06:04] simply stops collecting liquidity from one side and starts from the other. This is not market sentiment, it is a regime switch. It's a subtle point, but it makes a big difference to perception. And how to use it in real time? Let's talk
[06:16] about this. In theory, it all sounds quite simple. But in the real market, structures are formed candle after candle. And many make the same mistake: trying to predict a boss or a choke in advance before the market actually confirms its
[06:28] intention. And this leads to extreme entries, false expectations and unnecessary stops. Therefore, your task is not to guess, but to observe. Wait for the market to show itself. And only after that make a decision. To simplify this
[06:40] process, I have identified three questions that you should ask yourself before each transaction. First question: what do I see now: a continuation of the structure or a change in character? If the price breaks through the opposite level for the first time in a long time,
[06:53] this is a spike. The market may be preparing for a reversal or at least a deep correction. Second question: was there any liquidity collection before this? If you see that the front market first took stops behind the highs or lows, and then sharply
[07:06] turned around and broke through the structure in the other direction, this is a strong signal. And this is not a random movement, but a conscious scenario. First they took the money, then they changed direction. Everything is as usual. And the third question. What time frame do I
[07:19] look at the structure on? The boss and the choke on the minute and on the four-hour chart are two different stories. The higher timeframe sets the context, and the lower one provides the entry point. You timeframe inside the usual correction on the hourly timeframe. If you don't understand the context,
[07:34] you'll be trying to catch a reversal where the market is just pulling back. Therefore, always start with a higher time frame. Determine where the global boss is, where the global choke is, and in which direction the market is really heading. Only then go down
[07:47] below and look for a local structure to enter. And if we speak in very simple words for complete beginners, do not press the button just because it seems to you, well, there seems to be a reversal here or, well, the trend seems to be continuing. Look at the facts. A
[08:01] boss is when the market confirms its direction. A choke is when the market breaks its usual pattern for the first time. If you see a pose in a trend, you work in the direction of this movement. If you see a CHOK, after capturing liquidity, you
[08:13] sides, and you begin to look for new areas of interest in the other direction. And one more important point. Don't try to see the boss chok in every candle. Structure is not key levels that really change the picture. And the less noise you take
[08:28] into account, the cleaner your analysis will be. And let's sum it up: the boss is confirmation. Chock is a warning. The boss says, "We continue." Chock turning around." And when you begin to see this difference, your entries
[08:41] become not random, but conscious. If you watched this video to the end, it means you really want to stop trading blindly. Boss and choke are not just two terms and smartmania. On the network, these same signals are called Boss and
[08:53] Market Structure Shift. And their logic is absolutely identical. This is the foundation on which an understanding of price movement is built . This is what separates a trader who is in control from a trader who is being tossed around by the market
[09:05] Telegram channel, I publish real trading setups for gold, Forex, and crypto, entry points, stops, and take profits, plus training and answers to all your questions. comment. Come on in, I'm waiting for you inside. Also, if you want more
[09:20] in-depth analysis of structure, liquidity, and smart money, subscribe to let me know in the comments what topic I'd like to discuss next. And finally, I will tell you: trade consciously, trade with discipline and, most importantly, with
[09:33] discipline and, most importantly, with understanding. See you in the next video.


⚡ Saved you 0h 09m reading this? Transcribe any YouTube video for free — no signup needed.