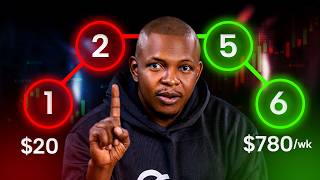

3 Trades, 2 Timeframes, All Profits
43sStarts with proof of success (3 profitable trades) and immediately challenges the common practice of using too many timeframes, creating curiosity and relatability.
▶ Play Clip"Delivers on the promise of a simple two-timeframe system with real trade examples, but the heavy promotion of the copy trading platform in the latter half feels like a sales pitch."
This video presents a simplified trading framework that uses only two timeframes—the 1-hour and 5-minute charts—to identify professional-level entries. The creator demonstrates the system using three real trades (EUR/USD, GBP/USD, AUD/USD) and emphasizes the importance of waiting for confirmation on the lower timeframe to improve risk-reward outcomes.
The creator took three trades from a specific zone, yielding a 3.68 R on the first, and both GBP/USD and AUD/USD trades closed in profit, all using only two timeframes.
Using multiple timeframes (monthly, weekly, daily, 4H, 1H, 15M, 5M) leads to confusion, missed entries, early entries, and poor analysis.
The 1-hour chart provides direction (structure, areas of interest, buy/sell bias), while the 5-minute chart provides entry confirmation (change of character).
On the 1-hour chart, a change of character and break of structure indicated a downtrend. The area of interest was a supply zone with a fair value gap and Fibonacci golden zone.
Waiting for a 5-minute confirmation (change of character) reduces the likelihood of being stopped out compared to entering directly from the 1-hour zone.
The EUR/USD trade had a risk-reward ratio of 3.6, and for a 50k prop firm account risking 1%, this setup would yield $1,840.
On the 1-hour chart, there were two areas of interest (breaker structures). The 5-minute chart showed no confirmation at the first zone, so the creator waited for the second zone.
The trade was taken with a target, but in hindsight it did not hit the full target. However, the creator was satisfied with a partial profit, as the trade was taken simultaneously with EUR/USD and AUD/USD.
Similar to GBP/USD, the AUD/USD had a liquidity sweep and breaker structure. The creator noted that a sweep below often leads to a sweep of the top, and confirmation was needed on the 5-minute chart.
The creator has a non-negotiable rule: do not take a trade if the risk-reward ratio is less than 3. This ensures only high-probability setups are taken.
The hard part is being on the charts at the right time. To solve this, the creator is building 'Copy Me', a copy trading platform launching by end of June, where users can automatically copy his trades.
The video provides a clear, simplified trading framework using only 1-hour and 5-minute timeframes, emphasizing confirmation and a strict risk-reward rule. The creator also promotes his upcoming copy trading platform as a solution for those who cannot monitor charts constantly.
What are the two timeframes used in the trading system?
1-hour and 5-minute timeframes.
00:45
What is the role of the 1-hour timeframe?
To determine direction, read structure, and mark areas of interest.
01:14
What is the role of the 5-minute timeframe?
To wait for confirmation and take the entry.
01:29
What is a change of character (CHoCH)?
An indication that sellers (or buyers) are taking over the market, used as a confirmation signal.
05:38
What is the minimum risk-reward ratio required to take a trade?
At least 3:1.
10:53
What was the risk-reward ratio of the EUR/USD trade?
3.6 R.
05:25
How much profit would a 50k prop firm account make risking 1% on the EUR/USD trade?
$1,840.
05:53
What is the name of the copy trading platform mentioned?
Copy Me.
11:47
Simplified Timeframe System
Provides a clear, actionable framework that reduces complexity for traders.
01:01Confirmation Reduces Risk
Highlights the psychological and practical benefit of waiting for confirmation to avoid stop-outs.
03:50Strict Risk-Reward Rule
Emphasizes discipline and risk management as a core part of the strategy.
10:53The Hard Part of Trading
Acknowledges the real-world challenge of monitoring charts, which is a common pain point.
11:21[00:02] the 1 hour. I took a short from this zone right here and it gave me a 3.6 8 R. The next is pound dollar already at 3.6. The third one is also dollar at
[00:14] These are three trades and they all closed in profits and I only used two time frame for every single one of them. The thing is that many traders are looking at too many time frame, monthly, weekly, [music] daily, 4 hour, 1 hour,
[00:29] 15 minutes, 5 minutes. If you're doing this, it only gets you confused and up with too many time frame. This then leads to miss entries, early entries, and miss analysis. What I want to do in this
[00:45] video is make it simple for you. I'm going to show you the only two time frame needed to find professional level entries, the 1 hour and the 5 minutes time frame. I will use the three real trades I took to show you how it's done.
[01:01] By the end of the video, you will have a complete framework you can apply to any complete framework you can apply to any pair, any market starting today. Let me break this down before we go into the trades. The 1 hour time frame give you
[01:14] direction. That is where you read the structure. That is where you mark your areas of interest. That is where you decide if you're looking to buy or to sell. The 5 minutes time frame give you entry.
[01:29] That is where you wait [music] for confirmation. That is where you take the trade. That is the entire system. Direction on the 1 hour, entry [music] on the 5 minutes, two time frames, nothing else.
[01:43] Now, let's start with the EUR/USD. You can see we are on the 1 hour time frame and [music] this is a clean market structure. We're making We had a change of character here which signifies we're about to come down and from here where
[01:56] um break of structure at the downside, break of structure at the downside. This is the last break of structure here, which also means that we should see a retracement [music] and another break of structure. This is the market structure.
[02:10] >> find here is simply our areas of interest. The way I do this is that one, I look for supply zone. So in this chart, this is my supply zone because we
[02:22] have a fair value gap at this region. [music] This forms my supply zone. This is the 1-hour supply zone. Another thing I do is that I look for the Fibonacci zone. Okay, from this top if we have a
[02:35] Fibonacci and you draw it [music] to the bottom this way. So the yellow lines, is my Fibonacci zone. As a matter of really classic break of structure, sometimes I take this all the way to
[02:51] this high. So I can mark the whole of this zone as my Fibonacci zone. But anyway, let's just keep it simple. So this is my Fibonacci golden zone. This is now my area of
[03:04] whatever you call it. All I'm interested in on how to take >> a trade here to go down and target this particular That is it. Now mind you, I could do this and I used
[03:21] to do it before. I could just go to take a short position from this point, okay? Target the high and go this [music] low. I'm getting a very bad risk to reward
[03:35] one, I'm also getting I'm getting a here, but the thing is that this chart can just continue [music] this way and take me out. Okay? But if I wait for a confirmation
[03:50] >> [music] >> I am less likely to be taken out of this trade. So for that confirmation, we're going to go straight down to the second time frame we need. All we want to see is a [music] change
[04:04] So playing this forward, this then becomes our internal break of structure here, and this low you see here becomes >> [music] >> the zone where we break we are now more
[04:19] trade. Okay, now look at another thing here. You can see as we're going up, >> we have a tiny um break of structure here. too tiny, so I'm not going to consider it. I'll just let it slide. Okay, this
[04:34] don't want to consider this as well because it's just So this one when I have the next break of structure here, this one is Okay, because of this, this becomes the area where of interest if
[04:49] is broken down to the downside. So once this is broken with a proper candle body closure, then we are now interested in taking this trade. So take take this trade. Take a short position and we target the
[05:01] We enter this region and where do we target this? If I get a up to three, then I am [music] good with this particular trade. So this is a point I would have taken this trade in real time.
[05:25] reward ratio at 3 points um six was is about six eights and I is here. So this is a very clean [music] trade because when the change of character happened here,
[05:38] this is a change of character. It's just an indication that the sellers are taking over this market that we can now enter this trade. So that is it on this particular trade. Now, for a trader with a 50k prop firm account risking 1%
[05:53] [music] trade, that is a $1,840 from this one setup. The next one is a pound dollar. We are on the 1-hour time frame. What can you see here? We can see structure again. So, we have a liquidity sweep here, but we have breaker
[06:08] >> [music] >> another breaker structure here. So, where is our area of interest? There are two of them. One is this one above [music] here. Okay, which we can still get back into.
[06:22] Another one is this one here. This one that led to the immediate break of structure we have here. And this is where confirmation entry on the 5 minutes becomes really important because if we go down to the 5 minutes
[06:36] [music] time frame, you'll observe something. You'll observe that we never got a confirmation on this time frame. If you look at this, all this never really broke. They were all just
[06:49] liquidity sweep that is going on. This is what [music] makes confirmation entry go ahead and taking [music] a short position from this particular point without a confirmation entry and think I'm all good and good,
[07:07] So, it's important you wait for confirmation [music] entries before you since this area of interest did not give you a confirmation, the next area of interest that we're looking at, especially since that we've entered into
[07:20] an efficient zone here, is this area of interest [music] above here. So, I'm just going to wait for the chart to get there before I go to the lower time frame, 5 minutes, [music] to look
[07:33] for a change of character. >> [music] >> You can see we can start looking for
[07:47] area of interest from this zone. So, from here we can now go to the 5-minutes to look for that. So, what can you see? One is [music] this. This is a change
[08:01] internal breaker structure. [music] Even if this doesn't look significant to you, from this point from here it's significant enough. Okay, which means that this is a level that we want broken before we consider
[08:16] >> [music] >> in this region. So, from here we can now go a bit one is broken with [music] a candle by the closure. We can then go ahead and place our two here, target this
[08:30] and where do you target? The bottom. to around this region. Okay?
[08:42] Which is [music] midway to this from this break. Let's go to the 5 15 minutes to make it faster.
[08:54] here. Even though this is my target from my trade, I am very okay once I get to a Because in hindsight this trade did [music] not actually go ahead to hit this particular region. But this trade was taken at the same time
[09:10] with EUR/USD and the AUD and when they were at this point >> [music] >> GBP did not hit the targets. So, this is how this is how this trade played out. Now, let's look at the AUD.
[09:26] For the AUD, this is exactly the same thing. There's There's really nothing over here we didn't get a breaker structure. We got a liberated [music] this is AUD/USD
[09:41] >> and EUR/USD and GBP/USD are showing dollar strength. [music] So, uh because of that, we can consider this to be >> [music] >> as well um follow through.
[09:57] What I have discovered um is [music] that when you have a sweep below, it's usually signify that the top as well is going to be taken out, which is will also into this particular zone [music] above. And another thing
[10:10] you have to watch out for again in just like we had in pounds dollar is this Because [music] we needed confirmation entry, we would not have taken this particular trade from this particular um zone. Now,
[10:23] let's go to the 5-minute timeframe and see how this also plays out.
[10:53] trades, I used the same exact framework. 1 hour to find the area of interest, 5 is it. [music] And there is one more rule I follow, and that ties to all these together. I do not take [music] a trade if the
[11:08] risk-reward ratio is not up to three. If the math doesn't give me a 3-hour minimum, I [music] don't take the trade. I wait for the next one. This is non-negotiable for me. Now, the hard part of this
[11:21] isn't learning the framework. The framework is simple. You just watch it and I showed you how it's done. The hard part is being on the charts at the right time, on the right pair when the 5-minutes confirmation prints. Most
[11:34] people can't do [music] that. They have jobs, they have families to attend to, they miss the setup by 20 minutes, and the trade is [music] gone. This is exactly why I'm building Copy Me. Copy Me is a copy trading
[11:47] platform where real traders, including me, take the entries, and your account automatically copies the same trades in real time. So, when I take a setup like the EUR/USD I just showed you, every Copy Me user that is copying me in Copy
[12:01] Me take the same entry, the same [music] stop loss, the same targets. You don't have to be on the charts, you don't have to spot the 5-minutes confirmation yourself. The trade just shows up in your account according to the risk you
[12:14] set per trade. We're launching by the end of June. The waitlist is open. The link is in the description. Now, everything I just walked you through, >> um it works for swing trades. The 1-hour for direction, the 5-minutes
[12:27] for entries. But, what if you can't wait for swing trade? What if you only [music] have a few hours a day to trade? There is a [music] different version of this system for day traders, and the
[12:40] time frame are completely different. I'll show you that >> [music] >> in this next video.
⚡ Saved you 0h 12m reading this? Transcribe any YouTube video for free — no signup needed.