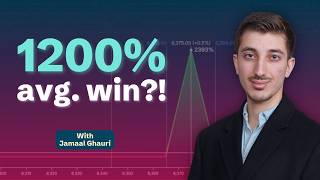

52% Win Rate, 1,200% Average Gains
45sThe extreme contrast between a low win rate and massive returns creates curiosity and challenges typical trading beliefs.
▶ Play Clip"Title promises a zero DTE strategy with huge returns; video delivers detailed mechanics, indicators, and risk management—mostly legit."
This video presents a zero DTE (Days to Expiration) options strategy on the SPX index, using narrow butterfly spreads to achieve asymmetric risk-reward with wins ranging from 1,000% to 5,000%. The strategy relies on a 52% win rate, technical indicators, and dealer gamma positioning to predict the market's closing price.
Zero DTE butterfly on SPX, European-style cash-settled options, entered around midday, targeting huge wins (1,000-5,000%) with a 52% win rate.
Call butterfly: sell two calls at expected pin strike, buy one call above and one below (narrow width 5-15, typically 10). Max loss is debit paid (~$40-50 per contract).
Enter between 12:00 PM and 2:00 PM Eastern, sweet spot at 2:15 PM when Greeks shift. Use limit orders to get best fills.
Use RSI divergence, DSS Bresser indicator, trend lines on 5-min chart, and dealer gamma profile (positive gamma zones act as magnets).
Scale out starting at 3:00-3:30 PM when profit tent is reached. Close half at 300-500% profit to guarantee win, then scale out every 5 minutes. Leave only ~10% for expiration.
Gamma (delta change per spot move), Vanna (delta change per volatility change), Charm (delta change per time decay). These drive dealer hedging and pin location.
Max loss is 100% of debit. Position size max 1% of portfolio (typically 0.5%). Strategy rated 7-7.5/10 risk with knowledge.
Average winner 1,200%, median 750%. Annual return 52% using only this strategy. Setups occur every 2-4 weeks on average.
The zero DTE butterfly strategy offers asymmetric risk-reward with defined risk, but requires deep understanding of dealer gamma dynamics and active management. It is best paired with a consistent high-frequency strategy like iron condors for steady returns.
What is the typical win rate of the zero DTE butterfly strategy?
52%
02:50
What is the average winner percentage in this strategy?
1,200%
30:41
What is the maximum loss on a zero DTE butterfly trade?
100% of the debit paid (typically $40-$50 per contract).
28:18
What is the recommended entry time window for this strategy?
12:00 PM to 2:00 PM Eastern, with sweet spot at 2:15 PM.
07:28
What are the three second-derivative Greeks mentioned?
Gamma, Vanna, and Charm.
24:52
How does gamma affect dealer hedging?
In positive gamma zones, dealers hedge opposite to price movement, pulling price back to the mean. In negative gamma zones, dealers hedge in the same direction, exacerbating moves.
14:25
What is the typical strike width for the butterfly?
5 to 15 points, with 10 being the sweet spot.
05:06
What percentage of the position is typically left for expiration?
About 10% (maximum 20%).
22:14
What is the annual return of this strategy according to the guest?
52% per year.
31:27
How often do ideal setups for this strategy occur?
Every two to four weeks on average.
31:39
52% Win Rate with 1,200% Average Win
Demonstrates asymmetric risk-reward where a modest win rate yields high profitability due to large winners.
02:50Dealer Gamma Hedging as Price Magnet
Explains how positive gamma zones create mean-reverting forces that help predict pin levels.
14:25Second Derivative Greeks: Gamma, Vanna, Charm
Introduces advanced Greeks that sophisticated traders use to understand dealer positioning and edge.
24:5252% Annual Return with Low Frequency
Shows that a high-risk strategy can be profitable with proper risk management and patience.
31:27Alpha Decay and Untraditional Approaches
Emphasizes the importance of finding unique edges before they become widely known.
37:45[00:00] the wins are anywhere from 1 to 5,000 percent. So, the average winner is actually 1,200 percent. It's It's very hard to to lose money with this strategy. If you're keeping that 52% win rate, Today, we will present the zero
[00:13] DTE options strategy that can make you many more times than what you risk. But, there is, of course, a catch. Welcome Shamoun Bari.
[00:26] Hey, John. Great to see you here. Excited to look forward to the episode. Okay, let's get straight to it. Give us the 40-second version of your options essentially a zero DTE butterfly on the SPX.
[00:44] Uh we use the SPX because it's European settled and is European style and cash settled. So, you don't have the risk of early assignment. Uh you get very good liquidity, good strikes, and essentially what you do is we have a bunch of
[00:56] indicators which we'll cover. Uh and we look to enter around midday to essentially get a little bit of a pin on the actual index and kind of scale out as the market moves in your favor, moves into that profit tent, and you go for a
[01:10] huge wins. And typically, uh the wins are anywhere from 1 to 5,000 percent. These are huge huge wins. Very hard to get the max profit and be that accurate. Uh but, we have some some methods of really accomplishing that
[01:23] more often than not. Okay, this is exciting. I'm curious how you get to that point. But, tell us first about yourself a little bit, especially as an options for about 7 years now. I've been trading ever since high school. And my
[01:40] senior year of high school, actually right after I graduated, I secured myself an internship at Raymond James Financial. And from there, I went back for a second year. I actually got a lot of my institutional experience from
[01:52] there talking to the analysts, the traders, a lot of higher-ups. And it makers are required to hedge their positions. And in that, you can actually have a sense for where the market is going to go, when it is going to go
[02:08] there. And using options, you can structure both a profit target and a profit time. And it's very flexible. Obviously, options are a lot more flexible than futures are. And it really just gives you an an easy way to
[02:20] structure a high probability trade with an asymmetrical risk reward comparative strategy? Of course, yes. So, this strategy is a
[02:34] very high risk reward trade, but it doesn't have the highest win rate. So, tickets. A lot of people use these butterflies to hedge even, but what we're trying to achieve is a optimized risk reward. And again, a lot
[02:50] of the wins are anywhere from 1,000% to 5,000% because we use these very narrow uh strike prices, and the actual time of entry will be around midday, and the win rate is only about 52%, but when your win rate is 52%, that's really all you
[03:06] need when your risk reward is so high. So, all we're trying to achieve is seeing where the mo- momentum is bringing the index and trying to pin it by the end of the day, specifically in the last 30 minutes. Uh and obviously,
[03:18] with butterflies, the closer you get to expiration, the more profit you're going market is going to close at the end of the trading day. Let's start with the
[03:30] basics. What is a butterfly trade? Sure. Yes, so a butterfly, there is a few different kinds. There is call flies and put flies. I typically use call flies, and essentially, what that is is you are selling two calls and you are
[03:45] buying two calls. And all you do is you sell the two calls on the strike that you expect the market to pin at, and you buy the two calls in a sort of usually an equilateral uh type of fashion for this strategy. Uh but sometimes people
[04:00] will skew the strikes to get more of a broken wing broken wing butterfly. And um yeah, so it brings sort of a tent-like structure to the P&L chart, and we can actually pull that up soon, and I can kind of go over the mechanics
[04:13] of how the butterfly works, and how the options Greeks actually play into profiting off of them. Yes, let's bring up an example trade so people understand it. Sure. Yeah, so I'm on Option Strat here.
[04:27] So, right here we're on the SPX. Uh the market is closed right now, so we won't reference, but essentially, just like I said, we're going to buy two calls and
[04:39] sell two calls. This is just referred to as a call fly, and we pick the March 31st. All we want to do is figure out what the market is going
[04:53] to pin at. So, let's say we think it's going to pin at 6375. We're going to sell two calls right here at 6375. And then for these butterflies, we like to go very, very narrow, usually
[05:06] anywhere from 5 to 15 width, usually 10 is the sweet spot. So, let's just go for a 10. You do one at 6385, and you buy the second one at 6365. And this is about one DTE out, so you can
[05:21] see the max loss is going to be 100%, and the max profit is going to be obviously huge. It's very rare that you're going to get this entire thing because this is if it closes directly in the middle on the penny, exactly at 4:00
[05:34] p.m. Eastern time at market close. So, usually what we like to do is wait a little bit for that, uh and as it moves in your direction, you can see the curve starting to flatten. As time goes on, this will heighten, and usually around
[05:49] 3:00 p.m. to 3:30 is when we start to scale out, and you can see that's when range, and you can actually see that even if you're not in the range, right? These two strikes right here, you can be slightly outside of it, but since
[06:03] there's still some time until market close, you can still be up a couple hundred of percent. So, it's a very flexible strategy to use, and it's actually very easy to manage. And it cost you only $40 to put up a one
[06:18] contract. Correct. Yes, so especially with these to be. So, we can go right here to contract value. We can see if we're buying it right away, uh it's going to be 0.44, which is a
[06:33] very small price to pay. And by the time you're getting close to expiration, say we were to start scaling out at 3:30, and we're we're in our range, it's going to be anywhere from about one on the the sides of it, and you can al- already get
[06:47] all the way up to three, which if you go to profit and loss, it's going to be about 700% and you still have the last 30 minutes to go. And obviously with these butterfly structures, you want them to stay in that range as the market
[06:59] closes and go all the way to the max profit and get as close as possible to this number right here. There is, of course, as I said, a catch, and the catch here is that you need to hit that very narrow
[07:13] profit tent. And I think it's time to explore how you make your bets and how you try to estimate where that profit tent will be. And let's start with the entry mechanics. For instance, what what time
[07:28] of the day do you put on this trade? Yeah, so typically we like to do it anywhere from 12:00 p.m. to 2:00 p.m. Eastern time. Typically, we might extend that a little bit more with the sweet spot being right
[07:41] at about 2:15 p.m. Eastern time. That is usually seen as the inflection point when the Greeks, the risks from each one, specifically theta, Vega, and Delta, start to shift. So, that's seen as the inflection point. Uh 2:15 on the
[07:56] dot is the sweet spot, and we like to give about a 15-minute window, but earlier, uh around 12:00 p.m. or a little bit later around 3:00 p.m. But,
[08:08] uh in that 2:15 p.m. Eastern time window. And how many trades do you put on? Uh it it depends on the the contract
[08:20] size. So, what we like to do, if we go to SPX right here, essentially, when we're doing the strategy, what we like to see is more of because it replicates it very easily, where we open uh on the day and we kind
[08:36] Uh with this strategy, we don't want to see any huge, extreme, and violent smaller candles, we don't have any extreme volume, extreme news events,
[08:50] anything really skewing the results. And then, in this specific case, we can see that once we kind of get around 2:15 p.m., out and go for a reversal. And what we'll do is one entry right here on the
[09:06] into it as it goes. So, as it continues chopping around, we'll continue adding a few more contracts and trying to get the best fills possible on these plays.
[09:19] But, are you then uh with the different trades I'm trying to hit several several end points, or are all the trades on the same with the shorts on the same strike? So, all all of these are on the same strike. So, when we do our first entry,
[09:33] we already have a very good idea of where the market is actually going to pin based off some of those indicators we're going to discuss. And we're we're basically betting every single entry on that pin. Uh we're not saying, "Oh, it
[09:46] going to do one of each or a skewed ratio, anything like that." We have our data that tells us where it's going to pin with a high probability, and we just
[09:58] follow exclusively that pin. How many trades might you do on this pin? Uh how many trades as in how many contracts or Uh no, how many how many entries might you do on that pin?
[10:12] How many entries? Got it. So, usually it's only about one to three. And that this day where we see our 215 mark right about here, but we can see a little bit
[10:25] exact zone. So, in in a day like this, we would just set limit orders trying to get the best fill possible, and we would get about two to three entries on this
[10:37] day. Maybe one right here on this push down, one right here on this wick, and then if we're lucky, we might get filled one more last time before we push up. Uh but if there's a situation where it just spikes down, we get filled immediately,
[10:49] and then we get sort of a more violent push back up, more of a quicker push, limit orders and let the market decide how much it's going to give us. Everyone
[11:01] is now curious. How do you decide your pin? So, obviously that's the the the golden ticket right there. So, we have a bunch of things that we use in order to Uh the easy version is obviously the technicals on the TradingView chart.
[11:20] this, we use basic trend lines. I like to use the RSI, as you can see right here. And then this indicator down here, it's called the DSS Bresser. This is
[11:33] also a very useful indicator. And what we like to do time. And step one, like I mentioned previously, we want to see a slow drift
[11:45] it. Uh we want something like this. And all we do is see a a simple trend line. much. Uh I see if there's any type of support, something like this.
[12:03] here it's been sloping down even since the previous day, right? So, we're kind of in this channel right here. And first off, we will are going to look at the RSI. And anyone who's been trading for
[12:16] any decent amount of time can tell you what this is, a bullish RSI divergence. again, that 2:15 window, it's really that we're indicating a reversal. And
[12:30] without this bullish RSI divergence as confluence, you don't really want to line up. So, that's that's step one. And then step two, once we see that we're in a bullish divergence in price action, and I like
[12:45] to do this on the 5-minute chart. Uh you can go to the 15 as well. during this consolidation phase, we start to cross below this bottom orange
[12:59] band, which is set to 20, and we start to curl over. And this curling motion, it's very similar to the MACD. I'm sure that's uh more familiar uh indicator for switching over. And using these few technicals is all we do for TradingView.
[13:17] Uh these few indicators are all you need. And then the other side of things, which is where most people are uh really you're this type of information, is going to be secondary derivatives. And I use a proprietary model that I have
[13:31] built, but there are a lot of great options Greek really services out there. For example, options depth, spot gamma, there's VS 3D. All of these are great. They do exactly the same thing. But
[13:44] essentially, what those will show is something called the dealer profile. And I'll just draw it out. Very simple to understand. And you have nodes on this side. Something like this.
[14:01] nodes are in a second. And then you'll also have nodes on this left side. Something like this. And usually for this type of setup, you want the nodes
[14:13] on the left to sandwich these nodes right here in the right. And essentially, what this is is the dealer inventory, and it shows you the positive and negative gamma and the dealer positions. And what that essentially
[14:25] hedge their positions. In positive gamma, which is this right side, dealers are going to have to essentially fight against whatever the price is doing. So
[14:38] if the price shoots up, dealers are going to have to hedge their position, it back to the mean. And vice versa. If the price shoots down, they're going to mean. And this process is positive gamma hedging. This is what dealers do all day
[14:57] long. And because they they want their delta to be zero. So this is what we look for. And already, with this intact, we can see that this is very conducive specific range in order to hedge their positions, this is going to be a very
[15:15] very strong confluence for a potential place that price will pin at the end of the the So that's that's how the positive side works. The negative side is completely the opposite as you would imagine.
[15:27] When price gets to these negative ranges, they're often seen as test levels because instead of hedging the opposite way, dealers will have to hedge the same way. So, if the market goes up, dealers are going to have to hedge by
[15:39] domino effect, a chain reaction, a snowball effect, whatever you want to call it, it will just create these very violent moves that are much more extreme and very hard to predict and they're seen as test levels because when you
[15:53] interact with these negative gamma zones, usually price will get here and then have an exacerbated move away from it back into a positive gamma zone where it will then compress and that will lead to a pin. And again, to to conclude
[16:07] here, that's why we like to see this positive gamma really sandwich between offer this type of data. Very simple to use. A lot of them are very quick, very
[16:19] updated and anyone can have access to any sort of this data at all. So, in this example you are showing here, I guess it's a little bit difficult to read the numbers for people, but where did you which day was this and where did
[16:34] Right. So, this day is Wednesday, March 11th. So, nine times out of 10, I'm sure everyone knows in here that the VWAP is a commonly used indicator. A lot
[16:48] of banking algorithms are actually based around the VWAP. And this VWAP is actually going to nine times out of 10 coincide with the pin. So, right here on this specific day, we pinned right here at 6775.
[17:03] going to blindly pin this price. It's because one, yes, we look at the VWAP, obviously it's right here, but two, we have the bullish RSI divergence. Now we have two checks. The next check box is we have this
[17:19] brezer starting to cross over and the last check box is that we finally have positive gamma in this area covering this nice little a bit of a cushion, right? Because we are going very narrow 5 to 10 width
[17:33] on this specific day. I believe it was a 10 width that we played. So not not much room for mess up, right? If we get rid of all this and we map out the levels of a 10 width, you can see that it is a decent amount of room, but you can't
[17:46] get to caught up. So this would be the one side here. So again, decent but still very narrow range and we want it to be
[17:58] directly in the middle to capitalize on that multiple thousand percent win. So that in common, again just to recap the view up, the RSI divergence, the brezer coupled with the negative and positive gamma all kind of sandwiching a specific
[18:13] area on the map is what's going to give you a high probability trade in order to pin the price at close and the butterfly structure is going to be the elite option when you are capitalizing on that profit potential. You said that you put
[18:27] in limit order awaiting for the good price. How do you determine which price of the market and again some of the volatility, the VIX, the VRP and all of
[18:41] those other metrics, but typically anywhere from 0.4 to 0.5 in that range is going to be seen as a fairly decent buy that you can start getting into and around this window, what I like to do is just one market order for one single
[18:55] contract, kind of get a gist of how it moves because sometimes on these limit orders to see how low we can actually go. Some I will set
[19:07] conservatively very close to market and some I will set a little bit more aggressive in case of for example any big wicks like say example this one it would give us just a very decent fill. So I always like to just set one
[19:20] market order and then the rest of the limit orders kind of surrounding that in order to ensure that I get the best price possible. Um typically you would pay around 40 50 for one contract.
[19:34] sooner you can get a little bit of a better deal and when you kind of get to the later end sometimes it's a little closer to 55 60. So it also does depend slightly on the time of day. And just to repeat this 40 50 that you
[19:50] paid that is your max loss on that trade. Correct. So these are going to be debits all debits so whatever you are putting in the max loss is that you can't have a you know something like a credit spread or iron condor where
[20:03] you're taking huge you know 800% losses. This is completely capped on your risk. How do you get out of the trade? Do you just let them expire with no management or do you manage them sometimes? So nine times out of 10 we're going to be
[20:16] managing them. So great question. What we typically do is we'll usually have some sort of channel whether it's you know a downwards channel a wedge some type of technical structure however you believe in them whether you
[20:28] believe in them or not we kind of just base it off of that. So for example here we have a downward wedge. What we'll do is start to scale out at the break of whatever structure we're in. So as soon as we break out of here
[20:40] this upper trend line we're officially in this zone where our tent our profit tent our P&L graph that we looked at in option strat is officially in the green. And this move when we're getting in all the way back here
[20:53] couple hundred percent say at this time at about 3:30 we'll already be up say anywhere from 3 to 500%. So at this stage we usually like to close at least
[21:08] you're up at least 3 to 500% and you're closing half of your position, you are now guaranteed to win on that trade, right? Even if the rest goes to zero, you're still making a net profit, and that's a decent size profit. Uh and then
[21:23] from there, I like to scale out every 5 minutes. I'll take off a chunk of the position. Uh and again, depending on how fast it is moving. In this case, it kind of consolidated very, very uh very nicely.
[21:36] hold more until expiration. But sometimes, these rallies will go a gamma, right? If it does end up reaching that negative gamma zone, going through
[21:50] it, it will move up very fast, again because the move is exacerbated, and So, it does take some active management. It does unfortunately take a little bit
[22:02] of discretion sometimes, but watching the price action, really gauging how strong it is, seeing the volume coming in, and seeing the strength of the positive gamma in relation to the negative is going to give you a very
[22:14] good idea of how fast you should be scaling out, and in what sizes you leave for expiration? I'll usually only leave about a 10th. nicely. We didn't have any huge moves uh threatening to breach our side. So, in
[22:32] this case, I left about 20%. Uh but I really recommend going no more than 20% at an absolute max. Uh 10% is typically what I go for. Again, the only reason why I went a little heavier on this time was just because it was a very
[22:46] uh very clean example to to watch play out. So, this requires pretty active management in the end of the day. Correct. Yeah, so in the beginning of have an idea of how the market is moving. You don't want to just, you
[23:01] know, blindly enter. You only really have to get on the charts and then about that window, that 2:15 we talk about over and over. And then really in the last 30 minutes to 1 hour is where all of your effort is going to be because
[23:15] the managing of the of the the butterfly is really all the skill. Anyone can enter it here, anyone can see this window and and find a pin based off the gamma chart and the indicators. Anyone can do that. The actual thing that takes
[23:28] practice is managing it when it hits that 3:30 mark and when it's that final 30 minutes of the market. And you have to sit there, really gauge the strength derivative Greeks as well, not only gamma, but also understanding vanna and
[23:45] these things is really what gives you such a substantial edge. It's very rare that you have a strategy uh with a pretty decent win rate, right? 52%
[23:57] nothing special. Uh what makes it special is the risk reward relative to the win rate. Most traders that uh have an incredibly high uh incredibly high risk reward strategy, a lot of their win rates are going to be
[24:10] much lower and that's because that's just the nature of the strategy. Uh but the nature of this strategy, the reason why we're able to really optimize that calls for. And knowing how to manage it, uh scaling out responsibly, managing the
[24:27] risk, uh back testing and always being very, very diligent is what gives you And Jamal, you you're mentioning the second derivative Greeks, uh vanna and
[24:40] charm. Just spend 10 seconds explaining what what do they Greeks, there's there's four, but three main ones are going to be gamma, vanna,
[24:52] and charm. Those are the three that that we use for the strategy. There's also single fourth degree as well. But for the purpose of this strategy, all you need to know are gamma, vanna, and charm. Gamma is going to be the change
[25:07] in delta based on the spot price change in the underlying. So, what that means is for example, say we have our our chart up again. All the positive gamma on this side uh essentially every every trader should
[25:22] much your options contract is going to change per $1 move in the underlying. So, you have an options contract with a delta of 0.2 and the underlying goes up
[25:35] by $1, your options contract is going to go up by this amount. And the gamma is essentially that same relationship where if your gamma is say 0.2
[25:48] and uh the underlying goes up by $1, then that means that your delta is going to go up by 0.2. So, to make it simple, I like to think of it as a analogy where you look at speed and acceleration. When you're driving a car, delta is the speed
[26:05] and acceleration is the gamma because the gamma is the rate of change of the delta. So, that's gamma, uh second-degree derivative. Everyone should know delta, that's one. Uh the second one is vanna. Vanna, not not
[26:19] terribly important to understand all the mechanics, but all vanna is very simple is that same change in delta. So, again, say your delta is 0.2, vanna is going to be the change in this delta and instead of relating to the spot price movement
[26:34] in the underlying like gamma, it's going to be related to the volatility. So, if the volatility increases or decreases, then because of vanna, your delta is also going to change. And the last one is charm, right? So,
[26:47] say you have your same 0.2 delta over here. Charm is the same exact change in Delta, but unlike Vanna, it's not the volatility. Unlike Gamma, it's not the spot price movement. Charm actually reflects the change in Delta as time
[27:01] passes on. Right? If your if your Delta at this stage is .2, and say it goes even though the price didn't move at all, and the volatility didn't move at
[27:14] all, uh the the time moved. And that time move is what affects your Delta. So, those are the three derivatives. Doesn't matter too much why they work. Um it matters how they work and why it works, or how it works, excuse me, is
[27:29] their Delta to zero. Uh and usually what we like to see that in these positive Gamma environments, we like to see that, okay, all of these are going to be
[27:41] affected by these three main second derivatives, and if we know these second derivatives, if we can calculate them, for example, having this Gamma chart over here that we can look at, we can actually see the amount that these
[27:53] dealers are going to have to hedge, how that's going to affect the price, and again, that is just going to give us an incredible edge over everyone else, because we're going to have a super high probability of knowing where the dealers
[28:06] are going to push the market uh and set our pin there. And that's that's the name of the game. We have to talk about the risk. What is the worst that can happen with this strategy? So, the worst case scenario with this
[28:18] strategy is a 100% loss. So, since it is a debit, uh you can only lose 100% of what you put in. You will never have something blow up and move against you by 1,000%. Uh and and that way it makes it fairly easy to to manage your risk
[28:33] just using a basic stop loss. I always ask my guest to rate their strategy on the risk profile scale, where one is very low risk, and 10 is very high risk.
[28:45] And you are free to define these numbers as you see fit. Where would you place this strategy? You know, traditionally, trade. I'd put it at a nine or a 10, but as Warren Buffett likes to say, or I
[29:03] uh they say that risk is the is the absence of knowledge. And if you have enough knowledge, you can actually reduce the risk. So, by learning, backtesting, and actually practicing the strategy, after I've been doing it for a
[29:17] a seven to seven and a half on on the risk scale. The benefit, um from a risk perspective, is of course that it is very defined risk. You cannot lose more than what you pay. And
[29:32] if you play if you don't do many contracts, it doesn't need to cost you a lot. Absolutely. That is the the best part, right? So, since the risk reward is huge, you don't have to be risking these these huge amounts. Usually, what
[29:44] I would do in terms of position sizing is stay very conservative. I will never go then it more than an absolute max of a 1% total position, meaning that if everything goes wrong, the most I can lose on my portfolio in one day is only
[29:58] 1%. And using this, I I typically go even smaller, close to half a percent of risk, and say that half a percent of risk with a 2,000% max profit can turn
[30:10] into much more return on on the portfolio. And obviously, 2,000, 5,000, 1,000, whatever the the risk reward ends up being on that specific day, uh it's of using the strategy. Let's talk about your results. You have already mentioned
[30:28] that you have a win rate of 52% on these trades. But I guess the how much you win will vary a lot from couple of dollars to a a
[30:41] Can you say a little bit how these wins distribute? Of course, yes. So, the average winner is actually 1,200%. close to 4 to 5,000%. Uh but most commonly, if we're going
[30:57] with the median, it will be about 750% for for the win. And using that, uh it's it's very hard to uh to lose money with this strategy if you're keeping that 52% win rate. And by by managing it, right? Remember where where where we're scaling
[31:13] out, uh especially in that last 30 minutes to 1 hour of the market, uh it's it's very easy to to keep this as a profitable strategy. And using these methods, uh the strategy actually performs at an annual return of 52% per
[31:27] year. Uh but that the issue with the strategy, even though it's so beautiful, has so many strengths, is that we don't get these plays too often. Usually, we'll only get one of these every two to four weeks. And so, what I like to do is
[31:39] couple other strategies with it, but using this strategy, it will do very well. You just have to have the patience in order to wait for the setups and make statistics of the the optimization that's been done on it. So, you are
[31:55] Correct. Every every two to four weeks. In some market conditions with very low volatility, it will happen more often. Sometimes, it'll happen three or four times in a week, but on average, uh every two to four weeks is is what you
[32:10] were 50 something percent, that is on the average capital that you Yeah, that is 52% and average annual return using only this strategy.
[32:28] Right. Let's sum up. How will you sum up this strategy in a few words? Yeah, so the way I would sum up this strategy is that it is really a home run type of play where your win rate isn't anything extraordinary. I know there's a
[32:42] lot of strategy out there with 80 90% win rates but low risk reward. This is the opposite. You're sacrificing that win rate for a heavy hitting win. And by really just accepting a lower win rate, again that 52% win rate, you're able to
[32:57] achieve very high risk rewards that are very in your favor. And by doing that and learning how to scale out appropriately to mitigate a lot of the risk that's associated with these zero DTE strategies, you can not only keep a
[33:11] high win rate, but you can keep a high reward also. So it kind of gives you that asymmetric skew that's really going to just increase the performance. How does this fit with other strategies that you trade, especially zero DTE
[33:24] strategies? So it fit if it's exceptionally well. A lot of zero DTE strategies are high frequency, meaning a lot of these traders will do zero DTE spreads, iron condors, lots of things.
[33:38] volume of trades, high frequency of trades. And they'll get them very often. So I always recommend coupling this strategy with a strategy that you do get lots of trades. That way you don't have to sit
[33:53] there and go, you know, a week or two while doing essentially nothing all day. And by having another strategy as a backup that you can consistently rely on for small gains, that really gives you the ability to wait and be exceptionally
[34:06] patient so that when this day does come, you finally hit it, you know what's giving you and have a a huge home run. And really coupling those creates a a
[34:18] really nice harmony that just will greatly increase the the performance of your portfolio. And what is your zero DTE backup strategy that allows you to do many trades? Yes, so it does depend on the market
[34:32] condition. Obviously, every good trader out there uh skews their strategy based on the market environment they're in. Uh recently, though, uh since since 2026, I have been doing a lot of zero DTE iron condors where I will enter a 10 delta
[34:48] iron condor right at open, take advantage of that first initial volatility spike, right around the first hour. Uh if you actually go back and back test this, you'll see, but the first 30 minutes of the market be a
[35:01] certain direction, and the next 30 minutes will typically be a retracement. up a decent amount, usually anywhere from 40 to 60%, and you start to manage
[35:13] strategy that we've been using. Uh and it's very consistent. And since it's an iron condor, uh it's a credit strategy, you won't have any huge wins like the butterfly, but it's just consistent, small gains every day, and that allows
[35:28] us to wait for these home runs that the butterflies are going to give us. What type of stop loss are you using on those? So, for the iron condors, it I uh the simple one that I suggest using is a just a 100% of max credit. So, your your
[35:42] risk reward is only going to be one to one, but what I typically like to do is not use a stop loss, and I will actually delta hedge the position where if if we breach a certain level, I will put on a put spread or even a butterfly or a
[35:55] debit spread or even a butterfly in that same direction right below or above that essentially act almost like a market maker like we just talked about. You
[36:07] reduce your net delta to zero, and in in a case where it's going to lose your trade, where you would have blown up your entire condor and taken a big hit, uh you're actually, most times, either breaking even or even profiting, uh even
[36:20] when you're wrong. So, it is a one of my favorite go-to strategies for uh for consistency. Um I guess this is a topic for another interview to dig deep into that one. Moving back to this
[36:35] your CRDT butterflies, what are the two or three most important takeaways you want the audience to remember from this interview? I'd give two. So, the one would have to be the quality of data is going to matter a ton when you're doing
[36:50] these more complex strategies. This isn't a strategy that you can, you know, just something like a break and retest where it's very step one, step two, step three, you either win or lose. This is something where there's multiple steps.
[37:03] the the mechanics that actually move the market. And by understanding that, you are developing as a trader. You're getting more knowledge than your
[37:15] prepared, whoever has spent the time studying will inherently have an advantage over people who haven't. And that edge that you develop on your own
[37:27] is going to really give you that that boost of performance. And this doesn't just go for the butterflies, this obviously goes for any And the second thing that I'd take away is to really just use untraditional
[37:45] approaches. Everyone knows about alpha decay in strategies where as soon as everybody knows about something, it stops working, the alpha decays, there's no more advantage if everybody knows it. So, by
[37:57] these secondary Greeks that people don't usually think of, looking at the third out there to seek to develop your edge, the more unknown it is, usually the more
[38:13] profitable it would be. So, those would be my two takeaways. This is complicated strategy in to the extent that it uh takes a lot knowledge, uh uh to to do it. What would be good resources to learn more about this way
[38:28] of trading? Uh a lot of it is actually uh self-taught and taught from my experience at uh a few financial firms, wants to learn about this, it'd be uh most beneficial to probably start off
[38:45] with something researching it via AI. AI knows a lot about this sort of thing. It won't be as good as, you know, going out seeking a mentor. Uh that's always going to be my number one recommendation. Find someone, whether it's in person, online,
[38:59] records. There's obviously a lot of uh you know, sketchy people in the you know is credible. Uh but picking a mentor is going to be my my number one
[39:13] strategy or something else. And my my second recommendation, which is as a backup, AI is always good to to teach you the fundamentals. Would you have a couple of good books on options trading to recommend to our viewers?
[39:29] Yeah, so uh two good books that I think every serious options trader should use uh should read at some point and really get a good understanding of. One is called Options Volatility and Pricing by, I believe, Sheldon Natenberg
[39:43] Natenberg. Uh you guys can look that one up, and the second one is called Options as a Strategic Investments. They're two very big, very long, very boring books, uh but really reading them diligently, understanding them, is going to take you
[39:58] a very long way in in your options trading. And the last book you mentioned has been mentioned by many guests in the on the on this uh on this uh show. So that is obviously a book that is uh worth reading. I would also recommend
[40:13] people to watch an interview we did with Don McGraw about the gamma levels, which is a very relevant topic for if you want to dig more into this into this way of
[40:25] trading. We do also have a special discount of 20% on Mentor Q, which is one of the softwares that are showing Greeks level or gamma levels that Jamal was talking about. So, the link will pop up on on the screen.
[40:41] Jamal, thank you very much for this very interesting walk-through of your 0 DTE pleasure, and I thank you for having me on.



⚡ Saved you 0h 40m reading this? Transcribe any YouTube video for free — no signup needed.