

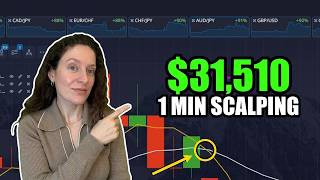
From $1 to $33,555 in One Session
45sThe extreme claim of turning $1 into over $33,000 is highly controversial and attention-grabbing, sparking curiosity and debate.
▶ Play Clip"The title accurately reflects the challenge of turning $1 into $33,555, though the strategy's reliability is questionable."
The video demonstrates a binary options trading strategy starting with $1 and growing it to over $33,000. The trader explains the use of three moving averages (periods 5, 45, 13) and RSI (period 5) on 1-minute charts, focusing on entry signals from indicator crossovers and trend analysis.
The trader starts with $1 and aims to maximize the balance while explaining trading techniques, indicator periods, and style.
Withdraws $5,035 from previous profits via Bitcoin, leaving $1 for trading. Sets up real account with indicators: three moving averages (periods 5, 45, 13) and RSI (period 5) on 1-minute candles.
Entry when moving averages cross below a red candle, RSI white line in selling position, and candle direction is downward. Trade wins.
RSI strong sell signal, moving average red line crosses red candle. Also notes moving average lines intersecting each other as confirmation.
RSI white line in strong selling position, moving average red and green lines intersect, white line crossed green line earlier. All indicators align downward.
Strong downward trend with moving average intersections and RSI below red line. Green candles in downtrend often replaced by red candles.
RSI white line in buying position above green line, moving averages upward, strong green candle indicates strengthening purchases.
Long-term descending trend with level breaks. Moving averages show downward trend, RSI near selling position. Entry downward wins.
Moving average white, green, red lines intersect each other and red candle simultaneously. RSI in selling position. Strong downward signal.
After many green candles, a red candle appears. High probability of next green candle if accompanied by moving average and RSI signals.
Fits well with the method. New moving average intersections increase profitability. RSI white line in buying position for long time.
Red candles break level, moving average lines intersect each other and red candles. RSI in sell position. High probability of continued downward movement.
All indicators signal higher candles. Entry on 1-minute intervals. Notes that losses can be high but profit must exceed loss.
After strong downward trend, reversal to uptrend. Advises new traders to avoid such risky moments and stick to better entry points.
Maximum balance exceeds $33,000 from $1. Emphasizes attention to candles, trends, levels beyond indicators. Not investment advice.
The trader successfully grew $1 to over $33,000 using a binary options strategy based on three moving averages and RSI on 1-minute charts, emphasizing indicator crossovers and trend analysis. The video serves as an educational demonstration, not financial advice.
What are the periods for the three moving averages used in this strategy?
5, 45, and 13.
01:20
What is the RSI period used in this strategy?
5.
01:20
What time frame candles are used for trading?
1-minute candles.
01:20
What is the first signal to enter a downward trade?
All three moving average lines cross below a red candle and the RSI white line is in the selling position (below its red line).
01:54
What does it indicate when moving average lines intersect each other?
It gives a strong signal of a trend direction.
03:23
What should you do when you see a green candle in a strong downward trend?
Do not be afraid; it is often replaced by a red candle, so it can be a continuation signal.
06:13
What is the best moment according to the trader?
When moving average white, green, and red lines intersect each other and the red candle simultaneously, with RSI in selling position.
08:22
What is the final balance achieved from $1?
Over $33,000.
18:38
Indicator Setup
Specifies exact periods for moving averages and RSI, forming the core of the strategy.
01:20Triple Intersection Signal
Describes the strongest entry signal when all three moving averages intersect each other and the candle.
08:22Risk Warning for New Traders
Advises new traders to avoid trend reversal moments due to high risk.
16:47Final Balance Achievement
Demonstrates the potential growth from $1 to over $33,000 using the strategy.
18:38[00:00] Hello friends and welcome back to my channel. today i will probably have one of the very informative videos because i want to start with only one dollar and go for the maximum balance
[00:12] i can. i will also try to tell you a lot about trading and show you which periods i use on the indicators and what style of trading i like. so watch the video to the end.
[00:28] i think it's a great time to start setting indicators. but first of all i want to withdraw some money i made in the previous video. i will withdraw money uh by bitcoin as
[00:44] it is the most effective and quickest way to withdraw money. this amount is 5035 dollars. i will definitely leave one dollar for trading. then i will give the confirmation and that's
[01:02] all. then i want to go to the real account and show you the indicators and periods i have to set. so these indicators are three moving average and rsi. the first moving average period was
[01:20] five, for the second one this for 45 and for the third one is 13. rsi period is 5. i set the candles at one minute and trade one minute intervals and i also put
[01:39] high percentage currency pairs. i'll try find uh to find the best entry point and explain why i'm entering the trade.
[01:54] i think uh it's the first wonderful moment. so the level or position of the mountain is made from top to bottom and at the same time all three moving
[02:08] average lines cross uh the red candle and the direction of the candle also goes down. also, if you look at the screen you see the rsi white line is in the selling position
[02:20] and this position is best if you want to enter the trade in a downward direction. so, guys this method has various good entry points and in this video i want to show you all the good moments. also,
[02:34] on the following trades i will show you what you need to pay attention to to reduce the loss of money. now let's watch what happens. and i think i'm going to win. great!
[02:52] so, friends when you see such a strong download trend there is a great chance of course one or two green candles can be made or raised above and then continuing the trend again.
[03:10] here is a strong rsi signal that sells are continuing. also, the moving average red line crosses the red candle and this is also a good signal to enter the trade. this is also
[03:23] a good signal when different lines of the moving average intersect each other. for example, now the green line intersect the red line and at the same time both lines have a starting correction
[03:36] in the downward direction. and i think i'm going to win this trade too. so the second great win!
[03:50] so, friends i'm so proud of myself. i think it's another very interesting and effective moment in this um moment of what you see on the platform. i will try to explain why. so, look at uh the white
[04:09] line of the rsi is in a strong selling position or with the large percentage it's coming down the red line. you should pay attention to such moments because if at the same time all the indicators
[04:22] give a signal in the downward direction it will happen. so, take another look at moving average red and green lines intersect again and the white line also crossed the green line a while back.
[04:38] and the third great win. so, as you can see uh this particular moment is similar to the previous moments
[04:53] but the difference here is that there were obviously strong sales. two large red candles points to these and then a green candle is fixed which has no power
[05:06] apparently and a large stick is made above. so, here we can already switch the psychology of candles. it's very helpful at the moment but remember friends i observe all this after moving
[05:21] average and rsi signals. we can combine these signals and candle psychology together. i think it was an effective win.
[05:39] so, again and again a strong downward trend. here i expect an even stronger descent. because look closely we have intersections of moving average lines and also, the rsi white line is in the position
[05:57] below its red line. this is the first signal that you can enter the trade. but these signals are amplified by trends. that is how strong the trend is. in this case, there is a very strong descent and
[06:13] i have to use it. in such a strong descent when a green candle is made it's almost often replaced by a red candle. don't be afraid when you see a green candle in a downward trend. great win!
[06:34] and now we have a strong upward trend and as i talked about in the previous trades here you have to look at uh the white line of the rsi in the first place and
[06:47] it follows the green line above i.e it is in the buying position for a long time. we also have moving average lines uh going upward which don't have a strong signal at the moment but
[07:01] have a direction from bottom to up. which is also important. and one of the highlights is the strong big green candle. this is an indication that the purchases are getting stronger
[07:14] from time to time. and i think everything is going in a perfect way. another win. great! so, here friends we have a relatively stable market and levels uh that are moving in a
[07:34] stable direction. look at the long-term trends it is quite descending and then the levels are done. and right now we have uh that moment when the next level is done and there
[07:48] is a great chance that the candle will go down and continue to create another level. moving average indicators also have a download trend and the rsi white lane is in
[08:01] very close to the selling position. that's why i entered the trade in a downward direction. and i think at this moment everything is going in a perfect way. great win!
[08:22] so, i can't count my trades today. so, this moment is one of the best moments in this method. because at this point moving average white, green and red lines intersect each other and the red candle at
[08:38] the same time. and this means that moving average gives us a strong signal of a downward trend. next, i look at the rsi which is in the selling position. and you should also observe the places where the
[08:54] lines intersect each other. they give signals in specific direction and exactly these directions are conceivable if you want to catch a good moment. and i think..
[09:10] great! it's good i won but i think the candles will go uh further down. and that's why i'm entering in this currency pair again. because a better moment was created. in such a downward
[09:24] trend a green candle appeared and of course as i have already told you there is a great chance that it will be replaced by a red candle. and as i told you we don't have to be afraid when we see a green
[09:43] candle in the downward uh trend. this is not an assumption. this analysis is based on indicator signals. but this analysis is not 100 percent and i can be wrong of course. this
[10:00] is shown by time and profitability. and as you can see the candle went down. grey win! great!
[10:13] here we have the same situation as in the previous few moments but there was a downward trend and here the opposite is an upward trend. i told you that when there are many
[10:27] green candles and you see that a red candle has come out at this time there is a high probability that there will be the next green candle again. but do not be mistaken by just
[10:46] this one detail. we do not pay attention to only one detail. so this detail will be negligible if it's not accompanied by moving average and rsi signals in combination. great twin!
[11:03] friends, i really feel shocked and i've almost lost my voice. again a strong upward trend. if you observe such um
[11:17] trend i often enter the trade because it fits very well with this method by which i trade. there is a high probability that i will successfully complete this trade i would also like to tell you that if the moving average lines have a new
[11:32] intersection with each other and you enter the trade at such a moment it is very good and further increases the profitability of the trade. as for the rsi white line is a
[11:44] better signal if it has been in the buying position for a long time. i won here too.
[11:56] of course i want to tell you um friends that my videos are not investment advice. and they are purely and only cognitive in nature. how you manage your money is
[12:11] only up to you and no one else. uh also don't trust when people write on my behalf.. know that they are scammers. because i'm not writing to anyone about investing. this is against my policy. and i hope
[12:27] you no longer make any mistakes and don't deposit your money in scams. now, let's watch what happens.
[12:43] i won but not so convincingly and i want to trade here again. i have shown this method in detail in a few videos but not all the details have
[12:58] been discussed there. because physically you cannot explain such a method in every detail uh in a few minutes. that's why i decided to record some videos about this method.
[13:11] also, friends watch carefully how i entered the trade and which moments i enter the trade and what details i pay attention to. because every detail is important
[13:25] and i always try to elaborate on the methods i show you. because you learn more about trading and become more sophisticated when trading in the foreign exchange markets. and i won hear again.
[13:46] so, friends i really feel unreal today. this is the moment when strong sales started after the purchases made. the red candles broke the level. at the same time, uh as you can see the lines of
[14:02] the moving average intersecting each other and also intersecting the red candles and it's quite strong signal. the rsi white line is of course in the sell position or below the red line.
[14:16] if you look closely at the platform when such a moment is created there is a very high probability that the red candles will continue to move down. let's wait a little bit and observe what happens.
[14:37] great, i won the first trade and looking forward to the next one. excellent!
[14:49] i think i should enter the trade here again because the red candles have not come down enough. i think so because the indicator signals are much stronger and as i explained in
[15:05] other moments after so many red candles the green candle also came out. we also have strong signals. this means that as i told you in the previous moments the probability of winning is quite high.
[15:21] as you can see we are moving quite slowly and with understanding. then the candles are going down. so, i think i will win this trade.
[15:39] so it was a great win. so, now i'm waiting for the second one. cool.. great..
[15:52] i caught a very cool moment and this is a really strong upward trend. i also have a signal from all the indicators that the candles will go even higher. and i entered the trade
[16:08] for a one minute intervals. i say again that the losses in this market can be quite high. i also have losses but i also have gains. and the main thing is that the profit must be
[16:23] more than loss. and this is what no one wants when trading in the foreign markets
[16:35] i'm going to win! great win! perfect!
[16:47] i already exceeded sixteen thousand dollars. this moment should probably be called an uh appropriate name and as they say every download trend is followed by an upward trend. that's
[17:02] exactly the moment now. as the trend reversed from a strong downward and began a strong uptrend. this moment is relatively risky for new traders and still and such moments should be
[17:17] avoided by new traders. because i have shown you much better moments in this method and using it is better, i think. but everything is going in a perfect way.
[17:34] and very cool, i won again. this is the result of a successful analysis.
[17:49] friends, you may think that this or that indicator intersect and that is all. but if you look at my videos you will realize that i pay attention to many details like
[18:03] candles as well as trends, levels and many other things that have nothing to do with indicators. but don't think that the indicators are secondary. on the contrary, i pay attention
[18:20] special attention to the signals of the indicators and i also do market analysis as i have already told you. i hope to complete the trade here as well. oh my god
[18:38] perfect trade! i really feel blessed today. i have no words. i gained a maximum balance of more than um 33 000 with only one dollar. it was not an easy trade. i want to tell you
[18:55] that i recorded a lot of videos in which i lost money and started all over again with one dollar. thanks for watching friends. i want to say goodbye. thanks for everything!



⚡ Saved you 0h 19m reading this? Transcribe any YouTube video for free — no signup needed.