Fixed Hand Management: Consistency Over Gambling
39sExplains a risk management technique that promises consistent profits, appealing to beginners tired of losing money.
▶ Play Clip"Title promises a definitive strategy for consistent profits, which the video delivers, but results depend on market cycles."
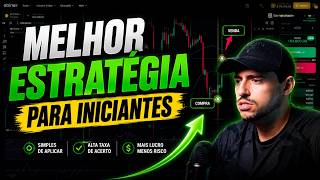
This video presents a binary options trading strategy designed for beginners, focusing on consistent profits using fixed-hand management. The strategy combines an RSI trigger with a 100-period exponential moving average filter to identify trend-following entry points.
The strategy is simple and suitable for beginners, using fixed-hand management (same entry value) rather than martingale or recovery methods.
With over 55% accuracy and a broker payout of at least 90% (up to 96%), consistent profits are achievable. The recommended broker link is in the description.
AFG stands for Analysis, Filter, and Trigger. In this strategy, the RSI acts as the trigger, and the exponential moving average serves as the filter.
Set RSI upper limit to 60 and lower limit to 40 (instead of default 70/30) to work with the filter.
Add a 100-period exponential moving average. If price is above, trend is up; if below, trend is down.
In an uptrend, only buy when RSI touches oversold (below 40). In a downtrend, only sell when RSI touches overbought (above 60).
Shows multiple winning trades (3-0, then 5 wins, 2 losses) using the strategy on a chart.
Expected accuracy above 55% (57-59%). Negative cycles can occur, but long-term results are positive. Example: April negative, May positive, overall profit $168k.
The strategy is simple, trend-following, and suitable for beginners. Consistency and patience are key, as negative cycles are normal but overall profitability is achievable.
What does AFG stand for in trading?
Analysis, Filter, and Trigger.
01:19
What are the RSI upper and lower limits set to in this strategy?
Upper limit 60, lower limit 40.
02:17
What period exponential moving average is used as the filter?
100-period exponential moving average.
04:02
In an uptrend, when do you enter a buy trade?
When RSI touches the oversold region (below 40).
05:56
In a downtrend, when do you enter a sell trade?
When RSI touches the overbought region (above 60).
06:11
What is the minimum accuracy required for this strategy to be profitable?
Above 55%.
00:40
What is the minimum payout percentage of the recommended broker?
At least 90%.
00:40
What should you do after a loss according to the strategy?
Wait for the next clear signal before trading again.
08:07
Fixed-Hand Management
Simplifies risk management for beginners by using consistent trade sizes.
00:40AFG Framework
Provides a structured approach to trading systems.
01:19Trend-Following Rule
Only trade in the direction of the trend, reducing false signals.
05:14Market Cycles
Emphasizes that negative cycles are normal and long-term consistency matters.
09:05[00:02] So they will help you, even if you are a beginner trader, to start making your first consistent profits in the binary options market. And I'm here to teach you exactly how to use this
[00:14] strategy effectively. And as I said and I repeat, even if you are a beginner, because it's not a difficult strategy, the management you will use is also not difficult management, it's not leverage management, it's not
[00:28] recovery management, it's not martingale, it's not Soros, it's a fixed-hand management. What do you mean by fixed hand? By consistently entering with the same values and targeting any
[00:40] scenario in any asset with an accuracy rate above 55%, you will already be able to obtain positive results, operating with the same brokerage I use, which has a fixed payout of at least 90%. There are assets with a payout of 96
[00:55] . The link to use it is in the description. If you use another broker that has a lower payout, you are at a disadvantage. I recommend that am using. By making your first deposit today, you'll
[01:07] receive a $5 gift from the broker. Beauty? So let's go, I'll show you delete them here and explain the function of each one. It's important to remember
[01:19] that in any strategy, you'll be observing one thing, which is the AFG (Area of Gravity). [snoring] What is AFG? analysis, filter and trigger. Every operational system has this. When using a strategy with indicators that have a pre-
[01:34] set setup, the analysis part is often unnecessary trigger, so the analysis won't be included. Ah, if you already have experience in the market, know that the entire strategy can be like a
[01:49] confluence for you to make an entry at support, existence, tops and bottoms, volume profile, Fibonacci, and then you do your analysis along with that as well. But that's beside the point here; I'm going to teach it in a simple way, using only the indicators. So let's
[02:03] configure them. Let's click up here, indicators, type RSI. And the relative strength index will appear here, which is the indicator that will serve as a trigger for us. I came here, clicked on it, and
[02:17] the default setting won't be used . So here's what you do. First, I like to increase the size a little here, double- click and set the upper limit to 60 and the lower limit to
[02:31] 60 and the lower limit to 40. Done. Give it an OK. And observe what the indicator looks like. I'll double-click here, then I'll go back to the graph. Look at what this indicator looks like. He has the following: he has a scale,
[02:43] this little blue line, like an index, that moves according to the relative strength of the market, and it will vary within that range, generally
[02:55] it will vary within that range, generally between 30% and 70%. Here on the right you can see the scale, okay? We set it to 4060, so we delimited it here without using the default setting, but the default setting is
[03:07] between 30 and 70. The chart, the price, the index tend to stay within those two ranges, but we're changing the default setting and putting 40 in the oversold range, which is this lower region here, the oversold region, right?
[03:21] overbought region, which is when the price is above this upper limit. Theoretically, what does this indicate to us? It's getting close to oversold territory, it's already getting exhausted, it 's losing strength and will soon want to go
[03:34] up. It's getting close to the top, it's losing strength, it should fall soon. But remembering that in the default 7030 configuration here, which we set to 6040, we can only use it intelligently because we'll also have a
[03:49] filter, which is another indicator that I 'll show you now, and I'll tell you what its configuration is, okay? So, double-click on the screen, and the graph will reappear, right? Come up here , indicators, write
[04:02] exponential. Here, the exponential moving average already appears. Clicked, double- clicked on the indicator, values here in period 100. Done, , as simple as it may
[04:17] seem, we have our trigger that will be observed here through the that will be observed here through the RSI, and we have the exponential moving average, which will indicate the trend, okay? So, the first
[04:30] thing you need to do, what's the order? Analysis, which in this case we trigger. What is the filter indicator? It's the trend indicator, which in this case is the exponential moving average, period 100. So, if the price is
[04:45] above it, here, it's above it, right? It's not. When it breaks, when I'll zoom in here so you can see. Can you see that he overtook him? Ah, but she's going up, it doesn't matter. It's above average, upward trend. The price is
[04:59] below average, the trend is downward, period . Right? So he's not here . Here he's above average. So, throughout this entire period, what was the trend ? Upward trend. If it's an upward trend, we'll operate this strategy
[05:14] following the trend. Therefore, in an upward trend scenario, we will only execute buy operations. And in a downtrend scenario, where the price is below the average, which is here, this candle caused the price to
[05:26] fall below the average. See this? Downward trend, look for a See this? Downward trend, look for a reason to execute a sell operation. Beauty? Awesome! So, what's going to be the trigger indicator? What's
[05:41] left is the RSI, which is down here. And what will be our trigger? It will happen when the price touches the oversold region of the RSI in an uptrend scenario. So, let's go. Upward trend scenario. When the
[05:56] price is in an upward trend, you wait for it to touch the oversold level of the RSI, which is this region below, so you can make a purchase, right? And when you 're in a downtrend, like here, you need to watch and see if the
[06:11] RSI, the index, which is the little purple line, is going to touch the top, OK? For you to make a sale. A downtrend requires the price to touch the top; an uptrend requires the price to touch the bottom. It's the opposite. So, I'm going to show you the
[06:27] landscape of opportunities here. So, let's go . We are in an upward trend, and you . We are in an upward trend, and you can see that the price came in, and on this red candle here, while it was falling, it touched the
[06:42] oversold region of the RSI. So here, a buy operation should be made, and you, placing your buy order on this candle, using the brokerage I next candle until the end of the next candle. At IBNEX you operate for the
[06:58] win, end of story. That's how it works. So in that case, if you trade do? You have to enter at the very end of the candle. The candle is closing, you're going in for the next candle to finish, okay? So here you would have
[07:13] entered a buy operation, and the next candle was a green candle, and it was a win. And you can see that the price picked up there and went back above the oversold region of the RSI here. But then he touched it again, look, it fell again, boom, it
[07:25] fell on that little red candle again and hit it there. Then I would have made the purchase. And the next one was a green candle, victory again. And then the price came back and fell on that red candle. You would have bought it. And that was a victory too. 3-0
[07:39] here. Ah, Berman, the price started to go up, it hit the top here. Am I going to do upward trend. You're not going in blind, so you don't do anything. Right? And then the going, going. And there were other opportunities here on this candle, it caught and
[07:53] touched this lower range, it would have made a buy operation and the next candle was a winning green candle. Here, that red candle touched there, and unfortunately, the next candle was also red, so it was a loss. So in this scenario, it would have been a
[08:07] defeat. And so you can see that the RSI index remained right above the region. In that situation, if you 've suffered a defeat, wait for the opponent to completely withdraw before looking for a new opportunity. Beauty? After that,
[08:20] the market started to fall. This red candle here, it triggered something because it touched the oversold zone and we were in an uptrend. It also resulted in a defeat, and after that the market fell, entering a downward trend.
[08:34] downtrend, we had a candle here that hit the top. This green candle touched up here. Downward trend , touched the oversold region of the RSI, what was I going to do? Selling operation. And then you would have won in
[08:52] this scenario, okay? So, just looking at it here, 1 2 3 4 5 wins, only two losses. And then you can do the backtest from your home. You can configure the indicators and see the number of
[09:05] you're using a fixed hand, it's not an absurdly accurate strategy, it's not a strategy with 65 or 70% accuracy, it's a strategy where you'll probably have above 55% accuracy . And then from that point on, at 57,
[09:19] 58, 59, you can already get will probably have that assertiveness? Why? We have So sometimes you use a strategy for a month, and then you're in a month where
[09:33] that strategy isn't very effective, and you'll have a mediocre result, slightly losing money. You're unlikely to lose much; you'll only be slightly at a loss if it's a negative cycle. But then the following month, the
[09:46] cycle was incredibly positive. If you only traded during the month with a negative cycle, you month, so you're going to say the strategy doesn't work. But if you had traded the following month, you would have recovered the loss and finished with a profit, okay? And
[09:59] example, my trading history, the month of April, since the beginning of last year that I went into the red, losing $0.000 management strategy. That's not the one I taught here. It's an operational strategy that I use
[10:14] YouTube channel at 8 PM. You can follow along. I even recommend that you description so you don't miss out, because I always announce there when I'm going live. And I also do live streams every day, at noon and at 3:30 in the afternoon. So what happened was this:
[10:29] you're using a strategy and it turns negative. Ah, the strategy doesn't work. Calm down, the market is in a negative cycle . Look what happened in . Look what happened in May. I'll put it up until now. The
[10:41] Brazilian result started to rise and I ended up positive when adding April and May together. See? Because it was a negative cycle there. To give you an idea, since the beginning of last year, look, I've been having very positive results. $168,000
[10:55] in profit, practically all of it from live trading. But I had moments, there were moments with negative results, then it came back. So there's a negative cycle. This whole year , you see, it was kind of going at a draw,
[11:07] , you see? So it's important for you to understand this when you 're trading, regardless of the you can see up to this point, in my last live stream I hadn't had a single stop-loss
[11:21] day in May while trading live, but unfortunately we did have one. But life goes on, we're in the black and this is just the beginning. If you want to follow the live streams have the chance to profit along with me, should you want to trade on the
[11:35] watch the live streams every day at 8 PM. Is it closed? I hope you enjoyed like, subscribe to the channel, check out the description, and I'll see you in the next video.

⚡ Saved you 0h 11m reading this? Transcribe any YouTube video for free — no signup needed.