
Turning $29,973 into $30K in 45 Seconds!
45sThe tension of a live trading challenge with a specific monetary goal creates suspense and relatability for viewers interested in quick wins.
▶ Play Clip"The title promises a $30k bankroll and the video delivers exactly that, though the content is extremely thin—just one trade with no explanation or strategy breakdown."
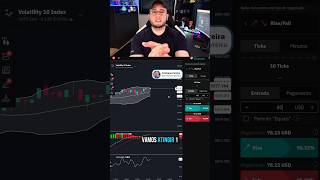
In this short trading clip, a Deriv trader aims to grow their bankroll from $29,973 to $30,000 using a single binary option trade. The video captures the entry, execution, and successful outcome of a quick put option based on Bollinger Band signals.
The trader's bankroll is $29,973, and they are trading at volatility level 10. The goal is to push the bankroll to $30,000.
The asset is hitting the upper Bollinger Band, prompting the trader to place a $10 bet on depreciation (a put option), expecting the price to fall below the initial investment amount.
The entry point is right above the upper Bollinger Band, with only 20 seconds left on the trade. The trader confirms the green flag, indicating the trade is active.
The bankroll reaches $30,000.11, surpassing the target. The trader declares 'Bank hit' and plans to continue operations.
The video demonstrates a simple, successful binary options trade on Deriv, using Bollinger Bands to time a short-term put option. It highlights the potential for quick gains but also the risk inherent in such high-frequency trading.
What was the trader's starting bankroll?
$29,973
00:03
What signal triggered the put option entry?
The asset hitting the upper Bollinger Band
00:16
How much was the bet placed?
$10
00:16
What was the final bankroll after the trade?
$30,000.11
00:48
Bollinger Band Put Strategy
Shows a concrete technical analysis signal used for a short-term binary option trade.
00:16Bankroll Milestone Achieved
Demonstrates a successful outcome, but also highlights the risk of relying on a single trade.
00:48[00:03] fast derivative. At this moment, my bankroll has 29,973. I'm here at volatility level 10. I'm going in with enough to get this
[00:16] with enough to get this bankroll up to 30,000. Here's the entry point, with the asset hitting the upper band. I'm going to place a 10-dollar bet on the depreciation, aiming for the asset to fall below my initial investment amount. Let me just take a look so
[00:32] we can track the asset's movement here. My initial entry point is right above the upper Bollinger Band . I came in with 20 seconds left. Let's . I came in with 20 seconds left. Let's see. Green flag, okay?
[00:48] 30,000.11, okay? 30,000, with 34. Bank hit. We will continue Bank hit. We will continue operations there.




⚡ Saved you 0h 01m reading this? Transcribe any YouTube video for free — no signup needed.