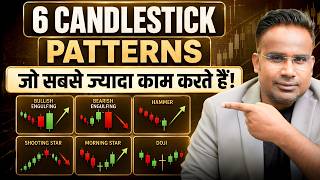

90% of Candlestick Patterns Are Useless
41sThis bold claim challenges common trading advice and promises to reveal the few patterns that actually work, sparking curiosity.
▶ Play Clip"Delivers on the six patterns with clear explanations and a strategy, but includes a long intro and a sponsor plug at the end."
The video teaches six candlestick patterns that the creator claims are the most effective for trading, based on years of testing. It explains the basics of candlestick anatomy and provides a strategy for combining these patterns with key support and resistance levels to improve trade accuracy.
The creator states that many candlestick patterns are ineffective, and after years of testing, he found 90% of them to be 'complete rubbish.' Only six patterns are worth using.
A story about a beginner trader, Karan, who buys on a big green candle without understanding it, leading to a 6% loss. The mistake is not seeing the candle but failing to interpret what it indicates.
Each candle represents the price action of a time period. The body shows open and close, while the wicks (shadows) show the high and low. Green means close above open (buyers won), red means close below open (sellers won).
A large body indicates a decisive win by buyers or sellers. A small body means a balanced fight. A long lower wick shows strong buying pressure; a long upper wick shows selling pressure.
A two-candle pattern where a large candle of one color completely covers the body of a smaller opposite-colored candle. Bullish engulfing (red then green) signals a potential uptrend reversal; bearish engulfing (green then red) signals a downtrend.
A single candle with a long wick on one side and a small body. A bullish pin bar has a long lower wick, indicating rejection of lower prices. A bearish pin bar has a long upper wick, indicating rejection of higher prices. Wait for a confirmation candle before entering.
A sequence of three candles: large, small (opposite color), large. The middle candle is a 'breathing' candle, indicating the trend is pausing but not reversing. The third candle closing beyond the second confirms continuation.
A three-candle sequence: large, small (same color), large (opposite color). The third candle's body should be equal to or larger than the first for a strong reversal signal. A small third candle indicates a weak signal.
After a series of small consolidation candles, a large candle breaks out of the range. The bigger the breakout candle, the more reliable the signal. Entry is at the close of the breakout candle, with stop loss at its opening price.
Three consecutive candles of the same color, each smaller than the previous, indicate the trend is losing momentum. A large opposite-colored candle confirms a reversal. The fourth candle should close beyond the second candle's close for strength.
Using patterns alone leads to false signals. Combine them with key support/resistance levels, trend lines, or Fibonacci levels. The pattern tells you what is happening; the level tells you where and why.
Step 1: Use higher timeframes (1 hour+) to identify the story, avoiding noise. Step 2: Find a key level where price has bounced before. Step 3: Wait for price to return to that level and look for a pattern confirmation (e.g., a three-bar reversal) before entering.
The creator emphasizes paper trading before using real money. Past performance is not a guarantee of future results. He also mentions a CoinDCX link with a 20% brokerage discount for practice.
The video provides six candlestick patterns that the creator claims are effective, but emphasizes that they must be combined with key support/resistance levels and practiced on higher timeframes to avoid false signals. The final takeaway is to always read the candle's story, not just its color, and to paper trade before risking real capital.
What does a long lower wick on a candlestick indicate?
Strong buying pressure; buyers pulled the price back up after it fell.
08:09
What is the difference between a line chart and a candlestick chart?
A line chart shows only the closing price, while a candlestick chart shows open, high, low, and close.
03:50
What does a bullish engulfing pattern consist of?
A small red candle followed by a large green candle that completely covers the red candle's body.
09:37
What is the recommended entry and stop loss for a bullish pin bar?
Wait for a confirmation green candle, enter at its close, and place stop loss below the pin bar's wick.
11:43
What does a three-bar continuation pattern indicate?
The trend is pausing but will continue; the middle small candle is a 'breathing' candle.
12:10
What is the key condition for a strong three-bar reversal signal?
The third candle's body should be equal to or larger than the first candle's body.
14:33
What is a breakout candle?
A large candle that breaks out of a consolidation range after a series of small candles.
15:29
What does a shrinking candle pattern indicate?
The trend is losing momentum; a large opposite-colored candle confirms a reversal.
16:57
Why should you combine patterns with key levels?
Patterns alone give false signals; key levels provide context on where and why the pattern is forming.
18:32
What is the recommended timeframe for identifying the story?
1 hour or above, to avoid noise on lower timeframes.
19:15
Karan's Mistake
Illustrates a common beginner error: trading on a candle's color without understanding its story.
00:57Candles as Wrestling Matches
Provides a memorable analogy for interpreting body size and wick length as buyer-seller battles.
06:31Patterns Alone Are Not Enough
Warns against false signals and emphasizes the need to combine patterns with key levels.
18:32Paper Trade First
Encourages practice without real money, highlighting the importance of experience over theory.
22:00[00:02] Look, there are many candlestick patterns but to tell you the truth, not all candlestick patterns work. Now whether you trade in crypto, trade in stock market, trade anywhere, not all candlesticks work there. But there are six
[00:15] such candlestick patterns which we are going to tell you today about and how they tell you today about and how they work. So today brother let's talk about him in detail. But before we start, one important thing is that this video is for educational
[00:28] purposes only. Do not consider this as investment or trading advice. I am not a SEBI registered investment advisor or a Richards Research analyst. The patterns shown here are for illustration purposes only. This is
[00:40] not a recommendation to buy or sell any stock. There is a risk of capital loss in trading. Make any decision on your own, do your own research and at your own risk, or speak to a registered advisor. At or speak to a registered advisor. At
[00:57] New to crypto. He has downloaded the app. Looking at a Bitcoin chart on his phone. And suddenly a big candle appears in front of him. Only one thing comes to Karan's mind. Oh, it's going up. If I do n't enter now, I will miss it.
[01:11] So with full confidence Karan presses the buy button. But in the next 20 minutes the presses the buy button. But in the next 20 minutes the price falls by 6%. Maybe price falls by 6%. Maybe this story is not just Karan's but yours too. Look, it was
[01:26] n't Karan's fault that he saw a big candle. His mistake was that he did saw a big candle. His mistake was that he did not read the candle. I did not understand what she was saying. Karan just saw her attitude and decided to say goodbye. And you know,
[01:42] as I said earlier, a large part of the money that people lose in the market is money that people lose in the market is lost due to this one mistake. I was lost due to this one mistake. I was
[01:57] But the real question is that you will find thousands of videos of candlestick patterns on YouTube. Some will count 20 patterns, some will count 30. But how will you know will count 30. But how will you know which one is real and which one is just a time
[02:12] pass? I myself tested all these patterns for years and the truth is that I found 90% of them to be complete rubbish. Because they may
[02:25] look beautiful on the chart but they don't do much work. But if anyone uses the six patterns that I am going to tell you today
[02:37] practices them, then they can work for them. So today I am going to teach you these six patterns. One by one starting from zero and finally I am going to tell you a strategy by from zero and finally I am going to tell you a strategy by
[02:54] using them. So brother, if you also do not want to be the next reason then watch the video carefully because the most important part is going to come at the end. But before that let me ask you a basic question. What is a candle stick thing
[03:11] ? Look, every candle is a price story of a time period. You can also understand this as a mini diary entry,
[03:23] if you are looking at a one-hour chart, then each candle tells what happened to the price in that entire one hour. candle tells what happened to the price in that entire one hour.
[03:36] 15 minute charts tell the story of 15 minutes. Meaning, whose story is the entire story of the time frame you see ? Price's story tells. Now your question here may be [music] why doesn't Sagar Sir just look at the line chart
[03:50] ? It is simple. There is only one line in it. That's correct. It is simple but equally incomplete. A line chart tells you just one thing. CLOSING [MUSIC] Price. That means on what did that period stop? That is all.
[04:08] That means on what did that period stop? That is all. things at once. What was the open price? High means how high did the price reach in that period? Low means where did the price fall to the lowest level? And
[04:25] where did the price fall to the lowest level? And where did the price finally close? And do you know why it's important to know this? Why does this matter? I am also going to explain this to you with an example. Suppose the price reaches a support level and
[04:40] bounces from there. In such a situation, if you are just looking at the line chart, then all you will see is that the price came and took a U-turn from the bottom and went into an up trend. This same simple
[04:52] visual will be visible in the line chart. But this so-called simple event is very dramatic in the candlestick chart. this so-called simple event is very dramatic in the candlestick chart. went below that support level. A long wick will tell you that
[05:08] support was almost broken. But then the Bears caught him at the last moment. Got it closed back near the same level. And price closed back near the same level. And price action is the most valuable thing for traders
[05:22] because it is this price action that tells which direction the price can go next. So basically the line chart tells you the result. But the candlestick chart shows you the entire match, when did who attack, when did who lose and where. And there are two types of candles.
[05:39] who lose and where. And there are two types of candles. Look at the green and red. A green candlestick is formed when the close is above the open. That means the Bears won that round. Red is made when the close is below the open. That means the sellers won. Every candle has two
[05:56] sellers won. Every candle has two parts. Body and wick which we also call shadow. Vic is also known as Shadow. The end of the upper wick is the highest price of that period. And the lower wick is the lowest price.
[06:12] In a green candle, the lower part of the body is the opening price and the upper part is the closing price. And its exact opposite is in the red candle, meaning higher opening and lower closing price. Now listen carefully to what I am going to tell you
[06:31] you will not understand the next six patterns. Look, you have to look at every candle as a wrestling match between buyers and sellers. The Look, you have to look at every candle as a wrestling match between buyers and sellers. The won and how easily. [nasal noise] And Vic
[06:44] shows who was weak in the middle of the match. So first of all, big body versus small body. Please understand this. If the body of the green candle is big then understand that the bearers have
[06:56] body of the green candle is big then understand that the bearers have knocked the sellers' arms down in one stroke. The price opened lower but the buying pressure was so intense that sellers could not offer any resistance. Price went straight up without any interruption. And if a red candle with a large body is
[07:13] formed then understand that the sellers have defeated the buyers there. But if the candle has a small body then it means that the match is equal. The Bears won, but with
[07:27] great difficulty. Sellers also put in a lot of effort. The price is not able to move much. And the closing is somewhere around the opening. And now let's talk about And now let's talk about Vick. Look at the long wick,
[07:42] think of it like this, imagine a boxing match is going on and imagine that the boxer hits his opponent with a powerful punch but the opponent stops it midway and hits a powerful
[07:54] stops it midway and hits a powerful counter punch back at him, so in such a situation if the lower wick is long then it means that the price went down to a very low level once but the buyers were strong enough to pull it back, by the way [nasal sound] this is
[08:09] also called strong buying pressure. And if the week above is long then understand that the if the week above is long then understand that the exact opposite has happened. Sellers have stopped the price from going up and pushed it back down. Which we can say is
[08:24] selling [music] pressure brother. And if the candle has a small body and its wick is also almost equal then it means that no one has won completely. The match ended in a tie
[08:36] and both sides, the sellers and the buyers, continued to tug of war. So brother, these basics that I have just told you, body size, wick length, you have to understand them properly because without this, the six patterns that I am going to tell you next will never be
[08:52] understood by you properly. So this is the foundation. Don't miss this. If you want, you can watch the video once again brother. Understand it well and then brother. Understand it well and then proceed further. Correct? So now let us talk about the
[09:07] proceed further. Correct? So now let us talk about the six most important patterns one by one. The six most important patterns one by one. The first pattern is the engulfing pattern and I call it the swallowing pattern because that is what happens in it. It is
[09:20] made up of two candles. First a small candle and immediately after that a large candle of the opposite color which covers the immediately after that a large candle of the opposite color which covers the body of the first candle. Just like an elder brother embraces his younger brother and completely covers him. These are of two types.
[09:37] Bullish engulfing. The first candle will be red. The second big one will be green. In bearish engulfing, the first candle will be green. The second larger one will be red. When you see this pattern,
[09:50] larger one will be red. When you see this pattern, understand that a possible trend reversal is coming. Meaning, let's assume the price is in a downtrend. If the price is moving downwards and suddenly becomes bullish engulfing, then it means that the sellers were dominant till now but suddenly
[10:07] they are weakening and the bears have turned the tables. The bigger the second candle, the stronger the signal. Understand this. And now let me
[10:20] explain how you can enter into it. If the bullish engulfing is confirmed, buy can be made [music] on the close of the large green candle. Stop loss can be placed at the week below it.
[10:32] [Music] If the pattern is bearish engulfing, try reversing it. A sell can be made at the close and a stop loss can be placed at the upper wick of that red candle. The second pattern is the pin bar. Brother, this is just a game of a candle in
[10:49] which there is a very long wick on one side and a very small body. A bullish pin bar, i.e. a green candle, will have a long wick at the bottom. Bearish pin bar means it will be a red candle. There will be a long
[11:02] wick on top. You should understand it like this that the sellers should first come with full confidence. I pushed the price down and thought I would finish the job today. But in the meantime the Bears made a quiet
[11:14] But in the meantime the Bears made a quiet comeback. Sellers' entire attack was rejected and he pulled Price back up. This candle actually shows This candle actually shows that the price could not sustain even after going down.
[11:28] That means there is no interest left below, brother. But here is my suggestion that do But here is my suggestion that do not jump immediately after seeing the pin bar. Wait for another green candle. Let the trend settle down a bit. Then
[11:43] you can see a buy signal at the close of the confirmation candle. And the stop loss can be placed below the wick of the pin bar. But if you are seeing a bearish pin bar then understand the same process in
[11:55] reverse. That means another red candle can be waited for confirmation. Then a sell entry can be taken at its close and the stop loss can be placed above the wick of the pin bar. And now let's talk about the third pattern, three bar
[12:10] continuation. That is, a chain of three candles. Look, the first a chain of three candles. Look, the first candles are big and full in this. And the second candle is smaller and will be of a different color. That is, if the first
[12:24] candle is red, the second small one will be green, and if the first is green, the second will be red. be green, and if the first is green, the second will be red. And this second candle should ideally And this second candle should ideally
[12:39] trend hasn't stopped, it's just breathing. You will understand this. And then the third candle comes again big which closes above the close of the second candle. Think of it like a fast runner
[12:54] in the middle [nasal sound] he stops for a second to take a breath and then starts running even faster. So this event of breathing in between, you can understand that a small candle has been made, it is a breathing candle. And this is
[13:07] not to suggest that the trend is over. It just shows that it has stopped a little bit. Not finished [MUSIC] So in the bullish version it would be three. The first and third will be large greens. The small one in the middle will be red. In the bearish version, the opposite will happen. The first
[13:22] and third will be red and the middle will be green. So basically this is a signal that the trend will continue. If you missed the entry in Uptend continue. If you missed the entry in Uptend then this is your second chance. A
[13:35] buy call can be taken at the close of the third candle and the stop loss can be set below the low of the second candle. and the stop loss can be set below the low of the second candle. Now the fourth pattern is the three bar reversal. Yes, I am telling you something different, I feel.
[13:49] By now I know that you are using this. Now look, whatever you see on the screen, I am saying things but I am also showing you on the screen. but I am also showing you on the screen. Now listen to the reverser three times. This is
[14:02] also a sequence of three candles. But this time it is not about signal continuation but about a complete U-turn. The first candle will be large, almost full body. The second one will be smaller. The first one will be of the same color and the third one will
[14:18] be bigger and of the opposite color. Meaning two completely opposite. Now one important thing to [nasal sound] the bigger the body of the third candle, the bigger the body of the third candle, equal to or bigger than the first candle, the stronger the
[14:33] equal to or bigger than the first candle, the stronger the signal it can be considered. But if the third one turns out to be small then understand that it is a weak signal. And it is not right to rely too much on it. So let us signal. And it is not right to rely too much on it. So let us
[14:50] first two will be red. The third will be green. If the price was in a downtrend till now, then the formation of the third candle means that the price is about to reverse upwards. In this, entry can be
[15:02] taken at the close of the third candle and stop loss can be taken at the low of the second candle. The bearish version of this would be the opposite. That means, if the third candle turns green in the up trend, then there may be an if the third candle turns green in the up trend, then there may be an opportunity to go short.
[15:17] Stop loss can be placed at the high of the second candle. But remember, as I mentioned earlier, the size of the third candle will decide how strong the signal is. Now
[15:29] will decide how strong the signal is. Now understand the fifth pattern. Breakout candles. I call this the calm before the storm. Look, many small candles are continuously formed here. The price is stuck in a range. Nothing can be decided.
[15:44] These are called consolidation phases, also known as consolidation candles. Just like someone is stuck at a traffic signal for a long time. The horn is being blown. The long time. The horn is being blown. The train is not moving and then suddenly
[15:59] the signal opens and a big candle crosses the entire gap in one stroke. This is called a breakout candle.
[16:14] the bigger and more reliable the breakout signal can be considered. Whether the breakout signal can be considered. Whether the color of these small candles is green or red, it does not matter here. It just needs to be small in size. If the
[16:28] breakout candle is green then the trend is expected to continue upwards. So your entry can be at the close of the breakout candle i.e. the big candle formed after a series of small candles and the stop loss can be at the opening price of the same candle. If the
[16:44] at the opening price of the same candle. If the breakout candle is red then the opposite i.e. entry can be sold at the close of that big red candle and the stop loss can be placed at the opening price of the same candle. Now
[16:57] understand the sixth and last pattern. These are shrinking candles. Look, you can visualize this like a tired runner. Someone is running continuously but his speed is decreasing a little with every lap. At least three
[17:13] decreasing a little with every lap. At least three candles of the same color are formed here in a row and each one becomes smaller than the previous one. That means the trend is running out of breath. Understand it like this. Then a large reverse colored candle comes clear which clearly indicates that the
[17:28] runner has now fallen and the other team has entered the field. The bigger the fourth candle, the stronger the reversal will be considered. I would say here that the fourth candle should at I would say here that the fourth candle should at least close above the close of the second candle
[17:43] in a bullish reversal or below it, that is, in a bearish reversal, as per the trend. If in a downtrend, after three consecutive decreasing red candles, a big candle appears, then understand that this is a bullish reversal signal and entry can be made at the close of its green candle.
[18:00] Stop loss can be placed at the low of the previous candle. If three consecutive declining green candles in an uptrend are followed by a large red candle, it is a bearish reversal signal. The entry can be made to sell at the close of that red candle and the stop loss can be
[18:16] placed at the high of the previous candle. Now look, you have six patterns here. But here I want to tell you one important thing that if you start looking for these six patterns directly anywhere on the chart then you will get a lot of false
[18:32] signals. The pattern will be formed. It may look good to you but the price may be completely opposite to your expectations. This means you will expect the price to go up and it is possible that the price may start falling as soon as you enter. know why? Because entering just by looking at the pattern is like
[18:49] know why? Because entering just by looking at the pattern is like Sometimes it will turn out right. But most of the times you will be deceived in this. So the
[19:01] point is, don't just look at patterns. Compare that to someone's level. Key level means the place on the chart where the price has stopped many times before. It might have bounced from there.
[19:15] Overall I am talking about support and resistance. So what is there to do here? Understand step by step. Step One: Choose the right time frame. Work on time frames of one hour or above. Why? Because it is considered on lower time frame.
[19:31] Like 1 minute passed, 5 minutes passed. There is a lot of noise on these. That is [nasal sound] there are these little random movements that keep showing this pattern. But in reality nothing might be happening here. The
[19:46] pattern formed on higher time frames has more genuine buying or genuine selling pressure behind it. Meaning there is a solid logic on lager time frames. That's why I said that the time frame of LPG is 1 hour, 2 hours, 3 hours. Yes, you
[20:02] must take 5 minutes or 15 minutes for entry. But to understand the story, use a time frame of 1 hour or more. understand the story, use a time frame of 1 hour or more. Step Two: Find a key level on the chart. This could be support, resistance, a trend line,
[20:16] or a Fibonacci level. Suppose the price has already bounced twice from a particular level. [nasal sound] Now that level can be a strong support for you.
[20:28] This level will be recorded on the chart. Brother, please note that this looks like support. Now understand step three. Let the price come back to that level and look for confirmation there. you understand whether it is support or resistance. When the price
[20:45] comes near the same support for the third time, do not take an entry immediately. Wait and check if Wait and check if
[20:57] three-bar reversal is forming. Right on top of that support. So now you have not just the pattern but the confirmation of both the patterns plus the level together and this becomes your real confirmation and from here you can plan your entry. See,
[21:13] these short patterns tell you what is happening and the key levels tell you where it is happening and why it is happening because what matters is understanding where and why. Plan the trade [music] only when both of them come together. But remember one thing,
[21:30] told you about Karan. Remember [nasal sound] Karan's mistake was [nasal sound] Karan's mistake was not to look at the candle. I had to trade without understanding the candle. Now you have six patterns that really work,
[21:44] according to my experience. And there is also a strategy on how to use them with the key levels. So next time you open the chart, don't take a decision just by looking at the color. open the chart, don't take a decision just by looking at the color.
[22:00] understand one thing carefully brother. Whatever concept we learned today, concept we learned today, please practice it. Do paper trade. Trade on paper before investing real money. If you are trading on paper, then
[22:14] practice by trading it again and again. Because there is no guarantee that these six patterns we learned will always work. This is a record of things that happened in the past. If these things have happened in the past then there is a possibility of them happening in the future.
[22:27] This is not guaranteed. But yes, the more you practice, the But yes, the more you practice, the [nasal sound] Is it okay, brother? So we have given the link of CoinDC
[22:41] you can practice trading by opening an account. Plus the link we have taken, the link we have given is customized. You get 20% discount on brokerage, first of all, do your KYC using the same link and start your trading journey
[22:56] start your trading journey brother. Ok? Well, that's all for today.




⚡ Saved you 0h 23m reading this? Transcribe any YouTube video for free — no signup needed.