

I Made $112K in 2.5 Months Trading Crypto
45sThe promise of a massive profit with a repeatable strategy immediately grabs attention and sparks curiosity.
▶ Play Clip"Delivers on its promise of a complete, repeatable trading process with real trade examples, though it's a bit padded with a tool promotion."
The video presents a complete, rule-based crypto trading strategy that the creator claims generated $112,000 in 2.5 months. It details the process of finding entries, setting stop losses and take profits, and emphasizes the importance of balancing risk-reward with winning percentage. The creator uses live trade examples to illustrate the strategy in action.
The core principle is to balance risk-reward and winning percentage. Traders must decide whether to take small profits with a high win rate or aim for larger gains with a lower win rate.
The strategy involves identifying a 'change of character' (a shift in market structure), entering at a key point of interest, and setting a stop loss outside a risk boundary. The take profit is often at a previous day high or the midpoint of a fair value gap.
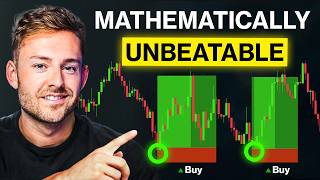
A live trade example shows a $10.8K profit. The trader entered after a change of character, used a fair value gap as a target, and moved the stop to break even once the trade was in profit.
Another trade example shows a $10.4K profit. The trader entered at a point of interest after a change of character, with the take profit at the midpoint of a bullish fair value gap.
The creator uses TradeZilla to journal trades and tag them with 'confluences' (additional filters). This allows them to analyze which combinations of rules yield the highest net profit over time.
The creator recommends using TradingView's bar replay feature to backtest and refine the strategy, ensuring only the most profitable rule combinations are executed.
Risk-Reward Balance
Establishes the foundational mindset for all trading decisions.
00:56Change of Character Entry
Provides a specific, actionable entry trigger based on market structure.
24:20Fair Value Gap Target
Shows a concrete method for setting take-profit levels.
24:37Journaling with Confluences
Explains a data-driven approach to optimizing a trading strategy.
25:21[00:00] Over the last two and a half months, I made $112,000 trading crypto. Now this was done using the same exact process every single day that is clear and repeatable. So in this video, I'm going to show you exactly how I trade every single day, how I find my entries,
[00:16] how I decide where and when to take profit, and I'll break down several live trade examples from the past couple months that explain my complete processes outline. Now keep in mind, This is not theory. I'm literally pulling data and showing you exactly what I've executed.
[00:31] And largely, a lot of these trades were done live in front of my private trading team. And all of my trades I screen record. And the best part, this strategy isn't overly complicated. So I'll show you exactly what I saw before entering, where I place my stop and take profit,
[00:44] and why. So by the end of this video, you'll understand the complete process, how and why it works, and how to apply it. So with that said, let's dive right in. Before we get into strategy, I need you to understand one simple thing.
[00:56] And that is, as traders, all we're trying to do is balance risk-reward and winning percentage. So, how much are we right versus how much are we risking or potentially making when we're putting the trades on? So, as traders, we need to decide whether we're going to take a little bit of profit off of each trade and have a super high win rate,
[01:14] or if we're going to let our trades run like crazy, that way we can afford to have a lower win rate and not need to be right about every single trade that we're taking. I don't know about you guys, but sometimes I'll enter a trade, set my take profit, hit my take profit, and then proceed to watch the market just move so far through my take profit that had I have held that, it would have made my entire week or two weeks or even a month worth of profit.
[01:36] And I'm going to show you how you can figure this out for yourself as well because most people don't really know where to take profit. But that's how I've been able to grow on average between $30,000 and $50,000 a month, being right about 37% of the time.
[01:48] It's about being systematic, allowing my winning trades to run, and keeping my risk contained. And that's the general approach that I'm taking and exactly what I'm going to show you. The goal is to not predict and be right about every single thing.
[02:00] It's about being selective and taking only high potential areas on the chart and managing risk. So this whole process that I follow can be broken down into a five-step simple procedure. This is the exact framework that I've followed over the past three months to be able to get my results.
[02:15] I don't deviate from this plan. This is how I'm doing it every single time. Step one is going to be heading over to our trading view chart, keeping a completely blank chart, and identifying the overall market direction. Okay, I'm going to be doing this on a 15-minute time frame.
[02:28] And sometimes it can be difficult when we're just looking at a big chart like this. So what I like to do is go into my indicators and add something called the Nevitrade Foundation Indicator. Now, this is an indicator that I made, and you'll see these gray dotted lines are going to pop up, and that's going to separate out all of our New York sessions.
[02:45] So this is going to give you a full 24-hour cycle between these lines, which now makes it a little bit easier to break our price action up and visualize why the market is moving in between days of price action. If you want this or any of the other resources that I mentioned in this video, you can go in the description and download my Elite Trader Starter Kit, which is going to give you all of my indicators as well as the playbook that I use every single day in PDF form.
[03:08] So that's in the description, or if you follow me on Instagram and DM me the word tools, I'll also send it over to you. So I always want to have this starting on my chart to get my bearing. That way I know I'm looking at one, two, three, four, five days worth of price movement.
[03:20] So what I want to do when I'm figuring out the general direction of the market is I want to use something called market structure to read where we are currently at and whether or not the buyers or the sellers are in control.
[03:32] Now, what we're really trying to do is identify overall trend directions. And a trend is established by having a, for example, in the case of a downtrend, having a lower low, lower high, lower low, lower high, and then what's called a break of structure to
[03:45] the downside. This is going to confirm that we have a bearish move. The sellers are in control. This is the structure that we want to look at. And you'll notice it's just generally when the market is moving down. We can identify when the market's generally moving down and when the market
[03:59] is generally moving up, but it's important to understand market structure to be able to tell very quickly when we could be changing into markets now potentially moving up or markets potentially now moving down when it previously was moving up. This is going to show us changes
[04:15] in trend direction, which is going to be super helpful for us reading price action because the faster we can figure that out, the faster we can get in early on the trend and be able to maximize that all the way up. If we can see here, we have price was trading up, finally breaks underneath
[04:29] this level. So this is our uptrend. This is now our downtrend. Now the question is, how can we tell when the market is going to likely change direction? And we're going to look for something called a change of character. Now a change of character is going to be a market structure shift
[04:42] which is basically confirmed by having candle closes that are invalidating that lower low lower high in this case. So if we have lower low lower high lower low lower low consolidation lower high
[04:54] we have a candle close below this area which is confirming a new break of structure and then you'll see the market shifts dramatically and now has a candle close where the candle is wholly established up over this high level. This is indicating to me right at this point that this is now potentially
[05:11] the first signal of this whole trend that ends up playing out. So even now with just this piece of information, we now have reason to believe that the next move up will be after this higher high will be a higher low somewhere down here. The next thing that I'm trying to do is always draw
[05:27] some sort of alignment along the lows of where the price action seems to be responding from, in this case, the buyers. So I'll take my trend level and I'll draw along this point and this point. So with this piece of information and this piece of information, now I have reason to believe
[05:41] that if and when price wants to come down into this zone as the market trades forward and price pushes down, this will be, once again, our high impact, higher low to be able to anticipate the
[05:53] market reversing in the other direction. And keep in mind, this is only one piece of the puzzle, but it's starting to understand how to generally read price action. What we want to do is try to aim to take trades in the general direction that we anticipate the market will go based off of
[06:08] the current market structure. However, that doesn't mean that we can't take trades in the opposite direction to this so long as our analysis is telling us price agrees with the overall move. And we're not fighting the price action. So let's say we have an uptrend like this where we have a
[06:23] higher high, higher low, higher high. We have our inflection level down here, but a likelihood that price if it's going to continue to drop can and will come back down to this area so if we wanted to enter into a position in trade to the downside even though we are technically countering the trend with the next markers that I going to show you I looking at if those indications tell us we can trade in the down direction that totally acceptable All we trying to do is get a picture of where the market going
[06:51] on a bigger, more zoomed out view. That way, when we're following our entry model, our small trade entries are always aligned with a bigger picture concept that still makes sense. Okay, so let's play this chart forward now and really lock in the concept of exactly what we're
[07:05] looking for. So once again, price action makes contact off of that same level and eventually makes another additional move up higher. So once again, point of interest down here produces another high up here. Notice here, now price is starting to push underneath that previously
[07:20] respected level. It comes back up, responds off of this level, and now pushes and creates a new low. But just like how over here, we're looking for a confirmed close over that previous lower high,
[07:33] Now you'll see price breaks underneath tests off of this opposite side of this previous tested area. This is the lowest it goes and it doesn't make a full close underneath this consolidation. Price pushes up, fails to make a fresh high off of that level again, makes its way down,
[07:49] and finally puts a close in. And you'll see the market flushes and starts to confirm lower after we've confirmed this change of territory. So now we're going to move into step number two, which is going to be to mark off our points of interest.
[08:01] Okay, our point of interest levels are going to be mechanical market levels that hold importance for price to either pull into or potentially respect that we can use in tandem with our general understanding of how trends in market structure work.
[08:15] Okay, so let's look at this example again at 930. This is where the New York stock market is opening. There's going to be a lot of market participation increase here, which is where I'm trying to execute the majority of my trades. Okay, so at this point, we have our trend level established.
[08:29] We have our market structure shifted bullish. First thing that I want to do is mark off the previous day high and previous day low levels. Now, these are going to be our first point of interest as potential targets for price to move
[08:42] into. So here's my previous day high and this low right here is my previous day low. Okay, so these are our first upper and lower bounds of where we could expect price to potentially move for the next trading session. Okay, so this is one of the areas that I'm going to be using
[08:57] if the market gets momentum for key response levels. And I'll explain a little bit more in a second. Okay, the next thing that we want to look at is something called fair value gaps. And what a fair value gap is, is effectively a series of three candles
[09:10] where the first candle's high wick, in the case of a bullish fair value gap, doesn't overlap with the low wick of the third candle. And what we typically use this for is an area where price can, after seeing momentum, retrace into for us to be able to see the fair value at that price.
[09:26] When there's a lot of momentum, typically not a lot of trades are executed when there are gaps here. So we don't know whether or not after momentum that level can hold and confirm to be that value. If the market jumps back down below it, the momentum didn't hold.
[09:39] If it does, typically price is going to respect this gap and then continue moving in the direction that we got our impulse. So what I want to do is go through and start to add all of the key fair value gaps that I'm noticing.
[09:51] So you'll notice we have one right here, another one right here. but you'll notice price actually traded through this and completely invalidated it. So we're going to get rid of this fair value gap, but you'll see it was respected for this move. This gap here
[10:04] invalidated, so we're not going to use. I'm just sort of explaining why I'm using certain ones and avoiding others. Any gap that hasn't been filled yet or hasn't been disrespected, meaning prices traded into it but held it, is an unmitigated fair value gap. If it's mitigated, it means that
[10:19] price has invalidated it and it's no longer applicable. Next thing that I want to do is go to the previous trend direction and start to pick out my bearish fair value dots, okay? Which you'll see we have one right here, one right here, one right here.
[10:32] So you can sort of start to see where price is likely to want to pull into to establish that fair value, okay? And if we see price respond and then reject off of these, we can now use this to start to give us an idea of potential areas
[10:46] to look at our entry model. The next thing that I want to do is scroll out a bit and start to look for key support and resistance levels, which I can use sort of mark out with horizontal levels. So what I want to do is find areas where price seems to consistently respond and have high impact moves off of.
[11:05] So you'll see this level was touched, big move up away from it, respected here, big move up through here, respected, respected. Once this move was invalidated, huge move off of this area. So this is a hugely important level for the day.
[11:19] So I'm just going to mark it off as an area to pay attention. Okay, additionally, you can see along these loads, response here, respected here, respected here, respected here, respected on the opposite side here, and it's continuing to be respected through this level.
[11:32] So these two levels are also going to be areas that I just want to take note of in general. Okay, so now that we're looking at this 15-minute chart, this has gone from looking like aimless chop to knowing we anticipate that the direction is going to move here.
[11:46] Here are areas we want to see a price potentially respond off of. And then once price breaks this level is the only time that we're going to think the market is generally shifting to the downside. And what this does is prevents a lot of the sideways chop and mistakes of getting into
[12:01] too many trades or not knowing really where we want to try to focus. Now we're literally not doing anything until we see one of these key response levels start to indicate an opportunity that then we can go and act on.
[12:13] And this is going to keep a really tight filter on taking quality setups that align with what's actually going on in general with the market. And I understand this can look a little bit confusing, but if it is, just watch through the video a few more times.
[12:25] And even though it looks advanced, you'll start to get the reps in, understand, and know exactly how to look for it. Okay, step number three is literally going to be waiting for price to react off of one of our points of interest.
[12:37] So like I said, we're literally not touching anything until we see one of these levels confirmed. So if we play this forward, the price is now moving up against that level, takes a big move up. And the close here invalidates this bearish fair value gap, which never got a response off of.
[12:54] So we can go ahead and clear this away now. The uptrend is confirmed. This gap is proven invalid. and you'll see now we have a brand new gap that is forming right here. So we can go ahead and wait once again for something to happen. Now price is starting to approach into our key level for the
[13:10] day. So this point of interest that we drew as well as this newly formed fair value gap. Okay, so this is going to bring me to step number four which is going to be waiting for our entry model to align Okay so now we have a potential area where the market could respond off of our key areas and we need to find a target So what I gonna do is click into this menu here
[13:31] and open up a one minute chart next to my 15 minutes. In order to make my one minute chart a little bit cleaner, what I'm gonna do is click into my drawing on my 15, click on visibility here, and I'm just gonna move this up to two minutes
[13:44] or three minutes, doesn't matter. Then what that's gonna do is make it so that it doesn't appear on my lower timeframe chart because it's important to have full clarity when you're looking at price action. You don't want to be clouded with too many indicators. So I'm moving all of
[13:56] these things off. And so now we have our 15 minute potential entry and a nice clear view on the one minute to be able to look at where the New York market opens and where price is sort of establishing. And you can see, we can look at the same market structure mechanics on a shorter timeframe as
[14:12] Well, you'll see right here, we have our break of structure, break of structure, break of structure. And right here, we have our change of character. And this is going to be my one-minute entry model. So step number one, I'm waiting to see a change of character.
[14:27] Step number two, I need to see a fair value gap formed during this change of character, which you can see happens right inside of here. Okay, and once I see these two things start to happen, what I want to see is your price to start to pull into that area and have some sort of clean response.
[14:42] Okay, you'll also see this gap that was produced here when we got this big push up, it's right in the middle of our higher timeframe fair value gap also had a response to the upside.
[14:55] Okay, so could it have potentially been targeted? Yes, but typically what I want to do is wait for one of my signals over here to be actually respected. If you can see by the time we actually got this level respected, this gap had already
[15:07] been filled over here, which brings me to the next low level where we got our actual change of character. Okay, so for my entry model, I'm going to be targeting the midpoint of this fair value gap. What I want to look for is either the fair value gap producing candle, which would bring
[15:23] us underneath this low here, but considering this is a really, really tight stop loss, it doesn't agree with this piece of analysis out here. What I want to do is then look to target the next key area where there was obviously a lot of buyers stepping in and place my stop underneath that
[15:39] level which would be underneath this low level here that way if we respond off of this gap that's perfect but we sort of have this as a defense so the only way we can really lose this trade now is if this whole entire bullish thesis here gets invalidated and what we're trying to do once again
[15:56] is play off of this fair value gap being responded being respected up to one of our next key points of interest. So you'll see as the market plays forward, it touches into that point, gets an immediate response, ends up breaking down through it a bit, and then responding off of this low
[16:12] level. So we still haven't gone through the candle that was produced here, which means that the gap can still be respected, and we can now have a response off of that low level. So you'll see there price starts to actually positively respond. This is where the trade starts to get some
[16:27] momentum. The next thing in my entry model that I'm doing is reducing risk once we have the next break of structure. Okay, so price pushed up to this level, put in this high, pulled back down to our entry, which would mean this level is going to be my break of structure level, which is where
[16:42] I'm going to be setting my break even point. So now I'm walking my risk from that point to basically be flat with my entry. So stop loss moves up. Now we have a risk-free trade on the table, right? So
[16:54] We let the market play out and you'll see price pushed up and responded off of this tool. That brings me to step number five, which is targeting the next point of interest outside of one to four, which is setting a take profit level.
[17:09] And the way we're going to do this is by automatically setting our position up to target one to four risk reward ratio. You can see as I'm hovering my mouse over this box, that's giving us 3.92, which is we're making four times what we're risking on the trade effectively.
[17:23] Okay, you'll see as price is moving up, this fair value gap over here was still respected, which means this is going to be our next point of contact. However, we really didn't exactly get to our one to four level.
[17:36] So it's questionable whether we would have taken some profit at this level. But what I'm typically doing is taking off 50% at the next point of interest at a one to four risk reward. So if we didn't get it there, we would have gotten it here.
[17:50] What I like to do is wait for price to actually respond off of one of these key levels so that I don't lose out on any momentum on the next move. Because you'll see, then price proceeds to blow through this other level, get a significant
[18:02] amount of momentum, start to reject, then ends up invalidating this gap. If we could have also taken our second profit lot here, if not, this next area would be our next take profit level.
[18:14] Okay, but what you can do is also just use the same market mechanics to be able to follow the momentum of the trend. So either take profit at these key levels or understand that this is our break of structure.
[18:26] This is another break of structure in here. And then price changes character under here, fails to produce a high, and then gives us a change of character here where we could then conclude to take the trade off the table.
[18:38] And we're still making 4.3 times what we're risking on the trade. So that way, had this have moved all the way up to my previous day high, I would still have 50% of my position to be able to make 13 times what I'm risking, taking all the risk off the table, but I'm still capturing take profits at these key areas as well and following market momentum.
[18:58] And if we look at another example, price here has broken underneath a previously respected area, producing this low. And you can see it doesn't quite push up high enough to give us that change of character. But if you look at the gap that ends up forming as it sort of delivers higher, just to kind of show you how the mechanics of this work,
[19:16] we could technically trade this back up to this area, set our stop loss outside of this area. You'll see price ends up moving all the way back up directly off that area, and we're right at the midpoint of this respected fair value gap.
[19:30] Okay, it just comes down to how tight we want to follow our entry criteria. See, for me, I wouldn't take this trade because we didn't have a confirmed change of character. Let's take a look at another trade setup. You'll see, once again, our point of interest is this fair value gap.
[19:44] price pushes below this area, but immediately reclaims it with this price action that does now create a change of character. And you'll see we do have a bullish fair value gap, and we do have room for price to come
[19:57] up and test the opposite side of this again. We haven confirmed with a close below this level which means we still have reason to believe the market could end up moving up Does that mean we know it going to move up No but the point of trading is to put ourselves like I said into high probability areas
[20:12] So again, entries place at the midpoint. If we place our stop loss outside of this swing low area, you see price comes down. Does end up coming through our stop loss, so this is a loss, but just so that you can understand the concept, first of all, that is going to happen.
[20:26] But second of all, then price ends up making a full move and retesting our next point of interest. So had we have not gotten that sweep underneath this low, that's another six times what we're risking on the day.
[20:39] So if we're nailing one of these, we can now be wrong six times and still be break-even on the day, right? So don't expect to win every one of these trades, but the goal is to be able to filter it down and put yourself in these high-impact opportunities. Okay, and there's levels of how aggressively you want to filter your strategy.
[20:54] So what I've showed you is just how to follow the general rule, but now I'm going to show you a little bit more aggressive filtration. It can allow you to be a little bit more selective. So in order to filter really aggressively, let's use this next example here.
[21:06] So prices come into the opposite side of where our price action tested before, came into the midpoint of the gap and rejected hard. And you'll also see we have a higher low, higher high, higher low, higher high, higher low, higher high.
[21:19] And then here, you'll see price, in order to create a change of character, needs to break and close below this level. So there we have our first close. Okay, so what I can do is take a Fibonacci, let the price drop to the level it's going to drop,
[21:33] before starting to turn back to my entry. You can see we have a fair value gap here after our change of character. What I want to do is, in our market structure, we have this low and this high and this low. In the current push down that produced the impulse, I'm going to take a Fibonacci,
[21:47] Click on the high down to this low period. And what I want to do is see whether or not my entry is going to be between my 50 and my 61.8 on my Fibonacci. Now, this is slightly more advanced, more filtered. But what I can do is use this as extra confidence to make sure that I'm not getting in on, for example, gaps that are too close to where the current price is.
[22:07] I would rather have price retrace into this golden zone, which has proven to me to have a higher win rate. So I either want to have this rule or I want to have something called an opposite side retest, which is similar to what we're seeing here, where we have price respecting off of these areas
[22:21] and then coming in and testing the opposite side of it to potentially reject. And I would want to wait for something like that potentially on the one minute. But you can see in this situation, in order for price to reattempt this previously broken area,
[22:34] it would have to come all the way up and do something like this, in which case the idea is invalid. Now, if we had price action where it made sense to lows were lining up like this, now this is going to give me that extra amount of confidence to be able to enter the trade.
[22:48] It allows me to become a little bit more selective, like I said. But even just waiting for this 61.8 to 50 zone, we can aim our entry just inside that midpoint, soft wash outside of that level, even outside of this level.
[23:00] Okay, once again, our next point of interest is going to be this area, which gives us definitely more than 1 to 4. price enters into our level, pushes down, confirms close underneath this area, which is going to cause me to bring my top block to break even. So now it's a risk-free trade and I can let the
[23:16] market trade down to my points of interest. And you can see that's where price elite temporarily got its support, which would allow us once again to extract five, six times what we're risking. It's just up to you, depending on how strong you want to filter. As you can see on any given
[23:31] trading day, I'm either taking a small paper cut, so $880 loss, $2,800 loss, $2,700 loss. When I'm making these fairly big trades, I'm able to pull in 10.8, 10.4. If we click into these trade details,
[23:46] I'm waiting for my response off of my bullish gap here. I have my change of character set here. I'm entering in at my key point of interest, and then I'm playing all the way up to my previous day high area. You can see I take my entry here. Price eventually moves over my break-even level. I'm up
[24:02] $6,400. I take my partial profit at my one to four. And you can see this is my previous day high that I told you that we marked out before. And price comes up and gets me out perfectly at my previous day high target. And I'm able to lock in 10.8K on this trade. Also in the same session,
[24:20] you can see $10.4K. I'm finding my point of interest. This structure finally creates a change of character. I enter in at the opposite side, stop loss outside of that sort of risk boundary, and then price immediately moves down to my take profit, which is the midpoint of this
[24:37] bullish fair value gap. And you can see that's exactly where price ends up responding off. As you can see, I have my support level hit, a sweep underneath this low with my fair value gap after a change of character. I enter into my position. Here's where I'd put my position to
[24:51] break even. I'm up 8,500. Midpoint of this fair value gap is broken through. Once you reach that previous day high level, that's where I go ahead and take my profit off the table. Okay, so now I want to show you the cheat code to improving your trading with this strategy. Now, there's a bunch
[25:07] of different models and things to try, but how do you go about finding the best combination for you? So I'm going to show you exactly what I do. So I'm journaling using something called TradeZilla, and you'll see if I click into my trading day, I can click into this, and you'll see if I go
[25:21] over to tags, I have a model that I'm trading, my confidence rating, and then different what are called confluences, which are all of these different ways of filtering that I can add into my strategy. Okay, and what this will allow me to do is basically go out and find the best,
[25:37] most optimal combinations of what I'm looking for to make the most amount of profit. So then I can go over to my home tab here, and this is really cool, and say, based on my confluences, which
[25:49] combination gets me the highest net profit over time. Okay, that's going to explain to you all of the different things that are going to get you the highest amount of net profit. Okay,
[26:01] if you want access to TradeZilla and any of the other indicators that I use on chart here, you go to the description and get all of my indicators and tools, or just click on my Instagram and DM me the word tools and I'll send it over to you. But whether you're tracking it through TradeZilla or the other free trade journal that I put into my tools, you can find the best
[26:17] combinations of your rule set, test the strategy out using the bar replay feature on TradingView and very quickly figure out which rules are mandatory to get you the highest amount of profit so you don't have to guess and you're only executing what you know is in your best
[26:32] interest over time. If you're still here, make sure you hit the like button on the video. If you want to watch me executing the strategy, you can see more videos here. If you want to trade live with us and learn all of the more nuanced details to my trading strategy, you can check
[26:45] on our private team in education here. But until next time, I will see you all in the next video.



⚡ Saved you 0h 26m reading this? Transcribe any YouTube video for free — no signup needed.