
AI Summary
In this video, Brett Go, a trader with nearly 7 years of experience, shares a simple three-step framework for price action trading that he claims has made trading profitable and systematic. He emphasizes that most traders fail not because they can't read candles, but because they lack context, and he breaks down his approach into direction, location, and execution.
Chapters
Brett Go introduces himself, mentioning 7 years of trading experience, $1.7 million in profits this year, and his mentorship program, the 1% Club. He emphasizes he wants to help viewers become better traders, not sell them anything.
Most traders lose money because they read candlestick patterns without context. The market moves like a story, not a dictionary, so understanding the big picture is crucial for success.
The framework consists of three steps: Direction, Location, and Execution. Following these steps in order makes trading boring, methodical, and profitable.
Identify the overall trend direction on the 4-hour timeframe. Ask who is in control: buyers or sellers. Map out the most recent break of structure to define a swing range, focusing only on that range.
Determine where to buy or sell by identifying points of interest like supply and demand zones. Use premium/discount levels (50% equilibrium) to find optimal entry prices, ensuring good risk-to-reward ratios.
Wait patiently for price to reach the point of interest. Do not enter trades in the middle of nowhere or anticipate candles; wait for confirmation.
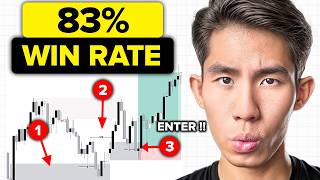
Once price enters the point of interest, drop to the 15-minute timeframe and look for three confluences: a strong rejection candle (engulfing or pin with displacement), a break and close in the bias direction, and a failure to continue against the bias.
Enter on the close of the confirmation candle or with a limit order. Place stop loss below the rejection candle or swing low, and take profit at 3R. Always define your stop before entering.
Avoid trading when price is in the middle of nowhere, when anticipating candles, when price just looks good (trading bias vs. price), or when the setup is confusing with conflicting signals.
A bearish example: identify downtrend, map supply zones, wait for price to reach unmitigated supply, then look for the same three confluences on the 15-minute chart to enter a short.
The three-step framework simplifies trading, reducing emotional decisions. Focus on quality over quantity, and follow a mechanical system consistently for long-term results.
The video concludes that a simple, systematic approach to price action trading—focusing on direction, location, and execution—can lead to consistent profitability by eliminating guesswork and emotional trading. Brett emphasizes the importance of patience and discipline in waiting for high-probability setups.
Mentioned in this Video
Tutorial Checklist
Study Flashcards (9)
What are the three steps in Brett Go's price action trading framework?
easy
Click to reveal answer
What are the three steps in Brett Go's price action trading framework?
Direction, Location, and Execution.
02:17
What timeframe is used for determining direction?
easy
Click to reveal answer
What timeframe is used for determining direction?
The 4-hour timeframe.
02:58
What is the purpose of mapping out a swing range?
medium
Click to reveal answer
What is the purpose of mapping out a swing range?
To narrow focus, time, and resources into a tight range, filtering out noise.
04:04
What are the three confluences needed for execution?
medium
Click to reveal answer
What are the three confluences needed for execution?
A strong rejection candle, a break and close in the bias direction, and a failure to continue against the bias.
12:51
What is a 'pin with displacement'?
hard
Click to reveal answer
What is a 'pin with displacement'?
A pin bar candlestick followed by a large bullish or bearish candle showing strong momentum.
14:50
What is the recommended take profit level in the video?
easy
Click to reveal answer
What is the recommended take profit level in the video?
3R (three times the risk).
17:42
What is the 'hidden rule' mentioned for trade entry?
medium
Click to reveal answer
What is the 'hidden rule' mentioned for trade entry?
If you cannot define your stop loss before entering, you don't take the trade.
18:25
Why should you avoid trading when price is in the 'middle of nowhere'?
medium
Click to reveal answer
Why should you avoid trading when price is in the 'middle of nowhere'?
Because it leads to poor risk-to-reward ratios, risking too much for too little.
05:02
What does 'failure to continue against the buyers' indicate?
hard
Click to reveal answer
What does 'failure to continue against the buyers' indicate?
Insufficient selling pressure, suggesting the market is likely to reverse upward.
16:21
💡 Key Takeaways
Context is Key
Highlights the core insight that traders lose not from inability to read candles but from lacking market context.
01:23Three-Step Framework
Introduces the central framework of direction, location, and execution that simplifies trading.
02:17Location and Risk-Reward
Emphasizes the importance of trading at optimal price points to minimize downside and maximize upside.
04:47Knowing When Not to Trade
Stresses that discipline in avoiding bad trades is as important as spotting good ones.
19:34Simplicity Reduces Emotion
Argues that simple rules leave no room for emotions, leading to mechanical and consistent execution.
28:19Full Transcript
[00:02] for years. Not because it's hard, but because nobody explained it in the right order. My name is Brett Go and I've been trading for nearly 7 years. And this year alone, I've already crossed over $1.7 million in trading profits. Every
[00:17] single trade documented live on my second channel, Brett Trades. In addition to that, I've also helped hundreds of traders became six figure funded traders inside my mentorship program, the 1% [music] Club. And I'm
[00:29] trading super app that is built for discipline and consistency. So quite simply put in English, I don't want your money. I don't need your money. I want you to become a better trader. Now that you know who I am, let's jump into the
[00:43] three steps that finally made price action simple and profitable for me. Now, when I started trading, I'm just like you. You know, I watch a bunch of YouTube videos about price action trading and I saw these gurus drawing a
[00:58] thousand different lines on their charts or they ask us to memorize a bunch of candlestick patterns like the freaking engulfing patterns, the the pin bar engulfing patterns, the the pin bar patterns and first of all is it's too
[01:11] overwhelming. Second of all, I could identify the pin bar candle, but I realized I still lose money even though I was following the candle to a tea. Right? So what I've realized over time is that most traders don't lose because
[01:23] they can't read candles. They lose because they are reading them with zero context. Which means that if you don't understand the big picture on why price move the way it move, it doesn't matter whether you have the perfect setup or
[01:38] the perfect candlestick pattern, your strategy will still fail. And nowadays, everybody's out here teaching price action like it's a freaking dictionary. But the market doesn't move like that. It move like a story which also means
[01:50] that if you skip to the last page of the book nothing will make sense because once again you are trading without context when you don't understand the reality of the market itself. You're just trading your perception of the
[02:03] market. So that is when I stop chasing random candlestick or chart patterns and I reduce everything to just three simple steps which I'm going to show you right now. If you follow these three steps in order, I triple guarantee that price
[02:17] action trading will become extremely boring, methodical, systematic, mechanical, but you'll be extremely profitable as well because profitability in trading comes from doing the boring repetitive
[02:32] task for an extended period of time. So these are basically the three steps that I want you to be following. Direction, location, and execution. Let's go through step by step. The first step is direction. The first thing you always
[02:45] want to be doing is to identifying the overall trend direction of the market. And at this stage, the only question you should be asking yourself is who is in should be asking yourself is who is in control of price? Buyers or sellers?
[02:58] be looking for longs. If it's sellers, I want to be looking for shorts. So, you right? So, this is where I usually go onto the 4hour time frame and I try to identify the trend direction. So look at this price action right here. It's very
[03:12] obvious that price has went up significantly for quite some time now. uptrend, right? But then what happened was that price actually pull back, goes up, pulls back, goes up and then right
[03:24] now this is where we are at. So the first thing is identify the trend direction and we have established that price is actually bullish right now and this is our most recent bullish breakoff structure. Now we always want to make
[03:37] sure that we map out the most recent bullish break of structure or bearish break of structure because we want to define our swing range. So right now you this is the lowest point that led to this break of structure and then this is
[03:50] a swing high since this is the highest point since price starts pulling back. So as a result I can define my 4hour swing range just like this. And once again, the reason why we actually define our swing range is so that we can
[04:04] further narrow our focus, time and resources into a tight range, right? Because early on when you are looking at this, you don't know what's going on and sell here or buy here or sell here. But when you just map out a swing range, it
[04:19] becomes crystal clear that this is the range that you want to be trading within. Which means anything outside of this swing range is simply noise. is simply a distraction because it doesn't allow you to formulate your bias. And
[04:33] much done, right? You just identify the direction which is bullish and we know that we want to enter for longs because we want to trade in alignment with the higher time frame trend direction. The next step is location. Now that you know
[04:47] next thing you should be asking yourself is where? Where do I buy? Where do I sell? And the answer to that question is going to be at a point of interest. We don't want to be trading when price is in the middle of nowhere. For
[05:02] at over here, right? So, if I try to enter for a sell right here, I would enter for a sell right here, I would have to place my stop loss above this right here at this swing low. And you can see this is not an intelligent
[05:16] risk-to-re decision, right? because this is you risking $10 to make back $10, because we always want to make sure that we get the best entries possible so that we can minimize our dial side and maximize our upside. And the only way
[05:31] you can do that is by trading at the best location by trading at the best price. So you pretty much can establish your location by identifying your point point of interest. I've already done a video covering each one of these point
[05:45] interest. But basically, there's your supply and demand zones, your flip zones, your order blocks, your flip plus sweep zones. There's a bunch of like again, if you want to learn more about each one of these point of interest,
[05:59] on YouTube and you will see a very in-depth tutorial on each one of this. the location, right? Where to buy, where to sell. And over here, what you want to
[06:11] do is to identify the most obvious supply and demand zones. Okay? So over we don't want to care about supply zones, right? Because supply zones is for people who want to enter for a sell. We want to look for demand zones. So you
[06:26] always start from the extreme swing low all the way to the extreme high, right? me jump down to the 1 hour time frame, which is my medium time frame. I see that this entire thing right here is the extreme low, right? Like you can see
[06:39] this entire candlestick right here. This is where what happened was that price came down, pull back, comes down, sip liquidity right here below this low and then later on it went up there and broke structure. So this is the extreme demand
[06:51] zone. Okay. And then there is also another demand zone right hereish, broken, right? So this is quite irrelevant. All right. So this pretty much leave us with like this demand zone that we have marked up right here which
[07:05] is also the extreme demand zone. Okay. And another thing that you want to do is to actually map out your premium and discount. So this right here is the premium and discount too. And if you want to copy the settings, I've put it
[07:19] take a screenshot of this or like pause this video and try to copy the settings right here. But basically what it does is that it allows you to understand enter for a buy or what's the best price point to do so. So above here, this is
[07:34] your premium level, right? So when price is in the premium level itself, you want to be looking for sells because price is considered as expensive or overbought. And then once price gets below the equilibrium level, which is the 50%
[07:47] area, this is where you want to start looking for longs because this is where price is considered as cheap, considered as oversold. Looking at this particular case itself, I pretty much mapped out my premium and discount by dragging it from
[08:02] the swing low all the way up to the swing high. And I've established that price is still in the premium pricing. It's still considered as overbought. So I shouldn't be entering for a buy anywhere right here. Which means I'm
[08:14] much more better off waiting for price to actually come down below this equilibrium level, right? Coming into the discount range. Then I start looking for longs. And it's not a coincidence that this demand zone is actually in the
[08:29] discount pricing as well. And that pretty much just tell us the location Right? That's the price point that price is most likely going to react and start reversing and give us the next move to the upside. And another thing is that
[08:44] really like the lowest point that price has to hold. It's really the last line of defense that price has to hold in Because in a bullish structure, we're
[08:56] creating higher highs and higher lows. Which means that this low cannot be lower than the previous low. If it becomes lower than the previous low, then the bullish market structure has broken and right now we are shifting
[09:09] bearish. So that's pretty much how you establish the the location, right? You interest. You may up your premium and discount. You want to make sure that you are trading below the equilibrium level if you're entering for longs. And the
[09:24] lower the point of interest is within the discount pricing, the more likely is going to hold because once again is the last line of defense that price has to bullish. All right, so that's pretty much the second step, right? The reason
[09:39] location is because we don't want to enter in the middle of nowhere because when we try to enter in the middle of nowhere, we tend to get trades which give us a very bad risk-to-reward ratio, right? So that's not a good opportunity
[09:52] that you should be capitalizing on. Now basically your job as a trader is to allocate resources is to allocate your capital is to determine which trades are worth taking and which trades are not worth taking. So in this particular case
[10:07] itself like I said when price in the middle of nowhere not worth taking when price is at a good point of interest is at a good price point worth taking. Yeah. So we always want to make sure that we focus on preserving our capital
[10:20] and deploying it when we see our A+ setups which are extremely high probability which brings us to the third step. Right? But before we go to the third step remember price have not reached our location yet. We want to
[10:34] down to our location. This is where you Trading View, right? I set an alert at this 1.32. So once price comes down, charts and you actually look for your entry models, which is step three. Or
[10:48] you can just wait very patiently for price to tap into that point of interest. So right here, do nothing, do nothing. As tempting as it might be to, sell, no, you stay calm. You do nothing. You do nothing and you wait and wait and
[11:02] wait and then eventually price comes down to your point of interest and your patience pays off. Which brings us to step three. Remember, you only go to step three, which is the execution step once price has entered into the point of
[11:17] interest. Once price has entered into the location, which means that before price does this, you shouldn't be going down to the lower time frame. You shouldn't be looking for entries. Okay? This trick alone will save you thousands
[11:30] of dollars. It will save you from making a bunch of stupid trades, rushing into the trades early, forcing trades when there is no opportunity, overtrading and all all that stupid amateur mistakes that you will make if you are trading.
[11:44] So right now the price has stepped into our point of interest. brings us to step three which is execution. This is where you want to ask yourself when when to buy when to sell. Early on we have established the direction which is the
[11:58] what which is buy or sell right which one right which one and then we have established the location which is exactly where right like where to buy and where to sell. And last but not least the execution tell us when right
[12:10] this is the timing when to buy when to sell. So once again we can get in at the optimal price point and can have minimal downside and maximum upside in English
[12:22] basically means how do I make a lot of money while risking a small amount of money. So once price has stepped into a point of interest you jump down to your going to be using the 15minut time frame itself. So at this point I'm looking for
[12:38] a few things right because I don't just want to enter for a buy and sell into my point of interest because what can happen is that price can just continue crashing down just like this. So I want to look for my confluences. I
[12:51] want to look for my confirmations so that once again I can get in at a perfect timing. So my confluences that I'm going to be using today is these three confluences that is all based on pure price action. Number one, a strong
[13:04] rejection candle. Number two, a break and close in the buyers direction. And continue against the buyers. I'm going to explain everything. All right? So, understand anything that I just mentioned right there. Okay? So, what
[13:18] just mitigated the point of interest, but it did not go up. There was insufficient liquidity, insufficient demand for the market to go up. How do we know that? Well, we know when price actually came down here, mitigate it,
[13:32] use some demand, use some buy orders in the market to cause price to fuel all the way up here, right? But once it actually fueled all the way up here, it continue crashing down. Price did not broke structure. Price did not took out
[13:46] this last lower high. If price is able to take out that last lower high, then that is where we know that demand has overpowered supply and the buyers are in control again. So this pullback is over and right now we are most likely
[13:58] shifting bullish. Okay, so that's pretty much the confirmation that we need. We need a very strong rejection candle as well, right? And also like a break and close in the bias direction. So at this point of time, what happened was that
[14:12] price has came all the way down here and let's observe what price does next. Okay, because this to me is a sign that I should be entering for the position price already came down here and swept
[14:24] to cover too much about liquidity because I really want to make sure that this three steps is as simple as humanly possible. If you want to learn more about liquidity, how to get the optimal price points, uh how to get the perfect
[14:36] sniper entries using liquidity, once again check out my other videos about liquidity. But basically, right here, there was a liquidity sweep over here. And we also got what I call a strong rejection candle, which is either a
[14:50] engulfing candle or a pin with displacement. So a engulfing candle is something like this, right? Where there's like a huge bullish candlestick just like this, which is much more bigger than the previous candlestick and
[15:02] it's simply engulfing it. And a pin with displacement is something like this as well where you got like a pin bar candlestick over here, right? It just candlestick it give you like a huge bullish candlestick just like this which
[15:15] signal to you that there's a lot of bullish momentum in the market itself. So that is my first confluence a strong rejection candle which is either a engulfing candlestick pin with displacement of both and ideally this
[15:28] case we got both and then you also want a break and close in the bias direction. Now bear in mind what's our bias right now our bias right now is that we want to look for longs. We want to actually enter for buys. So this means that we
[15:40] want to look for a break and close in the bullish direction. Do we have that the bullish direction. Do we have that yet? Well, we did right. We got price pretty much breaking uh this previous candlestick just like this and then it
[15:54] closed above it in the bullish trend direction just like this. All right, it's really just as simple as that. You basically want to identify the bullish candlestick closing above the previous bearish candlestick in a direction that
[16:07] you want to be trading in. And the next thing is failure to continue against thing is failure to continue against buyers. Now, right here, what's the bias? The bias right now is longs which means against bias means shorts. So when
[16:21] this actually happen over here this tell us that there is insufficient selling pressure in the market for price to continue going down because if price want to continue going down it's going to create more bearish candlesticks just
[16:34] like this and just cause price to absolutely collapse and continue going down. But that did not happen. What we do have is price came down retesting this level over here on the left hand side right here. But then there was
[16:48] insufficient sell orders. There's not enough sellers in the market and that cost price is just start reversing. So that to me is a failure to continue against the buyers and that's pretty much all the confences that I need.
[17:02] Right? So I pretty much got these three confirmations right here. Once again, all based on pure price action. No indicators, no complicated jargon whatsoever. Just clean price action. And this allows me to know, okay, this is
[17:17] the right time to enter. This is my entry signal when I got all of these criteria being checked off in my trade plan itself. So, this is where you can easily enter for a long ride here. You can either enter for a buy on the close
[17:29] of the candlestick itself or you can even place like a limit order like above this case, just going to keep things simple. Enter for a buy right here. Place my stop loss below this low here and place my takeprofit at let's say
[17:42] like 3 R just like this. Now you basically want point that will invalidate your trade ideal. So in this particular case itself like I said we have established that price is reversing right now right we
[17:57] are assuming that there is more buyers and the sellers in the market right now or it's about to reverse so this means that if price later on come down here and take out this low and just continue going down this means that our bias is
[18:10] wrong right this means that our bias is wrong and we get stopped out with like a 1% loss all right just like a small loss just like this and I have like a hidden rule which says that if I cannot define my stop before I enter, I don't take the
[18:25] trade. So I always make sure I think about what could possibly go wrong, right? And place my stop loss at that price point itself. And then in terms of just to keep things simple, you just place it at three times your stop-loss
[18:39] distance. So you drag this position two thing all the way up to like three just like this until it shows three over here like the risk to ratio. And that is Once again, just to keep things simple for this video itself. So, let's see
[18:53] continue going up just like this, right? Continue trickling up and slowly but surely it eventually comes out there and smash our TP. Really just as simple as that. And all we did was that we used three simple time frames which is the
[19:08] 4hour for direction, the 1 hour for location and the 15-inut for execution. And on a 15-inut for execution, we look for three confluences, right? So, three
[19:20] steps, three time frames, three confluences, simple methodical strategy that you can execute consistently for a longest time. And that's how you get consistent results. Now, before we look at the next trade example, I want you to
[19:34] understand something. The hard part about trading is not in spotting A+ setups. It's in ignoring everything else. Like right here what you can see on the screen this is an obvious A plus setup because yes checked off every
[19:46] single entry criteria and I've done sufficient preparation and analysis by looking for my three steps before I actually enter for the trade. But there are going to be days where you do the three steps and price does not get to
[19:59] your desired location or price enter into your desired location but it does not give you a confirmation signal which means you don't get all of these means you don't get all of these confluences on those days. It's very
[20:11] confluences on those days. It's very important that you stay away. You remove your hands physically from the keyboard and you do not trade. So, it's important more important to know when not to trade. Because if you trade during those
[20:25] you're going to make a bunch of stupid decisions, make a bunch of unnecessary decisions, make a bunch of unnecessary losses, and it's just not worth it. So, here's when not to trade. I personally do not enter when price is in the middle
[20:41] price middle of nowhere, just like this, not at a optimal price point, not at a location, I don't enter. I'm much more better off waiting for price to come point of interest, then I look for my entry. That's non-negotiable. Another
[20:56] thing is I don't anticipate candles. So over here when price is like coming down god, I'm going to enter for a buy right now." I'm going to assume that price is No, you don't do that, right? You always wait for your confirmation candle
[21:12] because if you do this, what happens is that if you don't get a confirmation, price can just continue collapsing and it will get stopped out. Once again, unnecessary loss that could be avoided if you were a little bit more patient
[21:24] and you wait for your confirmation candle. And number three, I don't enter just because price looks good. Remember, you don't want to be trading your bias. about the market. You want to be trading the market itself. You don't want to be
[21:41] imposing your will onto the market. What I mean by that is that when price comes down to this discount pricing, you shouldn't assume that price is going to reverse immediately. Oh, price has came down below this 50% equilibrium level,
[21:53] time to buy. No, it doesn't work that way. You always want to make sure that once again you look for your extra confirmations, right? So don't enter just because price looks good or price looks cheap or price looks expensive.
[22:06] You don't decide whether the market is going to move up or down. Value is going to move up or down. Value is subjective. Price is objective and we always want to be trading price. We don't want to be trading our perception
[22:19] of price which is value that we attach to price. And last but not least, I don't take trades where it's too confusing, right? which means there is a lot of different conflicting biases like for example I have spot all of these
[22:35] three confluences itself but the thing is somewhere in my gut says that price is going to continue going down and the internal structure is showing me that because there's a lot of like bearish candlestick just like this when you have
[22:47] such a conflicting bias just like this where you don't know whether you also enter for a buy or sell that's probably a trade that is worth passing on because when a good trade ideal present itself like a A+ setup. It usually hits your
[23:01] head like a 2x4 truck like just thinging and then you will know that that's the trade worth taking because like I said your job as a trader is to allocate resources wisely efficiently. So you want to make sure that you deploy
[23:14] want to make sure that you deploy capital only on A+ setups. So those are the scenarios that I personally do not trade. Like I said, very important for you to understand these scenarios so that you can catch yourself in one of
[23:26] those scenarios and you can stay out of the market instead of getting itchy fingers and taking a bunch of stupid trades, playing stupid games, winning stupid prizes. All right, so for the next example, I'm just going to like
[23:38] speedrun it because by now you should have a very clear understanding of this three-step framework and how to properly utilize it. So first step, look for the price is going down, lower highs, lower lows, blah blah blah. You've heard me
[23:52] say that a million times by now. And you want to map out the most recent break of structure so that we can get our most recent swing range. Uh this is the swing high right here. And then this is the swing low here. And you can also map
[24:06] this high over here as well because this is also a very obvious high or you you just remove that. Anyways, when that actually happens, you can actually look for your location next, right? Map out your premium discount. You will see that
[24:19] equilibrium level, which is good news for us. Okay, this tell us that price is soon right now. But how do we know where, right? Well, we map out our supply and demand zones. So, we always start from the extreme. This is the
[24:34] extreme supply zone over here. And then followed by this supply zone that we see this is already mitigated which means price came down mitigate that was within the supply zone just continue dumping just like this. So most likely
[24:50] price is not going to respect this zone. What I do want is the unmititigated supply zone like this one right here. Okay. So that's the unmitigated supply zone that price is approaching. So this is where this is the point of interest
[25:02] that I want to pay attention to number one and number two. So at any point of interest right once I can see these three confluences I'm going to enter for a sell that's it as simple as that and I do nothing until any one of these point
[25:17] of interest get mitigated so over here price came up here that's it tap our zone boom finally tap our zone the minute tap our zone drop down to the 1 hour time frame itself and once again price has already entered into our
[25:29] desired location we have already established the direction which is down and we want to enter for a Now comes down to execution. Execution very simple. You just look for once again these three sort of confluences
[25:43] that you can see right here. So at this point of time price mitigated the supply zone came down. Do we have a strong rejection candle, a engulfing candle or a pin with displacement? Yes, we do. Right? This is a pin with displacement.
[25:57] Price came up there, rejected it and started coming down uh very heavily. Do we have a break and close in bias direction? Yes, we do. Right. Price pretty much came down here and took out this last low right here and pretty much
[26:11] broke the last low and it closed below it. Is there a failure to continue against the buyers a trap candle? Yes, we do. Right. What will happen is that when price went up there pulls back, it wanted to go up and continue. Right. If
[26:26] it were to continue with this uh bullish short-term trend direction, what could doing this. But that did not happen. It actually failed, right? Supply overpowered demand. We got pretty much price crashing down here. So that is
[26:41] simple as that. We can look for shorts any point of time right here. So over here, if I would enter for a sell here, once again, you want to be placing your stop loss at a price point that invalidate this trade idea itself.
[26:54] >> [snorts] >> So right here, where is the pin with displacement? Where is the strong rejection candle? As much as possible, you want to place your stop loss above the rejection candle. Because right now,
[27:06] we are assuming that if price were to remain bearish, it's like this. But if price were to continue bullish, right, it might mitigate some up and take out this high right here, take out the rejection candle. So that
[27:22] is like the highest point that price has to hold in order for price to remain which invalid the trade ideal. I'll place it right here above the rejection candle and once again place a stop loss at 3R just like this. Okay. So let's see
[27:38] price went up there. You can see what happened over here was that price went up there and tried to retest the previous rejection candle itself. Which at the wrong place, like let's say below or above here, you would be stopped out
[27:53] just for price to go in your way. All right. So in this case, we are still in the position itself, right? Let's just continue to see how price react whether market. Okay, there is sufficient supply in the market and then price just
[28:05] continue going down and slowly and surely let me just go up to the 4hour time frame. Let's see whether hit TP or not. Come down and smash our TP. As simple as that. And once again, it all comes down to these three simple steps.
[28:19] Direction, location, execution, and waiting for your three confluences. videos, you will know that I like to make trading simple. I try to simplify it in a way where like a 5-year-old can understand because I fundamentally
[28:34] believe that when the rules are simple, emotions have nowhere to hide. If you have a very clear systematic framework in terms of how you map out your charts, analyze the charts from top to bottom and you have a very clear criteria on
[28:48] where to enter or rather when to enter. Once each one of these criteria has been met, then there is no room for guesswork, secondguing or emotion whatsoever. You just follow the
[29:01] mechanical trading system like a freaking robot. And when you do that, that is where you realize that you actually take much fewer trades because now you're focusing on quality instead of quantity. And that is where you tend
[29:13] to spend less time overthinking and thinking uh should I enter for a buy, should I enter for sell because now you actually have a structured system. And You stop forcing trades and you know exactly what constitute as a A+ setup
[29:27] and you just ignore everything else. Like to me that's the holy grail right there. is just a mechanical trading system that works and you do it and you keep on iterate on it, keep on making it better, doing more of what works and
[29:41] passes, as long as you put in the consistent actions, your results will be not saying that this is the only way to trade price action. This is just like 1%
[29:53] of my entire market mechanics trading strategy. There's a lot of different account of. There's also a lot of different market conditions that you need to be aware of because this type of strategy, it might work here and there,
[30:07] but it's not going to work if the market conditions start changing. Which is why mechanics, which is the trading strategy that I personally use, you can check out this playlist right here. You can go and binge watch every single video in here.
[30:20] And I can triple guarantee if you apply everything you learn here, you will become a master at analyzing the charts. And to me, learning market mechanics is like taking the red pill. Once you see it, you can't unsee it. So, go and check
[30:32] that out yet. Nothing to sell you here. Just go and watch those free courses and I'll see you guys in the next video. And as always, remember, you're just one as always, remember, you're just one trade away.