

3-Step Strategy: $3,496/Day
45sClaims of high daily earnings with a simple method spark curiosity and desire for financial freedom.
▶ Play Clip"The title promises a simple strategy that makes $3,496/day, and the video delivers a detailed three-step method, though actual earnings are not guaranteed."
Craig Percoco, a full-time trader with over five years of experience, presents a simple three-step trading strategy designed to help traders understand market movements and achieve profitability. The strategy focuses on identifying ranges, changes in market structure, and precise execution using technical analysis tools.
Craig introduces himself as a full-time trader and shares his success, including a six-figure year and his mentorship program, Innovate Trade.
The market is described as a representation of mass human psychology and decision-making, mixed with market makers seeking equilibrium.
The three steps are: Range (identify the current range), Change (detect a change in market structure), and Execution (enter trades based on fair value gaps and liquidity levels).
Using a 15-minute timeframe, Craig looks for break of structure (BOS) and change of character (CHoCH) to determine if buyers or sellers are in control.
The Neve Trade Pro indicator (an advanced RSI) helps identify overbought/oversold conditions and highlights potential reversal zones.
The IT Foundation indicator marks 24-hour increments and market open times, helping to identify key areas where price is likely to react.
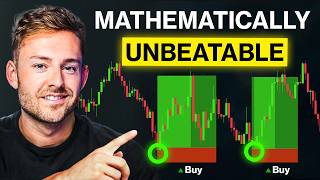
Fair value gaps (FVGs) are areas where price is likely to retrace. They are identified by a series of three candles where the second candle's wick does not overlap with the third.
Craig switches to a 1-minute chart for entry, waiting for a change of character, a fair value gap, and a liquidity inflection level to align.
The entry model involves placing a stop loss slightly outside the liquidity inflection level, targeting the midpoint of the fair value gap, and aiming for a 1:4 risk-to-reward ratio.
Avoid trading during high-impact news events and when there is no strong close through a change of character or a high-impact fair value gap.
Craig emphasizes the importance of following the system, not moving stop losses prematurely, and maintaining zero expectations per trade.
Happiness in trading equals expectation minus reality. Traders should focus on executing the strategy over time rather than individual trade outcomes.
The three-step strategy—range, change, execution—provides a structured approach to trading by focusing on market structure and key levels. Success requires discipline, proper risk management, and a psychological mindset that accepts losses as part of the process.
What are the three steps of the trading strategy?
Range, Change, Execution.
02:16
What does 'break of structure' (BOS) indicate?
A break of structure indicates a change in trend direction, e.g., higher highs and higher lows for uptrend, lower lows and lower highs for downtrend.
04:06
What is a 'change of character' (CHoCH)?
A change of character occurs when price breaks a previous swing low or high, signaling a potential trend reversal.
04:18
What is a fair value gap (FVG)?
A fair value gap is an area where price is likely to retrace, identified by a series of three candles where the second candle's wick does not overlap with the third.
09:43
What is the recommended risk-to-reward ratio for the entry model?
1:4 risk-to-reward ratio.
15:23
Where should the stop loss be placed?
Slightly outside the liquidity inflection level.
15:51
When should you avoid taking a trade?
During high-impact fundamental news events and when there is no strong close through a change of character or a high-impact fair value gap.
20:56
What is the formula for happiness in trading according to Craig?
Happiness equals expectation minus reality.
26:24
What is the purpose of the IT Foundation indicator?
It breaks out 24-hour increments and shows market open times to identify key areas where price is likely to react.
07:42
How does Craig define the market?
A representation of mass human psychology and decision-making by people, institutions, and algorithms, mixed with market makers seeking equilibrium.
01:22
Market as Mass Psychology
This insight reframes trading as understanding human behavior rather than just numbers.
01:22Three-Step Process
Provides a clear, actionable framework that simplifies trading into manageable steps.
02:16Fair Value Gaps
A key technical concept that helps predict price retracements and set targets.
09:43Expectation vs Reality
A psychological principle that helps traders manage emotions and avoid disappointment.
26:24[00:02] because it's too hard, but because no one would explain it fully with clear consistent and repeatable. I'm Craig Percoco. I've been a full-time trader and investor for over 5 years, and luckily this year so far with one
[00:16] six-figure mark, which I document on the YouTube channel and with the private side of my team. Additionally, I'm proud to say I've been able to help hundreds mentorship program called Innovate Trade, which I've been constantly
[00:28] developing over this journey with other verified six-figure funded traders from all over the world to build what I believe to be a world-class team. Okay, of this video. In this video, I'm going to be showing to you in raw terms the
[00:40] be able to do this, and it literally consists of a simple three-step process executable, and most importantly profitable.
[00:52] something like you where it was a bunch of mixed things or oversimplified things executable, no matter what strategy you're trying to do that with. If you doesn't resonate with you and allow you to use what makes sense to you to apply
[01:09] be able to execute on that. And that's exactly the framework that I'm using here. This is largely applicable across markets and across time frames. Figuring able to capitalize off of that. If you think about it, the only thing that
[01:22] a chart is a representation of mass human psychology and decision-making by the means of people, institutions, algorithms. And this is mixed with market makers that are literally trying to make both sides of each trade, making
[01:35] it so the price is always trying to seek equilibrium to the path of least things and figure out what is likely to happen based off of those and put ourselves in a generally great position to be able to capitalize on the market
[01:49] moves. Once I started looking at the market as mass human psychology and just trying to seek equilibrium, it changed everything about how I viewed much more intuitive and this is kind of what led me to this three-step process.
[02:03] If you follow these three steps, I promise you by the end of this video, how the market actually moves. It's going to help you set up opportunities, going to make it way easier to reach that profitability stage. Now, let's get
[02:16] into breaking down this three-step process. What we're going to be focusing process where we're going to be looking at range, change, then execution. execution part which I'm going to get to a little bit later in this video. If I
[02:30] we're going to notice is that price naturally goes back and forth in these ranges. What I'm trying to do is figure out in general with the current price Is it the buyers or the sellers? And what we want to do is figure out very
[02:44] early on where we can position ourselves to find the beginnings of these moves upside because then obviously we can position ourselves there to be able to ride these waves up. Now, obviously, we can't predict this every time. So, we
[02:58] need to strategically position ourselves with filtration processes and also by, you know, aligning the execution to be able to make it so that when we are fully capitalize on it and if we're wrong, which is inevitable in trading,
[03:12] predict the markets. All we're doing is reacting and then playing into probabilistic outcomes over time. We need to be able to figure out how to incorrect about our thesis. That's
[03:24] to be right every single time. You're not going to be right every single time. to set yourself up for failure. All we're trying to do is build mechanisms capitalize when we are correct about our trade thesis. So, what I'm going to do
[03:39] is start on a 15-minute time frame here and that's going to show me kind of a at. In order to figure out whether the buyers or sellers are in charge and is important for the first step. I'm going to do a few things. If we look,
[03:53] generally speaking, during this period of time, price was moving down. There is terms of technical analysis so that we're not guessing. And what we're really looking for is something called a break of structure. Now, I can sort of
[04:06] just visually identify this, but simply put so that we can actually get the reps in and look at how it truly works. How we're going to truly be able to identify trends is by looking at the lows, the highs, the lows, then the higher highs
[04:18] to give me what's called a break of structure, a higher low, a higher high, and then as soon as we have price changing underneath that low, that's giving us something called a change in character. Once we have candles closing
[04:32] we can kind of just look at generally where the bottoms of these low levels as we start passing underneath that, we can kind of anticipate that the sellers downside. But we do kind of need to be able to look at it on a technical basis
[04:47] the sand. Two things that I'm really looking for to determine the beginning buyers or sellers in charge. After this change of character, what we're looking for is the next swing point where there's a low, a lower high, and then a
[05:01] which is identified right here, this is our new bearish break of structure. This the sellers are in charge. And we can basically look at how that plays out with the price action and where we have these liquidity inflection levels. Okay,
[05:16] liquidity inflection level is going to give us opportunities when it comes to our execution and really being able to identify those points as well. First generally speaking, once we know the area where price action is typically
[05:29] moving in, we can basically be able to look at where we are in this current general range. In this process, I also use something called the Neve Trade Pro advanced version of an RSI that's giving me a little bit more clarity with these
[05:44] play a little bit more importance later, but generally you can see when we have overvalued, it's not going to nail it perfectly every time, but in conjunction highlights. Price is generally overbought here and ends up moving down.
[05:59] And like I said, this alone is not going to show us bottoms as we can see right then price continues to move down. But when we do have the market structure itself showing us, for example, here
[06:11] where we are in highlighted state, this was actually that low before move up. high before a roll off, and then we have a cluster of highlights up in this vicinity. Just to emphasize a lot, this can help us in terms of looking at the
[06:25] general picture of where we are in our ranges to set us up with opportunities. I want to factor this in and if I'm trying to capture a move on either side, whether it's to the downside here or to the upside here, doing so in an area
[06:38] where we just had a highlight can be extremely beneficial as far as timing those general areas that are going to anticipate big leg up in the opposite direction. What this is going to allow us to do is basically figure out if say
[06:50] here the sellers are in control, as soon as we have a close above this area and high impact areas and we're going to use other things to identify that. Price is basically likely to do two things. This is either the big focus area where price
[07:04] is now going to move completely in other direction, in which case we can extract three, five, 10, 15 plus sometimes. You're going to see examples of it where we can ride trends out for a long period of time, or that's going to be incorrect
[07:16] and it's going to be a fake out area and then price is going to continue moving that can be minimized so long as we're actually selecting key opportunity areas, which is going to be identified by the next part of this three-step
[07:29] process, which is going to be the change section. In order to add a little bit step number two is I'm going to add something called the IT Foundation indicator. By the way, the Never Trade Pro Plus and the IT Foundation indicator
[07:42] section. Just click there and I'll send everything over to you so you can add it along or if it helps you with any of your other trading. What this is going to do is break out basically 24-hour increments and show me with this red
[07:55] Market open is. Now, that's going to show us where a lot of the initial to be and that's going to be a lot of opportunity where a majority of the here identifying my range, I can see that here we have our break of
[08:10] structure, sellers are in control. Right here, this is where we have a change in that state. We failed to break a new low here and we push up, make this high, make a low, make a new high here. Now we have another break in structure. We have
[08:23] us our liquidity inflection levels and that means that now the buyers are in control. Until, once again, we have these high, low, high, low failure to break a new high. Okay, we have this swing point put in here and whereas this
[08:36] price action back here isn't necessarily pertaining to the current trading I'm sort of going through the reps of understanding the general range that we are in and who's in control. After we have this low level close like this
[08:50] creating this change of character, now into the session we know overall the sellers are still in control at least for the time being. Any trade that we're following the direction of this current move or we're waiting until we get the
[09:03] first notice of a potential new trend in the opposite direction. Like I said, all market mechanics going to work and then find opportunities inside of that to be the change of character here and then we have this secondary push under here,
[09:18] that's giving us our break of structure which is confirming that the sellers are now in charge. Now going into this session, if we didn't have anything on our chart, we would be completely lost as to what we should do. Now we know
[09:30] over and we can start looking for indications to play this to the downside. Going back to the equilibrium what I want to do is be able to identify something called fair value gaps. What
[09:43] this sort of higher time frame look to get our zone and get our basis, is I want to look at where we've had in this previous trend, now that we're moving in the down direction, where has there been a series of one, two, three candles
[09:57] doesn't overlap with the wick of the third. And that's going to be called a fair value gap. All I want to do is be able to mark out those and drag those was speaking about before, price is going to want to pull automatically into
[10:11] those areas and have responses off of them. You can even see already, if we draw this one over, that's exactly where price pushed down into before coming inflection level, and now we're dropping potentially down lower into the session.
[10:24] We know price is going to want to draw into these gaps. We have two prevalent ones here that are sort of teed up for us if the sellers do continue to take moving up, that's also fine. You can see
[10:36] up into the midpoint of those. Once session, touched that level, and then rejected off of it. So, we can look on the opposite direction, too, and look for the next one that has not been
[10:48] touched, which would be this one. Okay, so we have some ideas now generally of going to check off our range tab. Keep these fair value gaps in mind as well. We're going to be using them for the execution stage as well. This is where I
[11:00] want to move down into a 1-minute time frame. This is where I'm actually going to be placing my trades. And what I like to do is use this double window here, and I'll click off of this and hit the settings, and then I'm just going to go
[11:12] 15. That's going to allow me to see it on my 15-minute window, which you can see I click here, have on my 15. If I click here, I have on my 1-minute time too distracting. If I'm starting my trading session, most people are going
[11:25] are pushing up, and think, "Oh, I got to start buying into here." Right? But we know, because we saw this price action here, the price hasn't made its decision session. So, we're not entering into anything until we see a change. I know
[11:39] that price has responded off of this level, that the sellers are now in control, and where price is likely going to want to gravitate if we get a move in re-emphasize, I don't know if this is going to happen. It's not like I'm
[11:51] saying price is now going to definitely move down. But now, we have an idea generally in an indication that we have a fresh potential for price to want to going to invalidate to the upside. And we can constantly be asking ourselves
[12:05] these questions on the higher timeframe. This going to allow us to get a bias for the day to say if we get a move down, and we get that change, which is step capitalize on that move so that if it does play out, we can make the move play
[12:18] my 1-minute, like I said, we've seen the response off of that higher timeframe. What I want to do is, once again, figure out that range level where we're at. So, that we did on a higher timeframe, but on the 1-minute timeframe, this is
[12:32] still important. You don't want to just be drilled into a 1-minute timeframe. which confirms that the sellers are in control. We have a failed low here. This character, buyers are in control. We get that rejection level. Now, we have these
[12:47] lows being produced, and right out of the gate after our rejection of this range, where in order to confirm that we're now on a 1-minute timeframe, on a buyers out of control the sellers temporarily in control. We once again
[13:02] need to wait for a change of character underneath this level. This is going to prevent us from getting into a lot of BS chop. So, say price plays forward, notice how there's one big high-impact candle that is forcing the buyers out of
[13:15] take control. Right, so as I play this forward, we have our confirmed change of character, sellers are freshly in control. Now, we have a situation where on a macro, we've had buyers, sellers are in control. In our 1-minute time
[13:28] frame, we've had a rejection for the buyers. We had sellers, buyers, now we have sellers back in control. This is going to bring us to the execution want to see is that change of character level, and we want to see one of these
[13:41] fair value gaps being produced at or around where we get that lower time see we have right here. And this is going to take us into stage three, which few things. We have some momentum to the downside, sellers are taking control.
[13:55] This area was respected, moved up, and then failed. So, the probability of this area being tested again and responding off of it again and holding is a lot lower because we've already pulled a lot of the liquidity out of this area and
[14:07] tested again, it's probably going to invalidate, but now there's the next major area here that has not been invalidated that is going to want to pull the price down if the sellers have taken over. So, step three is complete.
[14:20] In step three, what I'm looking for is I need to be able to identify a change of character on the 1-minute time frame, a fair value gap produced by that change of character or at least around it, and a liquidity inflection level created,
[14:32] which is going to open up opportunities where price is likely to come back up continuation back in the other direction. And having price be able to retest that is more of an extra confirmation, but we still need that
[14:45] area to be broken in a potential inflection level to be produced based up for execution. So, now we've gone through the three-step evaluation, and now we have a way boiled down view to not get mixed around, to not be taking
[14:58] random parts of the market, and we can go into executing on the model. And that I'm going to show to you as we make it a little bit further through the video, which has drastically helped my trading. But to keep it as simple as
[15:10] the basics for now and get into the entry model. Here's how I'm going to opportunity like this. So, the first thing that I'm doing is waiting for, Once we have the fair value gap in the liquidity inflection level, here I'm
[15:23] positioning myself to target the midpoint of these fair value gaps. All to four. You'll start to see as I go through more examples of these why but just as a simple example here, notice how price action bounced off the
[15:38] middle of that before continuing to make a move up. Notice how we have this gap the midpoint. You're just going to see a lot of these examples as we go through. Ideally, I'm going to place my stop loss slightly outside of this liquidity
[15:51] inflection level. This is kind of my last line of defense that price can come up into, have some sort of resistance off of, and then continue back into my direction. So, that's going to be the first component of this process. I like
[16:03] to also place my position a little bit before this midpoint. That way I can filled. I'll do a slight example here. Say I want to risk 100 on this. That's going to show me I need to use 344 units. I can set up my position there.
[16:17] You can see price comes up and tags this area. Depending on where we draw our off of this wick, which is technically the swing low on this, that's where the opposite side came up to retest. Originally, we had drawn it here, which
[16:30] perfectly every time. We can look at this also as a liquidity inflection of character and the fair value gap produced. We're entering at the thing that I'm doing, if we get a confirmation off of that level and price
[16:44] doesn't immediately just move through the stop loss and close us out for a contained loss, is I'm going to mark off the next low swing point. This is going to be where I move my stop loss down to break even, taking any of the risk off
[16:58] forward, we did have a candle close slightly below this level, so that's where I can now reduce my stop loss to two break even. I'll just do that with this red line so you can see where the original stop loss was. Some people like
[17:11] pair that you're trading. If you want to go a little bit more risk on and you're trading with a slightly smaller amount of money and you care less about a smooth line and you want more upside, it can simply be held and all I want to do
[17:23] now, once I see this invalidation of this fair value gap, is look to target the next draw in liquidity, which is going to be the midpoint of this higher time frame fair value gap once we get the confirmation of the trend direction.
[17:35] direction, we would be targeting the liquidity up here in this gap, in this gap, and in this gap. You can see we responded off of that and now we're target all the way down to here, you can see our upside is 8.81 what we're
[17:51] risking on the trade. So, we're making 8.8 times the initial risk on this potentially be incorrect about this timing a pretty significant amount of these play out when we can catch these
[18:05] these play out when we can catch these opportunities, which are pretty often. tags that area, and then has a massive response off of. Position can be closed
[18:17] out there. We're able to make eight or nine X what we were risking once again trade, let's take a look at where the price action is and try to do this again things up a bit. Let's take a look. We've had a response off of this area.
[18:31] Now we know that sellers are in control. Once again, what would I do? I want to levels are, which are going to be right faster so that we can get more realistic reps in. We do currently have a break of
[18:44] structure level underneath here, so the sellers are still in control. Price getting a little bit of momentum. And what you'll notice, as we draw our liquidity inflection level, price breaks up above, fails to produce a new low
[18:57] underneath this area. That is the gap that pushes us past this critical area character that we're looking for. This was a key area where price caught major support off of that low, broke underneath, rejected off of, rejected
[19:12] off of, rejected off of, and then came up rejected, and then broke with impact. from a liquidity inflection level. And this is the fair value gap that was produced to break out of that range and actually produce this change of
[19:25] swing point failed low. That is the high once again, we have our change of character, fair value gap, and liquidity inflection level. So, we go over to the entry model. Entry model is going to be
[19:38] set up just inside of that mid point, put underneath that inflection level. I start with a standard 1 to 4 and put the buy order. Price comes back down, tags that entry. Now, I'm setting up this position for my break even level. We get
[19:51] a nice push to the upside. And if we look on our higher time frame, the next target area is going to potentially be the midpoint of this higher time frame to our 1 to 4, we've already broken and invalidated the midpoint of this gap,
[20:05] which means now the next area that we want to look for is either going to be at the next gap, which would be all the way up here, or at the midpoint of this gap, which was respected, flipped, respected on the bear side, which should
[20:18] act as temporary resistance, even if price does end up rejecting off of it. high impact key levels here. But as far as support flipped resistance, price is going to want to run into that. At this point, we have our stop loss reduced to
[20:31] break even, and then we get a push up. Notice how we're responding off of that midpoint even temporarily, and that's a heavy area of resistance. So, this is a position out of. And you can see lo and
[20:43] some resistance. We can continue playing this throughout the session. I promise not cherry-picked examples. Those are actually live trades that I took in real execution of those so you can see it happening in real time. But before we
[20:56] get into some examples, I want to show you when to not take these trades. First of all, anytime there's high impact fundamental news at your entry, it's lot more volatile. With this type of strategy, it can still be done, but it's
[21:09] still not the most optimal conditions for that. The second situation is when we don't have a strong enough close through a change of character or a high impact candle, for example. So, say we want to play out of this range, and then
[21:21] then breaks below it, and there's not really a big fair value gap here that is definitive and or on the opposite side of this liquidity inflection level. If see there's not a big enough push in momentum for this to actually be an
[21:36] actionable area. That's why I want to see a high impact fair value gap during getting in via sideways chop, and we're not having a lot of increased volume or a very actionable decisive move, these
[21:48] entering the markets into. One last thing that I'll say, it is very normal for price to go almost all the way back up to your entry level, and then move all the way down in your take profit. So, it's very important to remember to
[22:01] follow your system rules. Do not start decreasing your stop loss into profit, I'm keeping the system safe, and I don't want to lose money." It's very normal for price to rebound to that area before going to full profit. So, you need to
[22:13] leave it alone. Only reduce to your break even level when you get that new break of structure. Otherwise, leave it alone and just target and let those reach. Now, let's go through some live examples of me actually executing
[22:26] off with the first two examples that I used, so that I can show you that those happened back-to-back in sessions, and that I'm not cherry-picking examples, and that these happen on a routine basis, as I show in my live trading
[22:38] still a lot of losses. I'm not glamorizing this in making it unrealistic, but what I am showing you is that if you can actually master this really good ways to find really good areas. Here's the example that we just
[22:51] of the same analysis here. I have my higher time frame pulled up on the side. I have the same fair value gap set up with the response level. I have my same liquidity inflection level set up, same levels marked out. That is the fair
[23:04] value gap that I'm targeting. I set up my order. I set up my break even level, and you can see where I'm targeting on my take profit. As this level reaches break even, I'm reducing my stop loss as price moves up. I'm evaluating my stop
[23:17] time frame fair value gaps, and I'm using that inverse fair value gap area outside of the 1:4 to make a discretionary decision to lock in full amounts of profit. You can see I locked in partials at the 1:4, and then I was
[23:30] able to capture the rest of the move and close it out like so. That's exactly how I was going through the process of entering that trade, executing that same ideology in real time. If you look at an example of another trade that we have
[23:42] here, once again, sellers are in control here. We failed to make a change of are still in control. Over this area, we had a confirmed change of character the lowest point that we went. We had a candle close underneath that area.
[23:56] That's exactly why I was setting up a fair value gap off of those small technicalities. I was literally looking at this candle close with the fair value underneath that low. Liquidity inflection level failed off of here. You
[24:09] push. And this was in that same session where we got that response. Once we have area, I'm now targeting where price is likely to want to go once it breaks through this gap right here into this 15-minute fair value gap right here,
[24:23] which you can see I have my take profit on. Price is underneath the break even even. Price does some back and forth, and you can see tags that level perfectly, gets me out of the trade. You can see I'm celebrating here. And then
[24:36] rebounds. Okay, so just to show you the importance of targeting those high impact areas. This was an example from literally 2 days ago. I have my trend structure here. Bearish move to break the structure. Didn't quite close under
[24:49] necessarily the next full swing move, but what it did do is break out of this impact and then failed off of these highs several times. And on my 1-minute time frame, I had these levels being broken right at the New York open. Maybe
[25:02] a slightly higher risk cuz I didn't have that perfect higher time frame change of trades go wrong, I'm just risking this breaking out for the beginning of the higher, and then I just don't touch that trend until I have full confirmation
[25:15] want to jump in front of that, as long as I have on my lower time frame, my liquidity inflection level right here, I have the change of character underneath produced here. That level being responded perfectly off of. That's where
[25:30] I entered. You got an immediate beautiful move down. The next area on a high impact bullish fair value gap is right at this midpoint here. So I set my partials, and then right here I end up taking the trade off at this fair value
[25:44] good chance it would probably break through this. I just wanted to realize made five or six, which is way outside of the 1:4, so I can kind of be a little take profit. This did end up moving perfectly down into this zone and then
[25:59] responding, but as long as I'm past that 1:4, I'm okay to take profit during this here where I take a position, I have a proper change of character liquidity inflection set up, then prices ends up pushing up against my position, coming
[26:12] up and literally just invalidating my position and closing me out for a full contained loss. Keep in mind, these losses are going to happen a lot of the time, so that plays deeply into the need of the psychology behind the strategy.
[26:24] remember in general in trading, but really specifically for this strategy in general. Happiness literally equals expectation minus reality. If you go expectation, if it's a winner, you're going to be excited that you expected it
[26:40] goes against you, you're going to be sad because your expectation was that the didn't. When you're entering a trade, you're not going in because you think that individual trade is going to work out, but because you know over time this
[26:53] type of framework is going to put you into an advantageous position that if it works out in your favor, you can capitalize on it, and if it does not, you're walking away, and you're going into each trade with literally zero
[27:06] expectation. Your only job as a trader is to literally execute the strategy at hand, collect the data, refine over time, and try to act towards that end goal. And that's really what has taken me my entire career to figure out is it
[27:19] in with that psychology is one of the most number one things to pay attention this, because you are going to be losing a lot of trades. I'll lose four consecutive trades, five consecutive trades, and unless you have conviction
[27:34] you are going to drag yourself into a hole with any trading strategy. But your ability to be able to play, say, the next trade and capitalize on a 6R, and then take another two losses, and then capitalize on a 6R, now you have plus 12
[27:48] or eight trades. So, you're still netting 4R over that period, even though you felt like the only thing you've been doing is taking losses. But you'll never knowing the data, knowing the strategy, and not having expectations on each
[28:02] fully go against you, and capitalizing on them when they do work out. If you structure or any of the strategies, you can watch this playlist right here. Make know in the comments how you like the strategy if you implement it for
[28:16] still here. Let me know in the comments if you like this video. Hopefully it was helpful, but until next time, I will see you all in the next one.



⚡ Saved you 0h 28m reading this? Transcribe any YouTube video for free — no signup needed.