
Why Most Traders Lose Money (It's Not What You Think)
42sChallenges common beliefs and reveals a frustrating truth about trading complexity, sparking curiosity and engagement.
▶ Play Clip"Delivers a solid, actionable framework for price action trading, though the title's promise of 'ridiculously simple' is slightly oversold by the detailed multi-step process."
The video argues that trading success comes from simplifying chart analysis rather than adding more indicators. The creator shares a three-key framework—direction, confirmation, and invalidation—based on market structure and price action, and demonstrates a one-minute entry model for precise trade execution.
Retail traders lose money because they seek new indicators or more analysis, but profitable traders stop predicting and start reading the market with simple understanding.
Chart reading was never complicated; the trading industry buried it under indicators. Stripping back reveals a simple approach if you know what to look at.
Traders often overvalue their analysis due to time invested, leading to repeated losing trades. The creator experienced this and simplified to one line, which led to a profitable trade.
The framework consists of: 1) Direction (trend identification via break of structure and trend lines), 2) Confirmation (waiting for price response at levels, using fair value gaps), and 3) Invalidation (recognizing trend reversal signals like break and retest and change of character).
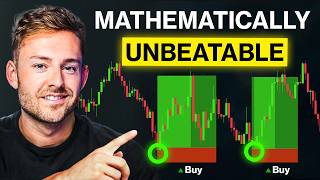
On a 1-minute chart, the entry model uses the New York session open, a change of character, a fair value gap in that direction, and entry in the middle of the gap with risk outside the producing candle, targeting 3-4 times risk.
Success comes from following the overall move, being precise, and executing the same simple, repeatable model over and over, not from a perfect strategy.
The video concludes that mastering price action involves simplifying analysis to market structure and using a repeatable entry model, which allows traders to trade with clarity and avoid guesswork.
What is the sunk cost fallacy in trading?
When traders invest a lot of time or effort into analysis, they give it an elevated sense of value, even if it contradicts their goal of taking successful trades.
02:46
What are the three keys in the trading framework?
Direction, confirmation, and invalidation.
04:02
How is a break of structure defined in an uptrend?
A push up (higher high), followed by a higher low, then a higher high that pushes through the initial push up.
04:45
What is a fair value gap?
A series of three candles where the first candle's high wick (bullish) or low wick (bearish) doesn't overlap with the third candle's wick, leaving a space.
06:05
What is a change of character?
The opposite signal to a break of structure, indicating a potential trend reversal, such as price failing to make a new high and breaking below a previous low.
08:16
What time frames are used for the overall analysis and entry model?
15-minute for the three-key analysis and 1-minute for the entry model.
09:22
What is the entry criteria on the 1-minute chart?
Wait for the New York session open, a change of character, a fair value gap in that direction, then enter in the middle of the gap with risk outside the producing candle.
09:34
What is the recommended risk-reward ratio for the entry model?
Target 3-4 times the risk.
10:13
Simplicity Over Indicators
Challenges the common belief that more indicators lead to better trading, emphasizing that simplicity is the key to clarity.
00:29Sunk Cost Fallacy in Trading
Explains a psychological trap that causes traders to hold onto losing positions due to over-invested analysis time.
02:46Three-Key Framework
Provides a structured, repeatable method for analyzing market direction, confirmation, and invalidation.
04:02Fair Value Gap Definition
Offers a clear, testable definition of a key price action concept used for entry and level confirmation.
06:05Entry Model Precision
Demonstrates how to combine higher time frame analysis with a lower time frame entry model for high-probability trades.
09:08[00:02] trading becomes ridiculously easy. Most retail traders lose money and think the answer to their problem is finding a new indicator or adding more analysis. I for 9 years and what I realized from every trader that I've watched become
[00:17] profitable, myself included, is that they all eventually came to the same conclusion. They stopped trying to guess and predict where the market's going to go and started reading it with a simple understanding. And this next part should
[00:29] make you sort of frustrated. Reading charts as a trader was never complicated. It only became complicated when the trading industry buried it under a thousand different indicators and over complicated analysis. Strip all
[00:41] of that back and what you're left with is ridiculously simple, but only if you actually understand what to look at. So that's exactly what I'm going to show crystal clear detail exactly how I look at the market, the exact things that I
[00:54] look for before risking a single dollar on a trade, and why once this clicks, good trades are going to become obvious, and bad trades will look well, stupid. able to look at the chart through the lens of an experienced, profitable
[01:07] trader with complete clarity and be able to apply this on your own instead of loop that you may be stuck in. You have your chart open. You have two indicators sell. So you enter a trade and then it immediately moves against you and turns
[01:21] into a loss. So then you try to add another indicator to the chart that more and more to your chart trying to avoid ever taking a loss and the cycle is no framework underneath that decision. So every chart and every trade
[01:36] is just a guess dressed up as analysis because the best traders are not looking at more, they're looking at less but of the right thing. Okay? And before I go Each time you enter a trade, you're fully accepting that the market can move
[01:49] against you and that you could lose that trade. That doesn't make the trade strategy that you trust to know that that loss is simply opportunity cost for model that you know will give you a result over time. Because there's not
[02:04] one magical indicator or way of looking at the market that is going to fix all of your losses and prevent any losses. If you're chasing after that, I promise you it doesn't exist. A simple trading strategy means it is repeatable. It
[02:16] that the trade is actually worth the risk. And a moment of true clarity for me around this concept was watching myself become so wrapped up in analysis develop to the point where I would keep executing losing trades with that
[02:31] analysis and wondering why it kept going against me. And I was determined to keep trades made sense, but because I had invested so much time doing the analysis framework. Okay, this is a mental phenomenon called the sunken cost
[02:46] fallacy. And it's basically when we invest a lot of time or effort into something, we give it an elevated sense of value even though it can be completely contradictory to our actual goal, which is to take successful
[02:58] back, removed everything off of my chart, and drew one simple line, which told me I was trading in the complete opposite direction to what made sense. I then placed a simple trade following that piece of analysis, it took me
[03:11] seconds to make a decision on, and lo and behold, it went full profit. And there's a clear message in this. Simplicity is key. And by adding simple markups of the actual market structure rather than relying on indicators and
[03:23] signals, I could see with clarity which direction I wanted to trade in and where my trade opportunities were. And it wasn't because of some new indicator problems. Because as traders, it's important to remember what we're
[03:35] actually trying to look at. Because all a chart is is a visual representation of mass human psychology showing us when the buyers are in control, when the are points on the market where we're close to either confirming the buyers
[03:48] are in control or indicating that these sellers may become in control. And that information was always there. But before I wasn't even able to see that with all indicators that I had all over my chart. So there are three simple keys that I
[04:02] market is going and where my entry points can be. So, what does that simple framework look like? Well, it's made of three things. First thing is direction. Anytime I'm looking at a chart, I want to zoom out, look at the whole picture
[04:15] trend. Most traders are looking at the chart as random moves up and down, and up in the market and every tick down in the market. But here's what's actually actually see where the buyers are stepping in, where the sellers are
[04:30] stepping in, and then predict areas where the buyers are likely to step back step back in. And the first thing that I'm doing to find a trend is waiting for case, I'll show you an example of markets moving up. What we want to see
[04:45] first is a push up, which is a higher high, followed by a higher low and then higher high is produced, this creates something called a break of structure, which is when price passes and pushes up through the initial push up. Okay. The
[04:58] second thing that I'm doing is drawing a trend line from the first low to that structure. And that confirms the direction of the market and where buyers are likely to step back in if the trend is going to continue. And the same is
[05:11] get an initial push down, a lower high, a new lower low, which marks our break of structure. We establish our trend line. And once again, anticipate where that trend is going to continue. Which brings me to the second key, which is
[05:26] confirmation. Now, we want to make sure that we're confirming levels, not predicting levels. Buying in because you think price is going to bounce at a call catching the falling knife versus waiting for the market to start to turn
[05:39] around, respect key levels that validate your overall idea, and then placing trades on a confirmation. Once we have our trend direction, our break of structures, and the lower level of our trend, we can now wait for a response
[05:52] and use that as an indication that buyers may be able to step back in. And advantage of that if the move is going to continue. We're following the trend direction. Okay? There's a saying in trading, the trend is your friend. You
[06:05] thing I like to do to confirm these levels is use something called a fair value gap. Simply put, a fair value gap is a series of three candles where the first candle's high wick, in the case of a bullish fair value gap, doesn't
[06:19] overlap with the low wick of the third candle, and that leaves a space between, bearish fair value gap, the first candle's [clears throat] wick low doesn't overlap with the wick high of the third candle, leaving a bearish fair
[06:32] value gap. And why this is important is because it's an area that the fair value determination has yet to be proven because of a momentum move. So therefore, if the momentum is going to carry forward, if it's determined that
[06:45] that's a fair value, price can continue moving off of that level. So having those key levels also agree with a bullish or bearish fair value gap that follows the direction of my trend allows me to find and target potential response
[06:58] areas, only reading simple price action and analysis in no need for an indicator. And I'll also use fair value gaps on an entry model to actually enter you here in a second to be able to find very very particular entries on a lower
[07:11] time frame that matches our higher time frame analysis and allows us to completely avoid any confusion or chop in the market and target high probability areas. Okay, which brings me to my third key which is something
[07:23] called invalidation. So this is basically us having a current trend market is now starting to reflect that these sellers could be in control and this presents a really unique opportunity to us as traders because
[07:36] it's the first sign that the current move could be falling apart. The sellers could be stepping in and that a new trend in the opposite direction that we can catch early could be developing. Say we have a trend developing upward price
[07:48] is responding and then that same level now is broken down below and closed below. This is something called a break and retest. And typically when price is responding off of those buy zones breaks it, when it tests the opposite side of
[08:02] that same level it previously respected, that's often the last point that the opposite direction. And what fully confirms this is something called a change of character, which is effectively the opposite signal to our
[08:16] earlier break of structure. You can see push up over previous high break of structure. Push up previous high over break of structure. Push up break of structure. But then price fails to make a new high. Breaks underneath this
[08:29] previous low. Comes up to test the opposite side of that trend level before continuing to make a move to the downside. Then basically the cycle structure, you can then do the same analysis, look for the same signals and
[08:42] trade in the direction of the market. However, context matters. one single chart isn't the complete answer to being able to take advantage of these moves. This strategy I'm describing to you is really good at finding the overall
[08:55] picture and setting us up to do something called drop into a lower time frame where we're looking at the same data but more zoomed in. And we're using the more zoomedin view to actually set up what's called an entry model. That's
[09:08] entering. The way I think of it is this. If this analysis that I just showed you is our complete route map, showing us our start point and our end destination, the one minute entry model is going to be our turnbyturn directions to get us
[09:22] to our final destination. So, here's the framework of that zoomed-in entry model that I like to pair with this overall analysis method. And I use the 15minute time frame on my chart for that three key concept. And I'm using a 1 minute
[09:34] time frame for this entry model. So on a one minute time frame, the first thing that I'm looking for is the New York session open. That's where volume is thing that I'm looking for is a change of character where price breaks out of
[09:48] the current trend and creates that first initial push up. The second thing that I'm doing is waiting for a fair value gap in the direction of that change of character. And that is going to be the area that I target. The third thing that
[10:00] I'm doing is waiting for price to pull back into that fair value gap. And I'm entering right in the middle of that gap. I'm placing my risk outside of that fair value gap producing candle. And I'm targeting three to four times what I'm
[10:13] risking off my entry to allow the trade to play out in my direction. And the result of this now I have a simple view of the larger picture with key hot spots on my chart and a simple three-step entry criteria to where I can strip back
[10:26] all of my indicators, wait for a response, and place my trades with complete clarity. And the example that I'm referencing here is actually a trade where you can see I marked out these exact levels, executed my entry model,
[10:40] and allowed my trade to run up massively and collect four to five times what I was risking on the trade. Because the biggest thing about reading price action and executing on it is not having some perfect strategy. It's about following
[10:52] the overall move, being precise about your entries, and executing the same simple, repeatable model over and over so that you're not predicting or guessing, but you're simply analyzing with clarity and executing your
[11:05] strategy. So, hop on to Trading View, follow those steps, and you'll have a you're executing. If you're still here, make sure you hit the like button, know when I drop content in the future. You can check out other videos right
[11:19] more detail. And if you want to trade live alongside us every single day and learn all of my strategies through and through, you can check out our private team and education right here. But until next time, guys, I will see you all in
[11:32] next time, guys, I will see you all in the next video.

![How To Start Day Trading As A Beginner In 2025 [Full Tutorial]](https://img.youtube.com/vi/xHU5MHuUSKI/mqdefault.jpg)


⚡ Saved you 0h 11m reading this? Transcribe any YouTube video for free — no signup needed.