

Why Smart Money Sweeps Liquidity
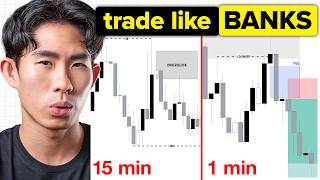
60sExplains a key smart money concept (liquidity sweeps) in a simple, visual way, making it highly educational for aspiring traders.
▶ Play Clip"The title promises a live breakdown of personal trading, which is delivered, but the content is padded with repetitive explanations and a lengthy call to action."
This live trading session provides an in-depth, real-time breakdown of how the host analyzes currency pairs, specifically EUR/USD and gold, using a top-down market mechanics approach. The video demonstrates how to determine trade bias, identify market structure, and apply entry models based on price action and liquidity concepts.
The host begins a live trading session, promising to analyze currency pairs on his watch list in real-time, sharing his trade bias and thoughts on price movements over the next few hours and days.
The host explains his top-down analysis method: starting from higher time frames to determine market structure and trend direction, then moving to lower time frames to identify entry points.
On the daily time frame, he maps out obvious breaks of structure (BOS) to determine that buyers are in control, identifying the swing range between 1.208 and 1.144.
The higher time frame analysis concludes that the market structure is bullish, with buyers in control, and identifies the swing range for focus.
On the 4-hour time frame, he identifies a potential market shift or liquidity sweep, emphasizing the need for confirmation via a break of structure.
He explains how to identify the internal range and point of interest on the 4-hour chart, noting the internal structure has shifted from bearish to bullish.
He distinguishes between the first layer of internal structure (4-hour swing high/low) and the second layer (micro internal breaks), advising to map them layer by layer.
He emphasizes building a narrative about price objectives, noting that price pulled back, swept liquidity, and broke structure to shift internal structure bullish.
He explains the uncertainty between a market shift and a liquidity sweep, noting that confirmation requires a break of structure with follow-through.
He uses the 4-hour time frame to gauge whether the daily bullish bias is valid, noting it depends on price action at key levels.
He maps out extreme and nearer demand zones, using the Fibonacci tool to show price is in premium, expecting a pullback to discount zones.
He advises not to look for longs until price reaches a demand zone, as entering in the middle of nowhere is not ideal.
He explains that when price reaches a point of interest, traders should drop to lower time frames to look for entry models (e.g., market shift, liquidity sweep) for confirmation.
He shows how a day trader or scalper might trade counter-trend, shorting the pullback to a supply zone, using the same principles.
He explains fractal market shifts, which allow seeing lower time frame shifts without dropping down, and emphasizes the law of fractality.
He maps out supply zones for potential shorts, noting that the most extreme supply zone is higher probability for a reversal.
He asks which supply zone (A, B, or C) price is most likely to move to, noting it's a game of probabilities, not certainty.
He identifies a fractal market shift indicating a potential bullish pullback, but requires a break of structure for validation.
He maps out demand zones and flip zones, explaining that price may react to these to fuel a move up, but it's uncertain which one will hold.
He explains that entry models require a market shift and a liquidity shift, and shows how to identify the last fractal lower high for a fractal market shift.
He contrasts aggressive entry (entering on point of interest mitigation without market shift) with conservative entry (waiting for fractal market shift and liquidity sweep).
He emphasizes that trading style depends on market conditions, personality, and risk tolerance, and shows multiple ways to approach the same setup.
He speed-runs the top-down analysis for gold, identifying swing high/low, internal structure, and noting a potential liquidity sweep below a low.
He identifies a market shift on gold's 4-hour chart, with internal structure shifting bearish, but notes the lack of follow-through as a concern.
He emphasizes developing a trade idea with the highest probability, not certainty, and asks viewers to decide buy, sell, or wait.
He explains that a valid bearish market shift requires a candlestick closure below a low, not just a wick break, to confirm follow-through.
He uses liquidity, point of interest, and order blocks to analyze gold, noting a double bottom and liquidity sweep below equal lows.
He stresses perceiving the objective reality of price rather than subjective bias, noting that despite bearish signals, buyers may be in control.
He identifies a fractal market shift on gold, confirming a shift in structure, and maps out demand zones for potential longs.
He asks viewers to determine who controls price (buyers or sellers), concluding that technically buyers are in control due to the fractal market shift and liquidity sweep.
He advises day traders to drop to the 5-minute time frame for entry models when price reaches a point of interest, looking for fractal market shift and liquidity sweep.
He explains setting take profit at the next point of interest (supply zone) and stop loss below the point of interest that invalidates the trade idea.
He advises not to target the 'final boss' (extreme supply zone) immediately, but to take profits at nearer points of interest first.
He answers a question about entering without waiting for demand zone mitigation, explaining that entry models provide confirmation for execution.
He explains that scalpers or intraday traders may use the second layer of internal structure for immediate bias, depending on their objective.
He emphasizes that every concept is a piece of the puzzle, and traders should gather as many pieces as possible to make informed decisions.
He concludes by asking viewers to share his free 33-day Market Mechanics Mentorship with friends and family, and encourages them to continue the process.
The video provides a comprehensive, real-time demonstration of a top-down market mechanics approach to trading, emphasizing the importance of objective analysis, layered structure, and entry model confirmation. It concludes with a call to action for viewers to share the free mentorship program.
What is the first step in top-down analysis?
Analyze the higher time frame to determine market structure and trend direction.
01:51
What does a break of structure (BOS) indicate?
It indicates a shift in market structure, showing who is in control (buyers or sellers).
02:17
What is the difference between a market shift and a liquidity sweep?
A market shift is confirmed by a break of structure with follow-through, while a liquidity sweep is a false break that reverses.
09:34
What are the two criteria for an entry model?
A market shift and a liquidity shift.
28:05
What is a fractal market shift?
A market shift on a lower time frame that can be identified on a higher time frame without dropping down.
17:28
What is the 'objective reality' of price?
The actual price action and market conditions, as opposed to subjective bias or perception.
44:25
What is the recommended approach for setting take profit?
Place take profit at the next point of interest (supply zone) where price is most likely to move to next.
47:28
Top-Down Analysis
Establishes the core methodology for analyzing charts from higher to lower time frames.
01:51Market Shift vs. Liquidity Sweep
Clarifies a common confusion in trading, emphasizing the need for confirmation.
09:34Fractal Market Shifts
Introduces a powerful concept for identifying lower time frame shifts without dropping down.
17:28Objective vs. Subjective Analysis
Highlights a key psychological pitfall for traders and the importance of objective analysis.
44:25Puzzle Pieces of Analysis
Emphasizes the importance of gathering multiple pieces of evidence to form a well-informed bias.
51:51[00:03] trading session. I hope you guys are doing well. I hope you guys had a great trading month so far. I see a lot of new faces in here. So, before we start, I'm live trading session with me looks like. Usually, what I'm going to be doing is
[00:16] and then what I'm going to do is that I'm going to be going through the currency pairs that's on my watch list, just analyzing it live in front of you guys, and also give you my thoughts, my trade bias, and pretty much what I think
[00:30] price would do over the next few hours, over the next few days, right? So, you can literally see me apply market mechanics in real-time, in live market conditions, right? So, yeah, that's pretty much what the live trading
[00:42] need you guys to lock in, right? So, for the next one hour, all set aside all distractions, just focus on what I'm about to say, and just make sure that you really try to digest what I'm about to do, right? On the charts in front of
[00:57] that I'm going to just going to take my time to break down uh EUR/USD, right? time to break down uh EUR/USD, right? How I analyze it from top to bottom, and what I think price would do, what I believe price is going to move towards
[01:10] like I said, I need you guys to focus, right? I need you guys to lock in, right? So, just look at the chart, right? Focus on what I'm sharing right here for the next one hour or so, and hopefully by the end of it you'll have
[01:22] extreme clarity in terms of how I analyze the charts. go, right? Just let me know that in the chat, locked in, right? Just type locked me to start. Locked in? Are we locked in?
[01:37] Locked in, let's go, let's go, baby. Okay, cool. Uh let's get started, right? usual, right? And throughout this live trading interactive as possible, which means I'm going to ask you guys certain questions,
[01:51] so make sure you pay attention. All right, so, first of all, we got EUR/USD, that I'm always going to start off by doing my top-down analysis, which means I'm analyzing the charts from a higher time frame down to the lower time frame,
[02:03] so that I can actually determine my trade bias, and I can decide exactly where and when to buy or sell. Right? So, I do that by analyzing the market structure and identify the trend direction on my higher time frame. So,
[02:17] time frame itself, right? So, that's the first thing I do. I like to come in here. Let me just get rid of everything, and I can start from square one. Right? So, I like to just map out like, you know, all the most obvious break of
[02:29] structure, right? Obvious break of structure right here. Boom, boom, boom. tell us that right now the buyers are in control of price because right now the next thing is that you want to identify the swing range, which is where
[02:42] you want to focus on, right? There's a lot of noise going on right here. There's a lot of random candlesticks right here, which you don't want to care doing in the past. You want to care about what price is doing right now in
[02:54] moment. So, this is where you want to identify the most recent swing range, right? And you can see this is the most recent break of structure, which means this is the most recent swing low, and this is the most recent swing high.
[03:07] so far, right? Because I believe everybody on this call should be very well versed with market structure, even the beginners as well, right? Uh by the the swing low, and we know that this right here is the range that we are
[03:20] trading within right now. So, ideally, I only want to focus on the price action only want to focus on the price action that happens within this 1.208 to 1.144 area, right? But, the thing is this is a pretty large range to focus on, right? I
[03:34] want to further refine that zone so that I can actually uh invest my time, tighter range. This is where it's important for you to go down one time the higher time frame. We have determined that the market structure is
[03:48] determined that the market structure is bullish. The swing range is this high range that we're trading within right now. Buyers are in control of price. So, That's all I do on the higher time frame, right? That's it. Higher time
[04:01] frame, only objective is to determine the market structure, understand who is in control of price, buyers or sellers, and to identify the trend direction. then once that is done, then you move down to the
[04:15] medium time frame itself. Right? So, this right here is a market shift if we get a follow through, right? So, this right here, where we get a candlestick closure below the low right here, this could either be
[04:28] right? That's another thing I forgot to mention to you guys. If it's a liquidity sweep, then what must happen is that after price comes down to go this low, shift, and then internal structure will remain bullish. If it's a market shift,
[04:42] later on come down here and take out this weak low, structure, which means sellers are in control of price. Okay, so at this moment, right? Judging by the current price
[04:55] we got a candlestick closing below this low, so we can assume that it is a market shift, but we cannot confirm that it's a market shift until price comes down and take out this low right here. Okay, so it's not really like a
[05:09] confirmed market shift, right? If you're applying the mechanical rule, then yes, by definition it is a market shift, but it's not validated yet. Okay? So, next which is the 4-hour time frame, and this is where you want to really identify the
[05:23] internal range and also your point of interest. Okay, so this is where you try to find out the location in which you're entering the trade from. 4-hour time frame, you can see what we have right here. This is your structure
[05:35] being formed right here as well, right? This is the internal structure that we we are just zooming in, just looking at price using a microscope, and we saw creating lower highs, lower lows, lower highs, lower highs, lower lows. All of
[05:50] this is what? Your internal break of structure. Right? So, you can actually break of structure, internal break of structure. And then, if you keep on conclusion that recently we actually did have a market shift where price went up
[06:04] there and take out the last strong lower high, which tell us that, you know what? structure, right? Which means that the internal structure has shifted from bearish to bullish. Okay? So, right now,
[06:18] internal structure is bullish. That's the story of the market right now. Okay? So, internal structure is bullish. This is where we can also try to identify our internal low, right? Which is the lowest point that led to the market shift, and
[06:31] your internal high, which is this high right here. Right? This high right here. Um yeah, this is the internal high, this Or if you want, you can also call this the 4-hour swing high and a 4-hour swing
[06:44] low. Now, within this high and this low, that is your second layer of internal structure, right? Because what we have pulls back, goes up, pulls back, goes up, pulls back, right? So, all of this
[06:56] is also internal's sort of like internal internal structure. And I think this is Right? A lot of people get confused is because they treat this first layer of internal structure exactly the same as the second layer of
[07:11] the internal internal structure, right? And that is why it's so important for both, right? So, that's why I always advise you guys to do layer by layer. So, once you go down to one time frame, you just go and map out like the most
[07:24] obvious internal break of structure first, and then whatever that's in structure like this, this is your second layer of internal break of structure. Okay? So, that's the second layer of the internal break of structure itself.
[07:38] Right? So, if you look at the first layer of internal structure, this is the range internal high. Right? So, this is the entire daily internal range, but it's also the 4-hour swing range. Right? It's also the 4-hour swing high and
[07:53] And then within this 4-hour swing high and 4-hour swing low, then you got all here that's going on right here. This is the second layer of internal structure. everybody understand what I just said
[08:07] internal structure? Right? Just let me know down in the chat, yes or no. Right? on. Okay, so internal structure within that bigger internal structure that is your micro
[08:23] And it's important for you to differentiate both, so you do not mistake the internal internal break of structure as the macro internal break of Right? So, that's the first thing you guys must understand. Okay, so once we
[08:37] guys must understand. Okay, so once we are done with that, then this is where if you're looking at a 4-hour swing range just by itself, story? Right? You want to build a narrative. You want to try to determine
[08:51] what is the objective of price. Well, we know that price has made a pullback, came all the way down here to this swing low right here, and then perhaps it gave down and take out this low. Perhaps there was so much buyers in the market,
[09:06] momentum in the market that allowed price to move all the way up here and take out the last lower high, giving us a market shift which allows the internal structure, the first layer of internal structure, to shift from bearish to
[09:20] structure, to shift from bearish to bullish. is technically bullish because we got a market shift to the upside which over.
[09:34] Now, here's This is gets a little bit tricky. Right? Remember earlier on just time frame, on the daily time frame, we talk about how this could either be a Like this line right here. Because right now price is in the middle
[09:48] we don't know for sure because we know for a fact that if price comes down take out this low, this becomes a valid market shift, which means that the entire swing structure has shifted from bullish to bearish.
[10:05] take out this low. But that has not happened yet. So we valid market shift because there is a lack of follow-through. sweep where price came down sweep the liquidity below this low and then push
[10:20] Right? So in this case, what happened was that smart money came available liquidity below this low, and it caused price to go up there, break internal structure to shift from bearish to bullish,
[10:35] now. Okay, so ideally what I want to see is for price to pull back and then later on come up there take out this strong high, no, this weak high, giving us another internal break of structure to validate
[10:50] this market shift, to confirm that market shift, for me to really know for sweep for the buyers to take control of price, for price to continue shifting bullish on a swing structure.
[11:05] see, right? If this is a liquidity sweep. Right? But because right now price is in the middle of nowhere, he's not taken out this high, he's not taken out this low, I don't know for sure whether, you know, this is a market
[11:18] shift or it's just a liquidity sweep. Okay, so it all comes down to the do next. So that's what I'm using the four hour medium time frame me kind of gauge like, okay, what's going on here? Right? Is it
[11:33] really true that okay, price is actually bullish because the daily time frame say so? Well, it depends, right? It really depends. got a market shift. This is the swing range that we have mapped out right
[11:45] here. And ideally, what I want to see is like I said, price pull back and then go bullish, and price comes down take out this low if it's bearish. like just go and map out the point of interest in which we are expecting price
[12:01] to move toward next. Right? So, in this case, this is where you can come in extreme. Right? So, you draw your extreme zone right here, and then you draw your another uh nearer demand zone right here, and then you continue
[12:14] until you get to where price is at right now. Okay, so introducing another tool, you drag it from a swing low to the swing high, and this is where you can see that price is still quite high up in the premium pricing, which means
[12:28] pull back to. Right? Chances are price will be gravitating towards one of these three demand zones that we have mapped out right here in the discount range because that's where there is more fuel for the market to continue bullish.
[12:42] If it wants to continue bullish. So, in this case, that's where we are expecting price to move toward next. Okay? This is where price is at right now. We are expecting price to move toward to either one of these gas
[12:55] that it can grab more fuel and it can continue bullish. continue bullish. So, this also means until price reach here, you should not be looking for longs.
[13:10] You should not be looking for longs. Okay? Remember just now on the daily buying, right? But just because we should enter for a buy doesn't mean we should enter for a buy right now.
[13:24] station, right? Where there is fuel, where the car can get enough fuel for it for a buy when price is in the middle of nowhere. So, in this case, I'm not doing anything right here. I'm not looking for longs here. If anything, I should be
[13:38] looking for shorts because I'm expecting price to come down here. short. Okay? Whether I want to look for short or not, that that depends on what price does in the 1-hour time frame and a 15-minute time frame, which I'm going
[13:51] to go through next. Okay, but for now, just to give you guys like a bias in terms of like a swing trader who want to trade with the higher time frame trend direction, the daily time frame trend direction, the guy who
[14:04] looking for longs until price reach either one of these point of interest in do? Right? Let me know that in the chat. traders who have went through like the causes. When price gets down to your
[14:19] point of interest, what do you do before you actually enter for the trade? Okay, wait for flip zone, right? There's a mix of answer right now. Right, go to lower time frame look for entry model. Good. Right, so this is really where um the
[14:33] to answer this question, right? Because they go through the causes, they understand what you're supposed to do at each stage. Uh and this is where they will know that if price comes down to our medium time frame point of interest,
[14:45] we jump down to the lower time frame to look for our entry model. combination of, you know, we got multiple entry models, right? Entry right? That is the entry confirmation that you
[14:59] want to look for once price get down to a point of interest. And then when it you look get your confirmation, you get your trigger, you get you check off your checklist, then you enter for the trade. Right? So, yeah.
[15:12] Those is That's how I will approach price if I want to look for longs. Okay, so if I want to look for longs, that's how I'm going to be approaching come down to either one of these point of interest right here,
[15:25] get my entry confirmation, get my entry model, then I look for longs. Then I look for longs. Okay, so that's if you're looking for longs. That's what you should do. Now, what I'm going to do right now is that I'm going to show you
[15:40] how I will approach this price action in the eyes of a day trader or even a scalper who is trying to catch the current move. Right, who's trying to trade what price is doing right now. Because like I mentioned earlier,
[15:52] if you look at the internal structure, price is actually bearish right now. And if we know for a fact that price is going to come down here, then it's going to go up, why not short it all the way down here?
[16:07] trade this. I'm going to trade this counter trend. How do I go about doing it? Well, let's get into it. Well, let's get into it. So, right now, this is the 4-hour range.
[16:20] swing range. This is the first layer of the internal structure on the daily time frame. The second layer of the internal structure on the daily time frame is like all these micro moves that we have within
[16:34] this entire range. Understand that price is fractal, okay? As above, so below. As below, so above. Right? So, that is the law of frac- the
[16:47] nature of like fractality, if that's even a word. Right? So, this means that over here, what we have was price goes up, pulls back. Okay, this is a internal all of those tiny little break of structure right here. And if you do that
[17:02] eventually, you will be able to figure out where is the most recent internal range. Okay, so once again, you do it step by step, right? You remember all of these tiny little internal break of structure in here.
[17:15] here, what happens the price came down, take out the last internal structure right here, giving us a market shift. Okay, giving us a market shift right here. Now, this market shift occurred on the
[17:28] 1-hour time frame, but on the 4-hour time frame, this is actually our fractal market shift. Once again, this is why we use fractal market shift is so that we can identify that there is a market shift on the lower time frame without
[17:41] actually going down to the lower time frame. So, that's another misconception when it comes to the fractal structure. Fractal structure doesn't mean that the lower internal lower time frame structure has
[17:54] like shifted. No, fractal structure just allow us to see what is going on on the down to the lower time frame. So, in shift just like this, I know for a fact that on the 1-hour time frame, internal
[18:08] structure has shifted from bullish to bearish. Let's see whether that's true. Well, it is true, right? Because this is the last was that we got a proper market shift right here.
[18:20] right here. Okay, so, uh once again, you can see it more clearly right now on the 1-hour time frame that all of this is what? Your second layer of internal structure, right? All of these little move that we
[18:32] have right here. And if you want to get a little bit more complicated you will realize that within this internal structure, there is a third here, right? All of this is like micro micro internal structure, right? But
[18:47] too ahead of ourselves right now, right? Let's just focus on the second layer. right? You can see all of this internal structure, internal structure, internal structure right here. Boom, later on we got another market shift right here, but
[19:01] this market shift is just for price to pull back to the last internal lower supply right here, and then later on came down here, and then this is where just get start to map this out properly first,
[19:16] okay? Internal structure right here. And then, later on price came down, give us a fractal market shift right here, or even like this one right here. right? Internal break of structure, internal break of structure. And then,
[19:30] this is where you came to a conclusion that this right here is the 4-hour internal range, which is also our 1-hour swing range right here, right? And this is the area in which we are trading within right now. So, right now, your
[19:45] is to try to look for shorts, right? come down here. Okay? We know that price is going to might be, where do you want to be looking for shorts, right? So, you do
[19:58] the exact same thing, right? Try to map out point of interest, try to make sense as to where price will move to it next. Okay, so in this case, I'm looking for shorts. I want to enter for a sell at supply zones, right? So, this is where
[20:11] you try to map out where are the supply zones. Okay, you always go from the extreme, this is the last internal break of structure right here. This is my supply right here. And then, there is another one quite subtle right here. I
[20:26] don't really like this this this is a very fractal supply zone, which means is most likely going to blast right through it, but I'm just going to map that out, right? Just just for for for your sake. So, in this
[20:39] case right here, this is where price is at right now, okay? This is at where price is at right now. And over here, right? That's the question you always want to be asking. What is price
[20:54] fundamentally doing right now? What is the objective of price? So, we know that price is gravitating toward this supply zone or this supply zone, and then shifting bearish. Okay? So, once again, you know what? Let
[21:09] me just be a little bit more precise and just map out like this supply zone that we have right here as well. Okay? So, just so I can I don't miss anything right here. So, anyways, we know that price is going
[21:21] supply zone and then start shifting bearish. Okay? But, what we don't know is which supply zone price is going to move toward next. It could move toward this one and then
[21:34] this one start going down. It could move toward this one and then start going down. So, in this example that you can see on the screen right now. Which point of interest do you think
[21:48] price is most likely going to move toward next before it starts reverse and head back down? Zone A, zone B, or zone C? Let me know down in the chat. Which zone do you guys think price is going to move
[22:01] Once again, we don't know for sure. All we can do is to like just develop sort of like a hypothesis, right? To just develop like a theory as to we don't know for sure. It could be any one of these three supply zones right
[22:16] one of these three supply zones right here. my more advanced students inside 1% club is saying A, right? Because they know
[22:28] for a fact that the more extreme zone is much more high probability. Okay? It's much more high probability. Because price has to hold at this zone for it to remain bearish. If price take out this supply zone, what happen? We
[22:41] last lower high. Price take out that supply zone, we got a market shift, and shifting bullish. So, price is most likely not going to take out that high itself. So, in this case itself,
[22:56] you don't know for sure where price is moving toward next, but in terms of this zone much more stronger than this extreme zone. Okay, like I said, it's all a game of
[23:12] It's not a game of certainty, just a game of probabilities. Right, so in this all we are trying to gauge is that, "Hey, price can move up to either of there is enough liquidity, if there's enough fuel."
[23:27] But, out of all of these zones, this one has the highest chance of holding. statement that comes to mind right now. So, in this case,
[23:40] likely going to move to what? This area right here. Okay, so once again, here's where it gets a little bit nuance, right? If you look at this swing high and swing low, and you look at a fractal structure
[23:53] that we have right here, right, look at the fractal structure right now. Okay, look at the fractal structure. If you look at the fractal structure, you realize that what we have was a fractal market shift.
[24:07] fractal market shift. This fractal market shift could indicate that right now the internal structure, the third layer of the internal structure right now, is shifting bullish to facilitate the pullback to this zone
[24:24] to facilitate the pullback to this zone right now. Okay? Right that. internal structure could potentially be shifting bullish.
[24:40] said that, you know, if you're a day trader or you're scalper, you should be But, once again, what is price doing right now? Is price going down now? Or is price going up now?
[24:55] That's the immediate bias. That's the internal order flow. That's what price trader and you're a scalper today, you should be trading with that with that Right? So, in this case, we got a fractal market
[25:08] confirmation that price is going to start pulling back, but it's just an indicator. It's just a signal that price might start pulling back and start shifting bullish right now. In order for us to validate this market
[25:21] shift, remember, just now like I said, we need that that in that break of structure, right? We need the price come up here, take out this high here, then internal break of structure right here. Buyers has took back control of price
[25:34] from the sellers. Demand has exceeded supply. Right now, going to go up here." Okay, so if I want to, you know, trade this move, trade this pullback, ideally, I want to get an internal break of
[25:47] fractal market shift, then I can maybe play the pullback right here, buy at a higher low, and trade it all the way up to this extreme supply zone that we have up here. Okay, so that's
[26:01] you're trying to look for shorts, ideally, you should be looking for short at this area right here. Okay, at this extreme supply zone right here.
[26:14] again, let's map out the point of interest that led to this fractal market shift. This is the extreme demand zone over here. right here. And then there's maybe like another demand zone right here.
[26:30] And then there's potentially another this is the flip last ship zone because price reacted from this flip supply zone right here, creating a fake reaction that swept liquidity, so this becomes
[26:43] a little bit more advanced for the people who don't know what that is, the courses, you will learn what that is. Right, so in this case, we've got a flip loss zip zone, you've got the other this like normal flip zone or demand
[26:57] extreme zone. Right, so in this case price want to go up here, right, to give us the internal break of structure over here like like what I mentioned to validate this market shift, what must
[27:11] buying momentum at either one of these zone for price to move up. Either one, right, either one. So, once again, how do we know which going to cause price to go up? We don't
[27:26] know for sure. All we can do is to just observe and react accordingly. We don't want to assume, we don't want to anticipate, we just want to react accordingly. So, in this case, if I'm looking for longs
[27:38] here, right, because I'm a little bit more aggressive, I don't want to wait validate this market shift, I just want to enter for longs right now. Maybe because I saw a fractal market shift right here, I saw another fractal break
[27:51] thinking that price is going to shift bullish and I'll look for longs. Right, this point in time, you can look for longs at either one of these point of given the fact that your entry model present itself at either one of these
[28:05] point of interest. Okay, so we don't know for sure which zone price is going to respect and then go up. zones right here. So, if I'm looking for longs, like I
[28:18] right? So, my entry model all of those entry models have two criteria, and that is a market shift and a liquidity shift, right? Market shift confirm a shift in structure, liquidity
[28:32] shift confirm a shift in internal order flow, right? Confirm that price has right? So, in this case, where is the last fractal lower high for us to know that there's going to be a fractal market
[28:47] shift. Right, so in this case price goes down, lower high, lower low, lower high, lower low, lower high, lower low, lower high. Okay, so this becomes the most recent fractal lower high, which means that for a fractal market shift occur,
[28:59] So the bare minimum, if I want to look for longs today, right, I want to see price take out this last fractal low, give me as a fractal market shift, and then also sweep liquidity. Right, that's where I'm asking myself,
[29:13] where is the available liquidity? Right, so you look towards the left-hand side, liquidity sitting below these lows right here. And perhaps price is sweeping the liquidity below this low, using it to
[29:25] fuel price up. Take out this low, give me as a fractal market shift, and then we go uh bullish, and then right now we can potentially look for longs. That is our entry model, right? But in this case,
[29:37] in this case right here, price has came down, mitigate the flip that swept zone, swept liquidity below this low right here. if you enter for a buy position right now, you are using the aggressive
[29:51] version of the entry model, which states that you should enter right of interest mitigation without the market shift. So you're entering for longs right now is correct if you are using the
[30:04] aggressive version of the entry model. If you are using the conservative version of the entry model, then, like I said, you want to wait for your fractal price take out this low, last lower high
[30:16] you got a fractal market shift, right now price is going to shift bullish, and longs if you see price falling back to your point of interest that created a
[30:28] fractal market shift. Okay, so once again, is everybody still percentage of that do you guys understand? Like 100%, 50%, 75%? Just let me know, right? Because I spent the past 34 minutes breaking
[30:44] just went through this in like 5 minutes. Right? Because I'm very well versed, I'm very familiar with how to apply these concepts in real time by now. Right? So, at this point in time, I'm just like
[30:57] hey, I can analyze this in 5 minutes. But I don't want to be doing that in lot of you guys don't even understand how to identify liquidity. So, I want to meet you at where you at. Right? So, yeah. I already tried my best to really
[31:11] yeah. I already tried my best to really like just break this down right here. To just show you guys the different perspective to approach price. that there is no one-size-fits-all approach. It all depends on the
[31:26] condition of the market. It all depends on your entry, your your trading style. tolerance, it depends on your personality. I have pretty much show you like the multiple ways to approach this situation
[31:40] right here. You can look for longs. If you're a day trader and a scalper, if I look for longs. If you want to look for shorts as a day trader or scalper, to come up to this area, then you do the exact same sort of like pattern which is
[31:55] zoom down to your lower time frame, look for your entry model when price mitigate this zone. And as a swing trader, you can look for when price comes down to either one of these point of interest right here and
[32:08] you that hey, structure is shifting bullish, and then we are going to the upside. Right? So, that's how you would fundamentally approach price from the eyes of a day trader, eyes of a swing
[32:23] a scalper. Yeah, and eyes of a scalper right here. Okay, so, uh entry model number three right now, entry model number two. version of entry model number one or two. Yeah, this will be the aggressive
[32:39] two. Yeah, this will be the aggressive version of entry mode number one or two. Now, do you guys want me to spend another 30
[32:51] minutes breaking down one more currency pair or break down like two pairs? Right? Just let me know down in the chat, one or two.
[33:06] right? Just give you guys the different analysis. Two, I can do it like really analysis. Two, I can do it like really kind of fast. because a lot of people are requesting gold.
[33:19] okay, so once again, there's a very mixed answer right here. Okay, there's this there's a mixed sort of answer here. I'm right? I'm going to go through gold and then if you have time, we will go to
[33:33] another currency pair, all right? Okay, so let me just try to erase everything right here. Okay, so because I've went through super duper in-depth on EU, I'm not going to repeat the same sort of like
[33:46] in-depthness on gold. I'm just going to like speed run the parts where you guys already understand like the top-down analysis and just give you guys like a high-level idea of like what to look for, all right?
[34:00] Okay, so in this case itself, this is the most recent break of structure, right? Swing low, swing high. First step, swing low, swing high, that's it.
[34:13] Now, within this swing high and swing low, what do we have? We got your So, if I'm looking at the internal break of structure, I can see that, hey, this is the internal break of structure and then this right here is also a
[34:27] internal break of structure. So, swing low, swing high. Internal high internal low. Where's the internal low? I mean, let me know down in the chat. Where is the internal low? Is this the
[34:42] internal low or this the internal low or this one right here? 1 2 3. Which one is here? Swing low, swing high, internal high.
[34:54] Where's the internal low? So, the internal low is situated at the most recent internal break of structure. So, where is the most internal break of structure? This is a swing break of structure.
[35:10] This is the most recent internal break of structure, which means that by definition, this is the low that led to this internal break of structure. So, by definition, this is the most recent internal low.
[35:23] Okay, so internal low is situated at number one right here. Okay, so this is All right, so let's get rid of all of those markings right here. And I will mark that up as my internal
[35:36] low. Okay, so this becomes my internal low. Right, so if you look at the price action right here, internal low, internal high. Right, so we are playing within this internal range technically
[35:49] Okay, it just so happens that our internal high is also at our swing high as well. So, that's pretty cool. Uh and once again, right, we know that price is bullish on a swing structure, but that doesn't mean that price is
[36:02] difference between the swing structure and the internal structure, which is So, if you look at our 4-hour time frame, you'll see that, hey, we got price uh coming down, take out this last internal low, but once again, we don't
[36:17] liquidity sweep because there's no follow-through. Price is not taking out low, market shift. Price did not take out this low. Instead, price got there to get this high. Liquidity sweep, right?
[36:30] Just for price to shift bullish. And if you look out at the internal structure, you will see that, hey, we got price actually going up there, taking out the last internal break of structure, the second day of the
[36:42] Taking out the last internal lower high, giving us a market shift. Okay, so this tell us that right here, this becomes our new internal low. And this becomes our internal high. But
[36:59] within this market shift itself, there is your internal break of structure And then there's another internal break of structure over here. Right? So I'm just going to rub that. And then this becomes the most recent internal
[37:14] low and internal high. Right, later on price came down here, take out the last internal low, giving us a market shift, which tell us that internal structure has shifted bearish. Right, so internal structure is bearish right now.
[37:29] doing right now. Okay, so let's continue tracing where price is at. This is the last internal high. This is the last internal low. And yeah, I guess that's where price is at right now, right? It's within this
[37:43] internal range right here. And within this internal high, internal low, there is your further on like this like micro second layer sort of like internal structures that we have going on in here. Okay?
[37:56] Like if you map that out, you will be able to find out what is the second layer of the internal structure doing right now. hey, let me just try to map that out for you
[38:08] guys. Uh price comes up here. This is the last fractal market shift. then we got a fractal break of structure. And then we got another got a fractal market shift, and then another
[38:24] fractal break of structural. And then, this is the low. This is the high. Uh this is the low. This is the high internal range that we're trading within right now.
[38:37] If you go down like one step even further, right, you will see that within this there is also a micro sort of like internal break of structure, which we're just going to like make things more complicated than it
[38:49] you can find out, "Hey, this is the range that we're trading within right range that we're trading within right now. This low and this high right here." So, just by looking at this right here, let me know what will you guys do. Will
[39:02] you guys enter for a buy or enter for a sell right now? Or wait, you know, those are the three options. Buy, sell, or wait.
[39:22] your analysis because when you do your analysis, you do your preparation, you do your research, this is where you will be able to develop the trade ideal
[39:34] where it has the highest probability of working out. Once again, not certainly, but like highest probability of working out. Okay, so in this case, let's look at what price is doing right now, okay?
[39:48] over here. That was us price is shifting bearish. But, in order for this to be valid, price must stick out this low right here. If price stick out this low here with a nice candlestick closure right
[40:03] okay, nice candlestick closure, this means that we got a bearish break of structural, and right now price is shifting bearish.
[40:15] Okay, so ideally for us to really determine that price has officially shifted bearish, we want to see a nice candlestick, a bearish candlestick, closing below this low. But, did that happen?
[40:28] It hasn't really happened yet, right? What we have was we got this nice like lower wick break, right? So, lower wick break just like this, which is not a candlestick closure, so I'm a little bit skeptical of the fact that
[40:42] this is indeed a valid market shift because of the lack of follow through. Because this could just be a liquidity sweep for price to shift bullish. Okay, could just be liquidity sweep for price to shift bullish. So, in this
[40:55] situation right here, once again, let's jump down one time frame to see what price is really doing. So, you I want you guys to use all the concepts you have in your arsenal.
[41:07] That's what market mechanics is about, right? It's about using as many weapons in your arsenal as possible to fight the enemy, which in this case is to just what's going on here. So, one concept that come to mind right
[41:21] now is liquidity, right? So, what we have was price comes down, pulls back, goes down, goes up, right? So, this is double bottom, equal lows. We all know there is available liquidity sitting below this low. No wonder price came
[41:36] down, created this long lower wick because it was just wanting to sweep all Right? Sweep all the liquidity below this low to shift bullish.
[41:48] that we can use, right? It's It's the liquidity thing. Next, use your point of interest, right? So, if you look at your demand zone, your supply zone, whatever, come to a conclusion that, "Hey, if you look at the left-hand side, price goes
[42:04] up, pulls back. At this point in time, price started reversing." Not only did it reverse, but it reversed very aggressively with a lot of imbalance, right? All of this is just imbalance right here, which means there's a lot of
[42:16] buying pressure, a lot of buying momentum. Which also means that this somewhere around here this must be the origin point that institutions look for longs. That's what your demand zones, your
[42:29] order block is, right? It's just the origin point. It's the location in which smart money have entered in the past and it's most likely going to enter again. towards the right, you see, "Hey, so much buying pressure. Let me find the
[42:42] origin point." If I find the origin point, I can see that this is the most uh lowest point that led to this entire move right here. So, this must be our demand zone, right? Demand zone. And then this right here is also your order
[42:55] block because there's a lot of imbalance. Boom, origin point, order block. Okay, but since price has already break past that area right here, I don't So, this is what I really care about right here. This demand zone over here.
[43:08] Once again, what is the market trying to tell us right now? The market say, "I'm going to push price down, right? But when price is approaching this area here, I don't have enough liquidity to go down. So, as a result, what happens
[43:22] is that the buyers have came into the market and just push price all the way up here leaving a trail behind, which is this low wick right here, which indicate to us that the sellers tried, right? They attempt to push price down, but
[43:35] there's There's insufficient sellers in the market to push price down. As a result, demand exceeded supply, buyers overwhelm the sellers, and right now price has reversed and moved towards the upside.
[43:52] It's doing its job right here. This demand zone is also working, right? this demand zone. Yes, we got a little wick break, but this is just, you know, the day, price did respect that this demand zone.
[44:09] So, all of those signs right there just asked that, "Hey, maybe price is not as bearish as I think it is." Once again, this is so important for you guys to understand, to perceive the objective reality of price rather than
[44:25] objective reality of price rather than your subjective perception of price. price might be shifting bearish, right? All this selling pressure, market shift, la la la la. Price is going down." But, is that what price is doing right now?
[44:38] No, because after really doing our rational analysis, doing our logical research, we have realized that maybe price is not bearish right now, right? So, you can see the difference right here. Most traders lose because they
[44:52] impose their subjective perception of the market onto the objective reality of the market. As a result, they try to trade their bias of the market, they try to trade their belief of the market rather than
[45:04] their belief of the market rather than the market itself. market mechanics analysis, I I am trying to be as objective as humanly possible. And I know that, hey, after doing all these analysis, I
[45:17] realize that the buyers are in control of price. Which means that I do need maybe that I shouldn't be be looking for shorts yet, right? Maybe I shouldn't be So, uh I'm I'm going to wrap wrap this up
[45:29] over here is that if you look at what price is having like right here, this is like price comes down, pulls back, goes down, pulls back, right? It's a very sort of like bearish market structure that we have right here. So, once again,
[45:43] using our fractal structure, we have determined that this is the last fractal last fractal lower high, we got a fractal market shift, which confirm a shift in structure, which means price is shifting bullish.
[45:56] Now, this is where you also want to try to map out the demand zone that led to the fractal market shift, right? And this would be the extreme demand zone right here. Obviously, let me just go down to the
[46:08] clearer for you guys to see, right? So, that is your 15-minute demand. And then this right here is your 15-minute flip zone itself. Okay, so flip zone, extreme demand zone, and right now Okay,
[46:24] right? To see who's still paying attention. Who is in control of price right now? The buyers or the sellers? Let me know down in the chat. The buyers or the sellers? Who is in control of price? Okay, so a lot of you will say
[46:37] buyers, right? So, in this case, we got a fractal market shift, right? We got got price sweeping the liquidity below these lows. So, by definition, technically, we are bullish. All right, so we are bullish right now.
[46:51] And prices came down to either one of these zones right here. And once again, it's very simple if you are day trading or scalping. If price comes down to your medium time frame point of interest, you immediately jump down to your 5-minute
[47:03] look for your entry model, right? If you get a fractal market shift, a liquidity entry trigger, then you can look for Okay, so yeah, wherever point of interest in which you are getting the
[47:15] entry from, then that is where you can look for longs to trade it to the Okay. Cool. Cool. So, in this case,
[47:28] the full picture, right? So, in this case, if I enter for a long somewhere entry confirmation, what I'm going to be doing is that I'm going to be move to it next, right? So, the first place where price is definitely going to
[47:43] move to it next, if price wants to go up, is this high here. This is also the next 15-minute supply, and it's also the most recent like sort of Yeah, it's also the most recent high
[47:57] So, if I'm looking for longs around here, the first area that I want to be targeting is going to be like this area right here. Okay? That's the first area. Okay, stop loss will obviously be at a point that invalidate your trade ideal,
[48:11] which is the last liquidation candle, the below the point of interest, which models, right? When it comes to take profit, you want to place it at where price is moving to it next. So, in this case, this is where price is moving to
[48:25] Now, where where is the where's the another point of interest where price towards the left, you see all of this supply zone right here. These are essentially where price will move to it next before it can
[48:38] potentially get a reaction to move to the downside. Okay, so either one of these point of interest right here. Now, on a sort of like macro perspective, right? If you zoom a little bit, this is where you can see
[48:52] zone up here. And once again, this is where a lot of They enter for a buy right here, they try to target all the way up here. Now, I'm not saying it's not possible. I'm saying that
[49:08] once again, you don't want to be trading your subjective perception of the market. You want to be trading the objective reality of the market. If you this particular lesson itself, it would be you guys want to be taking you all
[49:21] reality of the market itself. So, the objective reality of the market is that area first, right? This supply zone that we have marked up right here first. Like that, we know, not for sure, but like in terms of probabilities-wise, it's
[49:37] than here, right? So, I'm going to be targeting right here. Okay? So, yeah, that's what I want you guys to understand, right? Is to really like just place a take profit at the point of interest where price is most
[49:50] likely going to move to it next, right? So, in this case it'll be right here. If come up here, right, this next supply zone right here. If it take out that, if they got that, then you can potentially look to target this. But you
[50:04] final boss of the battle and try to get this. question. For instance, how do we know we don't wait to extreme demand zone to
[50:16] mitigate before bullish like the case just now you is going bullish where not mitigate demand zone. So, entry models, right? So, if you see your entry model confirmation tell you that bias is actually pushing to the upside right
[50:30] your uh liquidity sweep, then that's the confirmation that you can have to just execute for longs and pray for the best, right? Like once again, we don't know for sure, right? But that's what you can do to ensure that you're entering at the
[50:44] right time. Is Aligrasa isn't there a lot of flip zone that should be taken first? 100%, right? This is why uh like I said, right? You want to look to enter at a point of interest that give you the
[50:58] entry model. Now, notice I didn't say, "Hey, you should enter for a buy right I say that it could happen in either one of these point of interest, whichever one that provides you with the entry model. Right, so in this case, there's
[51:11] below these lows right here. Right, so what can potentially happen is that sweep all of those liquidity that we extreme zone and then shift bullish. And if that's the point of interest that give you entry model, then yeah, you can
[51:26] look for longs from there. So, uh Abdullah said, "Do we use the second layer of internal structure for immediate bias?" You can, depending on the trading style, right? If you are scalper or you're intraday trader, it
[51:38] might make sense for you to use the second layer of internal structure. So, your all determines it all comes down to like what is your objective? Like what are you trying to do with price? Because I want you guys to think of it this way,
[51:51] right? Every single concept that you guys use in market mechanics, every single price action that you look at, every single shot of structure that you look at, is essentially a piece of the puzzle. It's just a piece of the entire
[52:03] puzzle. So, as much as possible, you want to gather as many pieces of those puzzles so that you can make a well-informed decision. So, you can make a sound judgment, right? And sometimes you might need to use the
[52:16] Sometimes you might need to just use the first layer. So, you want to use these pieces of the puzzle to try to formulate a bias where you can have like this hypothesis where you kind of know to a certain degree that, "Hey,
[52:31] price is moving towards here or here. I'm going to be looking for buy, and if I'm looking for buy, I'm going to be targeting here or here." Right? So, So, yeah. Uh Thank you for coming to my TED Talk.
[52:46] Right? So, that's pretty much it. I really wanted to like dive super duper deep into like those two concepts pairs and like just give you guys like I think that obviously there's a lot of nuances, right? Like, "Hey, man, maybe
[53:01] in the market. The liquidity shift can happen right here. The push inducement inducement can be happening." All of this advanced stuff, all of these nuances, nuances which you will learn uh as you go through the courses.
[53:15] learn all of this juicy stuff right here, right? But, I really wanted to like just spend this lesson here just dissecting how I personally trade and how I think through my trades. Because it's not as simple as, "Hey, I'm just
[53:29] because the market is up." Or, "I'm going to enter for a buy right here No, it's like I said, using the different pieces of the puzzle, putting them, piecing them together to form a bias, to create like a
[53:42] well-informed decision as to where I think price will move to at next. before I end here today, I got a favor to ask you guys, right? So, if you guys have found this session helpful, or you found 1% Club or 1% Accelerator,
[53:59] whatever program that you're in helpful, please do me a favor. So, what I want you guys to do is to send this to your friend or family who is looking to start to learn trading. Right? I'm doing this free 33-day Market
[54:16] Mechanics Mentorship on YouTube for free, right? That is I'm not selling them anything whatsoever. I'm doing it for free, right? Which means that for the next 33 days, I'm giving them one free course.
[54:28] Now, once again, you guys have the privilege or you guys are fortunate to be part of this mentorship program, but your friends, your family members might not get the same opportunity as you do maybe because they cannot afford it, or
[54:40] maybe because like they just don't know me, right? So, help me help you, help me make this industry a better place. Help me change more life by spreading the message, spreading the love, elevating the consciousness by just letting them
[54:56] know, "Hey, if you want to learn trading, join Brett's free Market Mechanics Mentorship." Right? It's for absolutely free. It's obviously a tiny portion of what you guys learn here. You guys get like 100% of it, but they get
[55:08] like maybe 10% of it, but that 10% of it goes a long way, right? It really just allows them to have the right foundation so that they can actually like start trading profitably. Right? So, that's all I ask for you guys, right? If
[55:21] you guys enjoyed this session, if you guys enjoyed 1% Accelerator or 1% Club, send this mentorship to your friends and your family or anyone who is interested in trading. Help me make this industry a better place. Help me make
[55:35] this world a better place. Right? So, with that being said, I hope you guys have enjoyed this live trading session. Uh just continue going through the process. It's only a matter of time until you
[55:49] will be able to get to that point where you can analyze the charts just like I do with so much clarity, with so much confidence. and you'll win in the end. Okay, so thank you guys. I hope you guys
[56:02] questions, please bring them on to the next coaching call. I look forward to wish you guys an amazing week ahead. All right? Thank you, and have a good time, right? Thank you, and have a good time, guys. Take care.



⚡ Saved you 0h 56m reading this? Transcribe any YouTube video for free — no signup needed.