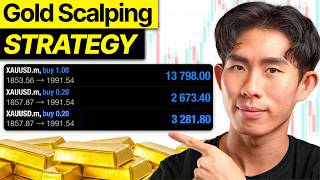

Why Gold Is Different: Avoid These Mistakes
54sHighlights common gold trading pitfalls and the importance of liquidity, offering actionable insights for traders.
▶ Play Clip"Delivers a solid, actionable strategy with real trade breakdowns, though the 'Beginner to PRO' promise is slightly oversold given the advanced liquidity concepts."
In this video, Brad Gold presents his personal gold scalping strategy, emphasizing a liquidity-based approach over traditional technical analysis. He outlines a five-step framework for identifying high-probability trades, demonstrates its application through two live trades that yielded significant profits, and introduces his trading platform, Edge Flow, as a tool for maintaining discipline.
Brad introduces the video, promising to show his exact gold trading method, including entries, profit-taking, and a breakdown of two live trades that earned him $566k.
Brad has nearly 7 years of trading experience, documents trades on his second channel 'Brad Trades', and is the founder of Edge Flow, a discipline-first trading platform. He emphasizes that gold moves fast and requires a different approach than forex.
Gold tends to sweep highs and lows to grab liquidity before moving aggressively in the opposite direction. Traders should wait for price to come to their levels rather than chasing price.
The goal is not to predict the entire move but to find the highest probability section. Get in fast, get out faster.
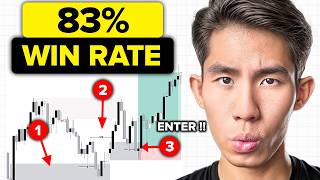
The strategy comprises five steps: identify trend direction, mark liquidity and points of interest, wait for price to reach a 15-minute point of interest, wait for entry model, and target the next swing high/low.
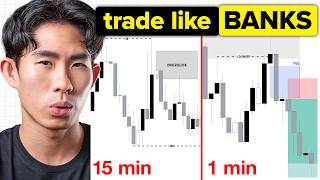
Align the 15-minute and 1-hour time frames. If both are bullish, look for longs; if both are bearish, look for shorts. Misalignment leads to low probability setups.
Identify demand zones (for longs) and supply zones (for shorts). Liquidity is where stop losses and stop orders are placed, acting as fuel for price movement.
Be patient and wait for price to come to a marked demand or supply zone. Do not enter in the middle of nowhere.
Do not enter blindly. Wait for a liquidity sweep or a market shift as confirmation. A liquidity sweep indicates smart money manipulation, while a market shift confirms a change in structure.
For scalping, target the nearest logical liquidity, such as the next swing high (for longs) or swing low (for shorts). Place stop loss below the protected low (for longs) or above the protected high (for shorts).
Aggressive entry: enter right after liquidity sweep and point of interest mitigation. Conservative entry: wait for a market shift and then a pullback to the zone that created it.
Edge Flow now supports multiple assets (gold, forex, indices, crypto, commodities) and integrates with Trade Locker. It helps with planning, risk calculation, execution with guardrails, journaling, and performance review.
On the 1-hour and 15-minute time frames, price was bearish. Brad waited for price to return to a supply zone, saw a liquidity sweep, and entered short after a bearish candlestick. Stop loss above the protected high, take profit at the next 15-minute demand zone. Trade lasted 1 hour 20 minutes.
This trade had a misalignment (15-min bullish, 1-hour bearish). Brad entered short after a liquidity sweep but almost lost. He moved his stop loss based on gut feeling, which he attributes to subconscious pattern recognition. Price swept the high and then hit his target. He rates this trade 5/10 due to the discretionary move.
Strategy helps make money, but discipline keeps it. Most traders lose due to over-risking, revenge trading, lack of a plan, moving stop losses, and not journaling. Edge Flow builds discipline into the process.
Create a trading plan with templates, analyze charts with the plan beside you, use automatic lot size calculation, set guardrails (max daily loss, max trades, etc.), and automatically journal every trade. Track performance to see what works.
Brad emphasizes that a simple, repeatable strategy combined with discipline is key to consistent profitability in gold trading. He encourages viewers to use his framework and tools like Edge Flow to maintain discipline and track performance.
What is the key mindset shift when trading gold?
You don't need to catch the entire move; just catch the cleanest part of the move.
02:09
What are the five steps of Brad's gold scalping strategy?
1. Identify trend direction (15m & 1h aligned). 2. Mark liquidity and points of interest. 3. Wait for price to reach a 15-minute point of interest. 4. Wait for entry model (liquidity sweep or market shift). 5. Target the next swing high/low.
02:40
Why is it important to align the 15-minute and 1-hour time frames?
Misalignment leads to low probability setups; alignment increases the probability of a successful trade.
03:10
What is liquidity in the context of trading?
Liquidity is where traders place their stop losses and stop orders; it acts as fuel for price movement.
05:31
What is a liquidity sweep?
A liquidity sweep occurs when price takes out a previous high or low, grabbing liquidity before reversing.
10:42
What is a market shift?
A market shift is when price breaks the last higher high (in a downtrend) or lower low (in an uptrend), indicating a change in structure.
14:07
Where should you place your stop loss when going long?
Below the protected low (the low that swept liquidity).
13:13
What is the difference between aggressive and conservative entry?
Aggressive: enter right after liquidity sweep and point of interest mitigation. Conservative: wait for a market shift and then a pullback to the zone that created it.
13:40
Why did Brad rate his second trade 5/10?
Because it had a misalignment (15-min bullish, 1-hour bearish) and required discretionary stop loss movement based on gut feeling.
20:26
What is the main reason traders lose money according to Brad?
They over-risk, revenge trade, trade without a plan, move their stop losses, and don't journal their trades.
23:48
Catch the Cleanest Part
This mindset shift is crucial for gold trading, emphasizing precision over prediction.
02:09Time Frame Alignment
Aligning 15-minute and 1-hour trends filters out low probability setups.
03:10Liquidity as Fuel
Understanding liquidity is key to predicting price movements in gold.
05:31Liquidity Sweep Confirmation
Waiting for a liquidity sweep prevents premature entries and false breakouts.
10:42Gut Feeling as Pattern Recognition
Brad's discretionary stop loss move highlights the role of experience in trading.
20:26[00:02] trading gold. In this video, I'm going to show you exactly how I trade gold, how I find my entries, how I decide where to take profit, and I'll break down the two live trades that made me that profit. Now, this is not theory.
[00:17] These trades were documented live on my second channel, Brad Trades. And later in this video, I will show you exactly what I saw before entering, where I place my stop loss and take profit, and why. Now, for those of you who are new
[00:30] here, name is Brad Gold. I've been trading for nearly 7 years, and I document every single trade on my second channel, Brad Trades. I'm the founder of that has helped hundreds of students
[00:42] become funded traders. And I'm also the founder of Edge Flow, a discipline-first trading platform that helps you plan, execute, journal, and review your trades with proper guardrails and performance tracking. So, I don't want your money. I
[00:56] want you to become a better trader. With that being said, let's get right into it. Now, before I show you the strategy, you need to understand one thing. Gold is not like every other market. Gold moves super duper fast, which means that
[01:10] it can give you a very clean move very, very fast, but it can also reverse on you just as fast if you are way too late or if you get too greedy. That's why a or if you get too greedy. That's why a lot of traders struggle with gold. They
[01:24] treat it just like a normal forex pair, and then they enter way too late or they hold a trade for way too long, or they use stop losses that are way too tight, use stop losses that are way too tight, or they try to catch the entire move.
[01:38] But gold doesn't reward that. Gold respects liquidity very well. It loves to sweep high, sweep lows, grab liquidity, and then move aggressively in the opposite direction. So, instead of chasing price, you need to understand
[01:54] where liquidity is sitting and wait for price to come to your level. The biggest mistake beginners make with trading gold is that they think they need to catch the entire move. You don't. You don't need to catch this entire 200 pip move
[02:09] in order to make money on gold. You just need to catch the cleanest part of the That's the mindset shift. The goal is not to predict the entire day. The goal is to find the highest probability section of the entire move. And then get
[02:26] in, take your profit, and get out. So, I want you guys to remember this when you are trading gold. Get in fast, get out faster. That's my philosophy when it comes to scalping gold. Now, let me walk you through my entire gold trading
[02:40] strategy which comprises of five simple steps. This is the exact same framework that I use whenever I'm looking for quick, high probability move on gold. And remember, because we are scalping today, we are not trying to predict the
[02:54] the entire move. We are just trying to catch the cleanest part of the move. So, step one is identify the trend direction. Specifically, the 15-minute and the 1-hour trend direction. So, you want both of these time frames to be
[03:10] aligned before you even look for a trade. So, if the 1-hour time frame is bullish, but the 15-minute time frame is bearish, now we got a misalignment in the higher time frame and the lower time frame, which will give you low
[03:23] probability setups, right? As much as possible, you want both of these time frames to be aligned. The 1-hour bullish, 15-minute also got to be bullish. The 1-hour bearish, 15-minute also got to be bearish. So, yeah, like
[03:35] make sure that both time frames are aligned as much as possible. So, in this price is creating your lower highs, lower lows, lower highs, lower lows. And
[03:47] then what happens is that there was so much bullish momentum, so much buy orders in the market that later price went up there and take out the last lower high giving us a market shift. Right, so at this moment of time we know
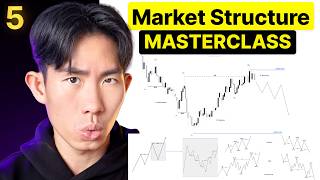
[03:59] that the structure has officially shifted bullish on the 1-hour time frame. And once you got this market shift right here, this is where you can identify the higher highs and higher lows as your new bullish break of
[04:11] structure. This tell you that the buyers are in control of price. Demand is overpowering supply right now. So, that is where you can mark up another break of structure right here. Right, so market shift, break of structure, and
[04:25] this is where we can clearly see price is creating a higher highs and higher lows. And the moment you map out your most recent break of structure, this is where you can map out your 1-hour swing low, which is this low right here, and
[04:38] then this will be the 1-hour swing high. And this becomes the range that we are trading within right now. This is the 1-hour strong low and this is the 1-hour weak low, so we are expecting price to, you know, continue creating this higher
[04:51] highs and higher lows dynamic and just continue creating bullish break of structure to the upside. So, that's the 1-hour time frame, right? The 1-hour time frame does that right now price is bullish. So, step two is to mark up
[05:03] bullish. So, step two is to mark up liquidity and point of interest. Once I know the direction I want to trade, the next step is to identify the location in which I am scanning for trading opportunities. And in order for you to
[05:16] liquidity and point of interest. Now, so I'm not going to cover liquidity in too in-depth in here, but at a high level, just understand that liquidity is essentially where traders are placing
[05:31] their stop losses and stop orders. So, it's essentially the fuel the market need in order for it to move in a particular direction. So, in this particular example, what I'll do is that I will just map out the demand zones
[05:43] first, then I will start try to a for available liquidity. Right, so the zones is because price is bullish right now. So we want to look for buys, we want to look for long positions at demand zones, as simple as that. Right,
[05:57] right? So this is the 1-hour swing low, and then there's a demand zone right here, and then later on price went up, pulled back, and then goes up again, creating another demand zone right here. Right, so just at a high level on the
[06:11] there's two demand zones. Which means that we are not going to be doing anything until price comes down to either one of our two demand zones that we have marked up right here. Just by doing this alone, you will
[06:23] filter out a lot of bad trades. You won't be looking to get in here or here. won't be looking to get in here or here. No, because price is not at your ideal patient and wait for price to get there. Like I said, these points of interest
[06:36] are the areas where I want price to react from. And this could be a supply zone or a demand zone or a fair value gap or an order block or any clean area where price previously showed strong direction. Right, because that give us
[06:52] uh indicator that that is where smart money have gotten in the past and they are most likely going to enter at the same price again. Now once again, we don't enter when price is in the middle of nowhere. You want to wait for price
[07:04] liquidity has been taken, risk is defined, and the trade actually makes to do is to mark up your available liquidity, right? So this is where I want to see price sweep the liquidity below swing lows. So this is where you
[07:19] lows, all of these internal lows that's being formed right here, all of these that price went up, pulled back, goes up, right? So this itself is liquidity. But in this particular example, price is already swept the liquidity below this
[07:34] low when price came down and created this long low wick right here. Right, so then let's try to search for more available liquidity, well, price went up, pull back, and then goes up again, right? So, this is clear as day another
[07:48] liquidity point. And then, there's also another liquidity below this week right here. Right, so these are like the two most obvious liquidity that price has to take before price can continue bullish. So, once again, we are not doing
[08:00] anything until price come down to take one of these two liquidity right here. So, on the 15-minute time frame, you can also see that, hey, this was the demand also draw another 15-minute demand zone right here because this is where price
[08:13] went up, pull back, and then goes up even further. So, if you are scalping, like I said, you want to wait for price to get down to a point of interest, which brings us to the third step, and that is to be very patient and wait for
[08:28] price to reach a 15-minute point of interest. Right, so once again, there's demand zone right here, and there's another demand zone right here. We don't know exactly which one price will react from, but what we do know is that price
[08:42] then eventually make the move to the upside. And what we want to do is to like just do nothing until price get down to the first demand zone. If price here, we look for our entry confirmation, we look for our entry
[08:58] model, and if it present itself, we look to get in. If it doesn't, then we wait of interest and we repeat the same process of searching for our entry confirmation, searching for our entry trigger. If it doesn't, like I said, we
[09:12] come down to this next point of interest. You can see this framework is very methodical, very mechanical, and it's repeatable, right? Whatever that is simple is scalable, right? So, that's how I frame this. So, yeah, step three,
[09:26] to the point of interest. So, let's see what price does. Okay, price continue go up there, creating another bullish break of structure to the upside, but then this point of interest, right? And that's where I'm looking to get involved
[09:39] very very soon. Okay, price mitigate the point of interest. So, step three done, right? Mitigated our 15-minute demand zone. But, is there a liquidity sweep? Right? Is there a liquidity sweep? Because remember, liquidity is
[09:52] essentially the fuel that smart money need in order to move price up significantly or go down significantly, right? So, we need to get that liquidity right? So, we need to get that liquidity sweep.
[10:05] >> [snorts] >> price have not swept liquidity even though it mitigated the point of interest, which brings us to step four, and that is to wait for the entry model. The moment price reaches a point of
[10:17] interest, you cannot enter blindly right here because you haven't gotten the confirmation that price is indeed going up. So, if you enter right here, it's way too early, it's too premature, and what tends to happen is that we can have
[10:30] a false breakout right here for price to continue crashing down, and then you just get stopped out like you always do. So, you want to be very patient. You don't enter blindly. You wait for the entry model. So, the first thing I want
[10:42] to see is price sweep some form of liquidity because when price takes out a previous high or low and grabs liquidity, this indicate that, you know, smart money has manipulated price to trap all the retail traders, and now
[10:55] cause price to move up. So, that's always going to be the first thing. So, in this case, if you look at this right here, there's liquidity sitting beside this low right here. So, I want to wait for that to be swept before I can even
[11:08] consider getting into the trade itself. So, in this case, once again, price is sign me into the trade, it's trying to induce and entice me into, you know, entering for a long position right now, but I am not interested, right? Because
[11:22] yet. We ain't dumb retail traders, all wait and wait. Da da da Still waiting, still doing nothing, still doing nothing. Boom! The moment price comes down and sweep the liquidity below this
[11:35] low, this is where you can look to get in. Right, so somewhere around here, the you can easily get in for a long position right here if you are super aggressive, you can get in for a long
[11:48] right here and then try to target where do you target? Right, which brings us to the next step is to make sure that you target the next swing high, swing low, I like to keep it simple. Right, because this is scalping, I'm not trying to
[12:03] catch some massive move like 1:10 or another BS. I'm just going to target the another BS. I'm just going to target the nearest logical liquidity. And that usually means the next swing high if you are looking for long. And then if you
[12:16] swing low or the next supply or demand zone or next point of interest. Right, so in this case, since I'm looking for long at this liquidity sweep, I'm going to be targeting the next supply zone or the
[12:32] this case, you can see there's two places where you Right here, there's a swing high. This is the ultimate swing high, right, the 1-hour swing high. Or you can target the 15-minute internal high, which is this
[12:46] one right here. Right, so these are two places where you can target. Now, for me, scalping wise, I like to, you know, just really manage my expectation, be extremely conservative, and that is why I would most likely target the nearest
[12:59] here. And then when it comes to my stop loss placement, I'm just going to be candlestick that I entered the trade from. Right, so if I'm entering this trade right here, I'm placing my stop loss below the low. Right, because why?
[13:13] Why below the low? Because this is the low that swept liquidity. So, it becomes like a protected low. Right, so this means that there's a lower chance for low before going up even further. Right, so that's where I would place my stop
[13:26] loss. So, this is how you can go about trading if you are aggressive. You know, like this is like a simple 1:3 RR trade. You just enter right after the point of interest mitigation and liquidity sweep, and you can see price just happily went
[13:40] up there and smashed our TP. Right, so this is if you are trading aggressively. Now, if you want to look for extra confirmation, you know, you're thinking, Brad, because it's a little bit risky, it's a little bit dangerous, and you
[13:53] want to play it safe." Let me introduce you to another entry confirmation, and that is the market shift. Right, so in this case, if you want to really just, you know, get more confluence, what you can do is wait for price to take out the
[14:07] last lower high. Right, so in this case, price came down, pulled back, came down, pulled back, and then goes down even further. So, this is the last like internal bearish break of structure, which means this is the last internal
[14:19] high. Right, so if price is going to take out this last 15-minute high, this means that we can officially get a market shift, which confirm to us that the internal structure is indeed shifting bullish, and then right now,
[14:32] you got all those stars in the entire universe for you to look for longs. enter for this trade. If you are not okay with the first way, which is too liquidity sweep, get a point of interest mitigation, you enter right here, and
[14:46] then place a stop loss below the protected low, place a take profit right here. If that's too risky for you, and you want to play it safe, what you can do is to wait for the market shift to be formed, and then wait for price to pull
[14:58] back to the zone that created this market shift. Right, so in this case, you can map this thing right here as your 15-minute demand zone that led to the market shift, and you can look for entry only when price mitigated this
[15:10] zone. Right, so in this case, if you map it out via like the pivot candle, right? Remember our demand zone via the pivot candle? It's It didn't mitigate it, but if you draw the entire demand zone as like this range right
[15:23] is where you can look for longs and you can trade it to the next swing high, stop loss once again below the candle that you enter the trade from and yeah, happy days. Right? So, I wanted to show you guys like the two types of ways
[15:37] right? The aggressive way where you enter just right after the liquidity sweep. But once again, the downside to that is that you're going to be prone to There's going to be times where, you know, the price comes down through this
[15:51] If that's the case, you're just going to get stopped out, right? I'm just telling you the truth right there. That's the downside of using the aggressive entry entry model, there's a lower chance that you are going to miss out on the trade
[16:05] itself, right? Because price does not, you know, pull back after the market shift all the time. Sometimes price will just sweep the liquidity and then just waiting for the conservative version of the entry model, you would have missed
[16:18] out on this trade. Right? So, it's all about your risk tolerance, right? You can test both out and see which one works best for you and then stick to that one. Now, before I move on to the next part of the video, I got a very
[16:30] important announcement to make and that is the fact that you can finally trade multiple assets on Edge Flow, my trading super app, right? So, right now, if you're trading gold, forex, indices, crypto or commodities, you can finally
[16:45] do so on Edge Flow. Now, if you're a full-time trader, you probably don't just a strategy. You need discipline. You need proper risk management. You need journaling. You need a system that keeps you accountable. And that is what
[16:58] world's first trading super app which allows you to do your pre-market routine You can journal on there and do your whole post-market routine on there. So, it's like everything you need as a professional trader is in one place.
[17:12] It's in one system. And on top of that, you can now connect Trade Locker directly to Edge Flow as well. So, whether you're trading gold or any other market, you can use Edge Flow to plan your trade, calculate your risk, execute
[17:25] with guardrails, journal the trade, and then review your trading performance in one place. Now, I know Edge Flow sounds super exciting, but hold your horses. I'm going to show you how I use Edge Flow later to trade gold to maximize my
[17:39] profitability later on in this video. But for now, let's get back to the video and let's go through the two live trades that taken on gold and made me a start of this video, I told you guys
[17:52] that I made 566k live trading gold. And the best part was that I did it in two big boy trades, right? Just two trades. And once again, every single thing was documented live on Brad Trades, my second YouTube
[18:05] see my exit, and you can see all the between. But anyways, I wanted to show you guys my thought process for these two trades, how I pretty much applied this strategy that I show you on these
[18:18] two trades alone. So, this is my trading journal, and I can see this was the first trade, June 18, made 292k. The trade took about 1 hour 20 minutes, right? Which is quite short, right? Imagine making 300k in freaking 1 hour
[18:33] 30 minutes. Never have I imagined I could ever get to this stage right here you guys can see, this is the chart screenshot itself. This was what price the 1-hour time frame, you can see we got a market shift. Price is obviously
[18:48] heavily bearish, right? Clearly. And on a medium time frame, I was also bearish, right? Price was also bearish. So, 15-minute, 1-hour time frame, both is where I know that I should be looking for shorts. And then all I did was to
[19:03] wait for price to come back up to the supply zone, right? Wait for price to sweep liquidity on my lower time frame right here. And this is where I got my confirmation to look for short right here. Right, so I like to like play it
[19:16] enter right after the liquidity sweep. You can see in this case, this was the liquidity sweep. I like to wait for an additional bearish candlestick to form momentum, selling pressure in the market, and then that is where I made my
[19:31] entry right there. Yeah, so enter right there. Stop loss, like I said, above the candle that I entered on, or rather above the protected high. Right, because Enter right there and then and just take profit at the next 15-minute demand
[19:45] zone, right? At the next 15-minute swing low. Right, so you can see, this is the I've been talking about for like the past 30 minutes. It's really just as simple as that, right? Like when you have such a simple framework, you can
[20:00] repeat it, and when you can repeat it, you can scale it. So, overall, I'll rate this trade like a good old seven out of 10, right? It's not the best trade that I've taken in my entire career. I've got a lot better entries, right? Sniper
[20:12] entries and all that stuff, and made a lot more money on other the trades, but I'll say this is a pretty good implementation of the trade plan that I itself. So, I'll give you like a seven out of 10.
[20:26] you like a freaking five out of 10, right? And hear me out, hear me out, all right? So, for this trade, made about 274K, right? And this took about 44 minutes, right? So, it was under an hour. You can
[20:39] see, this is what price was doing on the higher time frame. Obviously bearish. Medium time frame, right? Price was shifting bearish, right? Price was actually bullish right now, right? So, in this case, you can see, now there's a
[20:52] misalignment. The medium time frame is bullish, higher time frame is bearish. Hm, so is this really a high probability trade? Hm, not really. But in this case, your boy still took that trade itself because
[21:05] uh yeah, why not, right? Why not? Hashtag why not? And I almost lose the trade breakdown, you'll see that I almost lose the trade itself. Because when I enter for a sell right here, I entered because price have swept this
[21:19] high right here, and then price went down, went down, went down, went down, bit, you know, almost hit my TP right there, but then price started to move against me, right? Started coming up here. And then this is where I decided
[21:31] know, just be a little bit more discretionary because I my gut feeling says so, right? Like that's the truth. My gut feeling says so. And to me, since I've been trading for 7 years, I've learned to trust my gut feeling in the
[21:45] past 1 or 2 years or so. Because I believe that my gut feeling is simply my subconscious pattern recognition skill, right? So, when my gut feeling is like, loss right here." Because we all know what's going to happen next, which is
[21:59] the fact that price is going to sweep this high and then go down to your TP, right? So, at this point time, I "Am I removing my stop loss because of fear, or am I removing my stop loss because that's what price is doing?"
[22:13] Right? So, that is where I was like, "Let me just be as objective as humanly loss because I know price is going to sweep the liquidity above this high right here." And if price do want to continue going up, I will just close the
[22:25] trade manually and take a big fat L, right? But luckily, price did play out in the exact manner I envisioned it to play out. Price went up there, swept the liquidity above this high, and then continued crashing down. This is where I
[22:38] protected high, and I managed to take profit right here. Yeah, that's why I 10 because it's not the best entry, it's not the best implementation of like this strategy right here, and it required a little bit of discretion. So, if you're
[22:53] in your first year of trading, I would highly discourage you from moving your stop loss. Be as mechanical as humanly possible. But because I've been trading for so long, right? I've learned to like just develop this gut feeling, which is
[23:06] pattern recognition skill. It's simply just my mind recognizing that, "Hey, Brett, you got stopped out at this place multiple times in the past. And whenever price always end up going in the way, right? It's just a classic liquidity
[23:21] manipulation, right? So, let's be smart this time round and let's do the right thing. Okay? So, yeah, that's why I did this. Now, before I end this video, I'm going to show you what I call the trading cheat codes. Because here's the
[23:34] A strategy just like this can help you make money. But, discipline is what helps you keep the money that you have made. And this is where so many traders fail. Most traders don't lose because they
[23:48] don't know when to enter. They lose because they over risk. They revenge trade. They enter into a trading without a trading plan. They move their stop loss. They don't journal their trade and they have no idea what they are actually
[24:02] doing wrong. That is why I built Edge Flow. Edge Flow is the discipline-first trading platform that I personally use to plan, execute, journal, and review my trades. So, quite simply put, Edge Flow is a system that
[24:18] has discipline built into it. So, you don't have to rely on your own your willpower. You will just do the right things every single day that will get you consistent results just by using this awesome app every single day. So,
[24:32] how I use it to become wildly profitable. So, first of all, before I enter into any trade, whether that's on a Forex pair or gold or US 30 or NAS 100, I want to create a trading plan. So, this is where I can come on to Edge
[24:47] templates that we have given you in here. Or you can just create your own your charting process, your entry criteria, your trade management rules, your exit criteria. So, this way you're always following your trading plan. And
[25:01] statistics of the plan, right? So, all the trades that you have taken according to this plan, you can also see how they are performing. And then before I start trading, you need to analyze your charts. And guess what? You can do so
[25:13] with a trade plan right beside you. Right? You can go through your charting process, do your chart markups in here, and look for entry criteria, and even look at the entry models that you have mapped out right here, so on and so
[25:25] Now, this way I already know what I'm trading, why I'm taking the trade, where my entry is, where my stop loss is, where my take profit is, and how much am I risking. This removes emotion and guesswork
[25:39] while price is moving. Now, once you're ready to enter for a trade, let's say on EUR/USD, all you got to do is place your stop loss in here, right? So, let's play And what EdgeFlow does is that it automatically calculate a lot size based
[25:54] on your risk per trade. So, this way you can just get in and out fast. Now, once again, this automatic lot size calculator is available on everything, right? So, we all know how troublesome it is to try to find a lot size for gold
[26:07] or US 30, but in EdgeFlow, it's built into the system, and I can do it in EdgeFlow does is that it gives me guardrails. This means that I can set rules like my max daily loss, my max daily profit, my max risk per trade, my
[26:21] max trades per day, and any other limits that stop me from doing stupid things when I'm emotional. This way, when I hit those limits right here, EdgeFlow literally stop me from trading and just prevent me from continuing making stupid
[26:36] every single trade I take on this platform is automatically imported into my trading journal. So, this is where I can see all my trading stats, and I can just take the time and space to introspect and review on my trading
[26:50] least, Edge Flow also helps me to track my performance. I can see which setups best, what time of the day I perform the best, how often I follow my trading plan, and where I'm losing money. This
[27:04] is where trading becomes a lot less emotional and more like a business. So, remember this. The strategy helps you find a trade, but discipline helps you keep the profits. It's one thing to make money, it's another thing to keep the
[27:18] money that you have made. And Edge Flow allows you to do both. That's the real more about how I actually read the markets, identify liquidity, understand market structure, find high probability setups, you want to know about my entire
[27:32] trading strategy, feel free to check out my free market mechanics mentorship series right here. It's 33 days where I'd literally mentor you for free, right here. Just just click here. And if you want to trade gold, indices, crypto,
[27:46] forex, commodities with proper risk management, with discipline, you know, real discipline, tracking, all that good stuff, check out Edge Flow as well. Link in the description. And as always, remember you're just one trade away.

⚡ Saved you 0h 28m reading this? Transcribe any YouTube video for free — no signup needed.