

Why Perfect Setups Still Lose Money
59sChallenges the common belief that a perfect setup guarantees profit, a controversial and eye-opening perspective for traders.
▶ Play Clip"Delivers a solid step-by-step strategy as promised, though some sections feel padded with repetition."
This video presents a three-step day trading strategy designed for beginners, focusing on identifying trends, spotting trend reversals, and positioning trades to capitalize on market moves. The presenter emphasizes the importance of risk management and a systematic approach over emotional decision-making, using clear diagrams and real chart examples to illustrate the concepts.
The presenter introduces a three-step trading setup that he has used hundreds of times, claiming it is one of the best for beginners to become profitable and for advanced traders to customize.
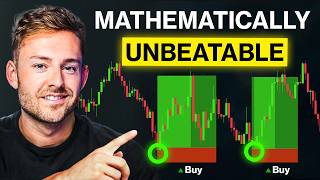
A perfect setup is not a trade that always wins; even perfect setups can lose. The goal is to find high-probability opportunities and execute them with a framework that protects against losses.
Traders should not attach beliefs to high-conviction trades. The presenter shares examples of C+ setups that became big winners and A+ setups that lost, emphasizing that the quality of the setup does not guarantee the outcome.
Trading should be about executing a process, not about the money. Money is a byproduct of good trading. Rewiring the mind to focus on the process rather than profit is crucial.
The goal is to find opportunities in the market, give yourself an even chance, and let a slight advantage play out over time. Focus on executing an edge known from data testing.
The strategy requires identifying trends, knowing signals of trend endings, and strategically positioning to capitalize. This foundation allows for contained losses and letting winners run.
A downtrend is identified by clear responses off at least two levels (supply outweighing demand) and at least two breaks of structure (lower lows and lower highs).
Look for a candle close outside of contact points, indicating a change of character. This signals a potential trend reversal, allowing early entry into a new trend.
A fair value gap is formed by three candles where the first candle's high wick doesn't overlap with the third candle's low wick. The 50% level (consequential encroachment) is important for entry.
Enter at the 50% point of the fair value gap, place stop-loss below the swing point, and set take-profit at 4x risk initially. Adjust stop-loss to break even after a break of structure.
After a break of structure, reduce risk to zero by moving stop-loss to entry, making the trade risk-free. Then let the trend run.
Use higher time frame fair value gaps and 61.8 Fibonacci retracement levels to identify take-profit zones. These areas often act as resistance.
The two main tools for take-profit are higher time frame fair value gaps and the 61.8 Fibonacci level. These can be combined for confluence.
Trailing stops can be used to lock in profits as the trade moves in your favor. The strategy is customizable based on market and time frame.
The presenter shows a live trade example, demonstrating entry at a fair value gap, moving stop to break even after a break of structure, and taking profit at a higher time frame FVG.
Trading involves losses. A contained loss on a setup that doesn't work is part of the process and does not make it a bad trade.
The strategy emphasizes a systematic approach to day trading: identify trends, spot reversals via change of character and fair value gaps, and manage risk with break-even stops and take-profit at key levels. Success comes from executing the process consistently, not from chasing perfect trades.
What is a 'change of character' in trading?
A change of character occurs when price fails to break a lower low (in a downtrend) and then pushes up over a contact point, indicating a potential trend reversal.
07:59
What is a fair value gap (FVG)?
A fair value gap is formed by three candles where the first candle's high wick does not overlap with the third candle's low wick, creating an area of imbalance.
08:12
What is the significance of the 50% level of a fair value gap?
The 50% level, called the consequential encroachment line, is used as a key entry point.
08:39
What are the two main tools for take-profit?
Higher time frame fair value gaps and the 61.8 Fibonacci retracement level.
14:22
What is the initial risk-reward ratio suggested?
4x risk (take-profit at 4 times the risk).
09:42
How do you make a trade risk-free?
After a break of structure, move the stop-loss to entry (break even).
10:48
What are the unique identifiers of a downtrend?
Clear responses off at least two levels and at least two breaks of structure (lower lows and lower highs).
05:26
Setup Quality vs. Outcome
Illustrates that even perfect setups can lose, emphasizing the importance of process over outcome.
01:34Trading is Not About Money
Challenges the common mindset, advocating for a focus on process to let profits follow.
02:32Change of Character Definition
Provides a clear, actionable definition for spotting trend reversals.
07:59Fair Value Gap Explained
Breaks down a key concept for entry points in a simple, visual way.
08:12Take-Profit Tools
Offers concrete methods for exiting trades at high-probability areas.
14:22[00:01] three-step trading setup and exactly how to spot them in the market. With over 8 setup hundreds of times. And to me, it still remains to be one of the best, trade. I'm going to break it down layer by layer, step by step, so that you know
[00:16] exactly what a clean setup looks like. And the best part about this model, in beginner traders to start becoming profitable. And for advanced traders confluence over it to customize it how you like. Still use the framework, but
[00:30] going to start with simple, clean diagrams to explain the logic. Then, we'll move into real chart examples and recordings of me doing this in real you'll know exactly how to spot these setups when they happen and how to
[00:43] capitalize on them. So, what we're looking for in the market is effectively a perfect setup. So, what is my perfect setup? A perfect setup is not a trade really easy thing to misunderstand if you're not a profitable trader. You
[00:57] you never need to lose a trade. You're always going to be right. That's just everything lines up perfectly, these trades can still be losers. Additionally, even if you have a perfect setup, that doesn't mean that you want
[01:09] to place more risk or more mental focus on the result or outcome of this trade. No matter how good a trade is, it always has the opportunity to fail because at random. It's up to us to put the frameworks in place to be able to
[01:22] protect ourselves from this and exploit an edge over time. Do not focus more mental energy on trades that you think are high conviction, have a higher probability of working out, or that you believe are going to work out. Attaching
[01:34] your beliefs to that system is not going to be good. Focusing on your strategy is a good example of this, I've had C setups. So, not A plus, not B, all the it because of the situation I'm in or the fact that I think I can capitalize
[01:49] profit and I have a slightly higher tolerance for risk. And trades like biggest trades that you'll have, ones that you're not expecting to work out. equally. This happened to me just a few days ago. The trade just kept running on
[02:03] me on a C++ setup. Conversely, if I have an A+ setup where everything is lining up, all my conditions are perfect recently as well, full loss right away. followed everything in my process. But still, nonetheless, a better trade setup
[02:16] stark difference between these two things. Very important to understand. To following my actual rules. And what makes a bad trade bad is when these money on the bad trade or lose money on the good trade, that is what constitutes
[02:32] day, it has nothing to do with the money made or lost on the trade. Largely, trading should have very little to do with money. and instead the money is a byproduct of good trading. Kind of a hard thing to understand cuz obviously
[02:45] make profit. But as traders, we need to be able to rewire the way we think and program it not to be so much about money so that the money flows as a result of going to drive themselves into the
[02:58] almost did it myself. So that is very, very important because no matter what, each trade is going to carry risk no matter how good the setup looks. I can't drive that home enough. Okay? And the goal isn't to find the perfect setup and
[03:11] everything that you have because you have an A+ setup. The goal is to try to find opportunities in the market. Give yourself an even chance to be able to exploit those and let a slight advantage that you have by positioning yourself
[03:24] carefully in the market to play out over time. So my goal is always to understand what high probability setups look like so that you can identify the right that the market gives you, and execute
[03:36] thing that we're focusing on is executing an edge that we know is there from data testing, from understanding how this process works so that we can and all of the emotions that play into this. And knowing what the perfect trade
[03:50] looks like is going to help us focus purely on perfect trade setups. It's all goal of trading and what I try to do with this strategy. And if we can make sure that we're always following this ideology, it makes executing a lot more
[04:03] doing is starting with this foundation and this intention. If we're able to where a trend is going to start, we can if we're wrong, we're going to leave that trade for a contained loss. And if
[04:17] we're able to time that, we're able to let the market move and exit when the we can make seven times what our contained risk is on the trade, which means we can be wrong a ton of times. We only need to be right a few times to be
[04:30] We don't need to be batting a thousand, being right about every single idea. being wrong when they're going to be wrong because they understand this keep our risk contained and if we're able to time those areas, we can make
[04:45] risking. And that's all we really need to focus on when it comes to trading. opportunities in the market. First, I need to be able to identify trends. Secondly, I need to know signals of when a trend is or potentially is ending.
[04:59] Then I need to be able to strategically position myself in to capitalize. And is where we can add extra filters, confluences to be able to try to more selective of where we are entering into the market to give ourselves a high
[05:13] profitability. Now, let's dive into the strategy. Like I said, first I'm going going to look on the chart. Then we're going to look at recordings. So by the really, really good idea of what this looks like. So step number one is being
[05:26] trend is when prices are generally moving down in one direction. And we can identify these a few different ways. We need to have clear responses off at least two levels. So we see 1 2 3. And these are levels where price just
[05:39] seemingly can't break through that area. Okay? And what we're seeing in this is areas where the supply is outweighing the demand. and demand is pushing prices up. Supply is the abundance which is driving prices down. And anytime we have
[05:51] we can see sort of these invisible levels where prices continue to have effectively give us that threshold where price cannot break through. Additionally, the third thing that we need as a unique identifier of what a
[06:05] something called break of structures. Okay? And this is how break of structures work. Let's say we have a trend this way and then we have a big push down. We have this point. Then we have a push up which is lower than this
[06:17] point. And then we have a candle push down past this lower swing point and make a candle close. Okay, that's confirming to us that price is breaking down making a lower low. And then when price comes up, fails to break over this
[06:29] giving us technically in this case we have a break of structure here, here, a lot more break of structures, but we at least need two breaks of structure in a trend in order to confirm that we have a lower low, lower high, lower low,
[06:43] structure, which gives us that downtrend. These are the unique identifiers of a trend. Step two, I'm always looking for unique identifiers. It could signal to me when a trend is potentially done, which effectively is
[06:55] allowing us to pick the very beginning of a potential new trend. If that's the case, we're in very early on a trend. If that's not the case, then we are always containing our risk. And maybe we can be wrong, but the goal is to position
[07:07] early in a trend. So that's what we need to be able to figure out, knowing signs of when a trend could be ending. Let's look back at our other example. And what I'm looking for primarily is a candle close outside of the contact points. So
[07:20] we have our contact points here. You can see we get a big candle push from this contact point on the trend and a close above. Also, this is important thing to mark. Notice how we have a push down, a push up. This area fails to break a new
[07:33] low under this area. And then we have a push over this contact point on the trend. This is a perfect setup indicating that the demand is starting to outweigh the supply causing a big candle to push out of this area that
[07:46] previously couldn't get broken. And now we're changing the characteristics of the trend as well as indicating based off of us reading supply and demand that And what we're using for a unique identifier is something called a change
[07:59] in the current trend where we're having pushes producing lower lows or higher highs. And then once we fail to break a lower low in this case and we have a push up over this contact point, that's what we call a change of character. And
[08:12] change of character. The third thing that I'm looking for is something called the confirmation of a FVG, also known as a fair value gap. Okay? And what constitutes as a fair value gap is when we have a sequence of three candles. 1 2
[08:26] three candles where the first candle's high wick doesn't overlap with the low of the third candle's wick. And the area in between here is going to be our fair value gap. You'll also notice how I have a dotted line at the 50% mark of this
[08:39] fair value gap. This is a level called the consequential encroachment line. I'm not going to get into that too too much, but just understand this 50% level in important. And this is what I'm looking for produced in order to take one of
[08:51] these situations seriously. If this candle just pushes up and then immediately fills back down on the next candle, this is not a proper setup and strength that I want to be able to play into. Step three of this process is
[09:04] actually positioning to capitalize on this potential move in a different trend identify the characteristics of the trend, how to find important levels, waiting for a break. Now, how do we position ourselves around this? This is
[09:17] the core of my simple process. All right. So in this circumstance, prices pushed up, created a fair value gap, created our change of character. So now what I'm doing is positioning my entry at the 50 point of this fair value gap.
[09:29] I'm placing my contained risk, if I'm wrong, below this swing point over here, sometimes below the fair value gap producing candle. But really what I want I'm seeing that price sort of can't break through here. So I'm going to use
[09:42] that as sort of my buffer and place the stop outside of critical areas. And for now, I'm just putting my takeprofit 4x what my risk is at a starting point. But this will sort of move dynamically depending on if we get confirmation and
[09:54] the trade. So step two of this process, assuming that I am in a successful trade stop-loss. Now, because we have our changing character here, the next move
[10:06] off of a push up, a pull down, notice how price responded off of this area. Only barely went through it for moments, but never closed into that area. this trend level and then continued making a high. If we look at this as our
[10:19] first high of that push, price coming down. As soon as I see a candle close above that swing high, now we have a new break of structure one. This is effectively confirming to me that now we are in the beginning of a new potential
[10:33] structure. And so what I'm doing is completely reducing my risk at this new we get a nice push in our direction, close over this swing point. Now, you can see I've reduced all of my risk from before down to zero, put my stop-loss
[10:48] level at my entry, and now we have a risk-free trade, allowing for this trend as it moves in that direction. Okay? And so, the third step of this process is really important, and that is to take profit at high probability reversal
[11:01] areas. There are two big things that I look for. This is where it gets somewhat bit differently. I'm going to show you the two ways that I use here in just a first. I want to look at this now on a dynamic chart. Make sure that all of the
[11:14] market mechanics are making sense before we go into the next step of actually and get the most amount of profit possible. So, let's take a look at our View. If you're brand new to trading, I have a referral link in the description
[11:27] I'm charting on and doing all of my analysis on. Okay. So, I want to explain identify these areas. And you're going to see these popping up in a lot of have sort of that invisible line level here produced here, here, here, multiple
[11:43] again how we have an actionable break below that area. Price comes up and lo and behold, this is the exact last area that price tests into before having a really really big sell-off. Also, if we look at exactly what that pair is up
[11:57] responded to, didn't have a close outside of before making a push to the show up a lot of places, and this is going to remove a lot of confusion. Instead of just looking at a blank chart like this with candles flying around,
[12:11] now you actually have really, really good ways to start picking and isolating very important high conviction areas. But importantly, we're going to see that at this low point, price didn't come up and produce a new break of structure.
[12:23] Okay? Price broke down, pushed back up, and then broke underneath this level. So effectively as the price is closing below here, this is technically on this uptrend our change of character level. So we get a push down, another push back
[12:35] up, another push down. Now we have confirmation of a break of structure. new confirmed downtrend. We have multiple contact points here. Then create that break of structure. Instead made a significant push out of this area
[12:49] that price couldn't break out of. Created our fair value gap. So we set up our position. price responds off of the opposite side of this trend, sort of has a close, breaking out of this previous area. This is where I'm
[13:02] reducing my risk to break even, risk-free trade. Now, on this trend, you contact points along this low. So, this is the low portion of the trend. And you can sort of see price comes back down, almost contacts that perfectly. Then, we
[13:15] see price chops around, comes back and forth, doesn't come back down to our positive uptrend. We have our break of structure formation here. At this point, after we have a break of structure, a pullback, price fails to break over this
[13:28] level. And you can see at this point, we have a confirmation of our change of can see we're starting to contact this finally get a break of that level. Like I said, I'm going to get into timing
[13:41] here in a second. But just to show you once again, we have our failed break of structure. Break of structure one, two, change of character underneath this area. See how inside of this trend level even this fair value gap was a little
[13:54] decently respected. We wouldn't take this as a trade opportunity but just to contact with this lower point of this trend profit at the midpoint resistance area stop loss outside of here. Set our position up to have 4x the risk. We have
[14:09] our new break of structure under this area which would make it so that we can move our stop loss to break even. And you can see from here we can play into have a very very intentional way to enter into the market. But the question
[14:22] is once we get these moves, where do we actually exit the trade? Now this is I'm going to show you the two main things that I use and then what I sort traders kind of making their own decisions. Okay, so the first thing that
[14:36] I like to look at for my take-profit plan is figuring out two critical areas. The first is going to a higher time frame. So when I'm day trading between the 1, 3, or 5 minute, I like to look at the 15minut chart. But basically just a
[14:48] chart that is on a higher time frame than what you're trading. All right? And looking for important high impact fair value gaps. So you can see in this example here as price is moving up. If we look at our whole entire trend level
[15:00] here, we have fair value gaps here up here of course but into resistance. This The next thing that I'm looking at is something called a 61.8 Fibonacci level. more advanced. I'm going to show you simple ways to be able to look at this
[15:15] on Trading View in a second. So stick with me. What I'm also doing is taking this Fibonacci tool and clicking from the base of my trend down to the last point of this whole trend, which is going to give me these values. 23.6,
[15:27] going to give me these values. 23.6, 38.2, a 50 value, 61.8, and 78.6. Okay. And these are retracement values that are often times responded well as it pertains to pullbacks and then continuations in markets. Okay. So
[15:40] additionally, if I drag my fib from the start to the bottom, and I see that even on the previous price action, we have areas where price is responding well off of these levels already, that could indicate to me that in the future, as
[15:52] we've seen here and here, that price is likely to also respond. And this golden ratio, 61.8, is particularly important. And in this case, we're seeing that it matches up into the same zone as this high impact 15-minute fair value gap. So
[16:06] I'm kind of looking for harmonies like this. And we can see in case of this example, if I go to a 15-minute chart, if I draw out my fair value gap, and click on this tool here, Fibonacci retracement tool, and click from the
[16:18] highest point down to the lowest point as price starts to trade higher and higher, we see a heavy response off of 61.8 into the midpoint of this fair value gap in a reversal, which basically gave us exactly almost 1 to four. Now,
[16:31] if our take-profit was able to be a little bit tighter, we can get five or trade. But for this case, almost four times our risk before having that be the this current new trend. And if we look in the case of our next example where we
[16:46] have price break underneath, retest the midpoint, break of structure here, risk reduced to break even. If we take the Fibonacci from this trend high to this area, first push up that we had with our risk reduced to zero. Had that have
[16:59] zero risk on the table. But in the case where we have a really, really quick push down, we really don't have any fair value gaps until this whole entire chunk of move happens, in which case our next fair value gap is right here with the
[17:12] midpoint right here. So you can see price continues to move way past that can be somewhat subjective, but even off of our initial risk amount, this is giving us 6.5 times what we were risking while being able to identify key areas
[17:26] into the market and letting the winners run. Sometimes what I'll do is walk my stop loss in trailing the each individual fair value gaps on these big runners. So that would come up to this candle here where you can see there's a
[17:38] small fair value gap which kind of allows me to trail my takerit further more out of my positions. Okay. But most importantly, this is going to be depending on the market that you're trading, depending on the time frame
[17:51] that each person is going through and seeing over time what is the best you, that makes sense with you, and allows you to be able to hold these trades a lot longer. There's not one simple all-purpose solution to actually
[18:05] doing this. It's about figuring out where you tend to get into the markets, time if you say, had I have done, you know, this one or this one or this one, period of time? And then effectively, you're just reverse engineering your
[18:18] kind of the confluence. It works with your edge and how you're trading the dependent of each person. Okay. So, now let's take a look at a live example of see right here, we're noticing immediately a few things. I have my
[18:33] a fair value gap which I also traded the trade before. I'll show you in a second. Displacement candle pushes out of that trend level creating this fair value gap. Price pushes back into that. That's exactly where I got my entry. I have all
[18:46] new trend being established here. move. Once we break over that high, I'm reducing my stop-loss level to break even. Letting my winner run. And you can
[18:58] see I'm up about six or seven risk factors on my trade already at that point. And then when price comes up to my take-profit level that I've found that's where I can take the trade off the table. This was a little bit lower
[19:12] these levels hadn't yet been broken. But you can see I placed my entry below this sweep level into a high actionable change of character fair value gap. And level. You can see right here, price starts moving in my direction. All
[19:26] the profit off of the table. Okay. And higher time frame fair value gap. Trading is not a fairy tale land with going to be a lot of losers a lot of times where these trades don't
[19:40] was trying to place fibs. I was trying to find trend areas to see if I could sort of frontr run the breakdown of this sort of big push. So, I took my entry response, and then price eventually moved up and triggered my stop-loss
[19:54] order, in which case I took a contained risk, walked away from the trade, trade, but that doesn't make it a bad live, I'll put more videos here where you can see me live trading. If you want
[20:06] you're more advanced, I'll also put a playlist right here for you. If you're button, subscribe if you want to know when I drop new videos. Let me know in most helpful. I appreciate you guys. Until next time, I will see you all in
[20:19] Until next time, I will see you all in the next


⚡ Saved you 0h 20m reading this? Transcribe any YouTube video for free — no signup needed.