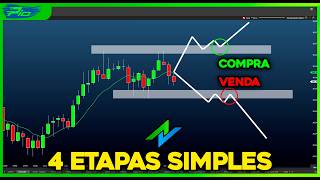

The 4 Pillars That Made Trading Easy
42sDirectly addresses a common pain point and promises a simple solution, making it highly shareable for aspiring traders.
▶ Play Clip"Delivers a solid, actionable strategy framework, though the title oversells 'simple' with a lengthy, detailed walkthrough."
The video presents a systematic day trading strategy built on four fundamental pillars: direction, confirmation, entry signal, and entry point. The creator demonstrates how to construct, backtest, and manage a complete setup using specific indicators on the 1-minute timeframe for the mini-index, emphasizing objective logic over guesswork.
Every objective strategy for success needs four fundamental pillars: direction, confirmation, entry signal, and entry points. These provide structure and logic to trading.
The strategy is applied to the mini-index, the most traded asset in day trading, using the 1-minute timeframe.
Use the Pivot Point indicator to determine price direction. If price is above all lines, uptrend; below all lines, downtrend; between lines, sideways.
Use CCI Histogram with 610 periods to confirm direction. CCI above +100 confirms uptrend; below -100 confirms downtrend, filtering false signals.
Use Donchian Channel (period 20) as entry trigger. Price breaking upper channel gives buy signal; breaking lower channel gives sell signal.
Use 8-period exponential moving average as entry point. In uptrend, price often bounces off EMA as support (buy); in downtrend, EMA acts as resistance (sell).
Backtesting determined a 120-point target and 240-point stop loss works best. This risk-negative profile yields higher success rate.
Daily positive goal is two consecutive wins (240 points). Daily loss limit is one stop loss (240 points). This balances the risk-reward ratio.
Backtests over recent months show strategy works: December had 15 wins and 4 losses; November also positive; October had more stops but still over 1000 positive points.
Refinement: only take buy/sell orders when the moving average is also above/below all pivot point lines, avoiding entries when EMA is between lines.
Strategies require monitoring and updates. Update criterion: if strategy fails to close two of last three months below target or two consecutive months negative, pause and update.
The PSAR 3.0 training program offers ready-made strategies (PSAR 100, 200, 300, 400) and robots, with team monitoring and updates via Telegram.
The four pillars transform strategy creation into a simple, replicable process, enabling traders to move from guesswork to evidence-based decisions. The video provides a complete, backtested setup and emphasizes the importance of monitoring and updating strategies to adapt to market changes.
What are the four pillars of an objective trading strategy?
Direction, confirmation, entry signal, and entry point.
00:02
How do you determine price direction using the Pivot Point indicator?
If price is above all lines, uptrend; below all lines, downtrend; between lines, sideways.
02:19
What is the purpose of the CCI indicator in this strategy?
To confirm the direction indicated by the pivot point, filtering false signals. CCI above +100 confirms uptrend; below -100 confirms downtrend.
03:39
What settings are used for the CCI indicator?
Period 610, with horizontal lines at +100 and -100.
04:18
How does the Donchian Channel generate entry signals?
Price breaking the upper channel gives a buy signal; breaking the lower channel gives a sell signal.
06:31
What is the role of the 8-period exponential moving average?
It serves as an entry point: support in uptrends (buy) and resistance in downtrends (sell).
09:08
What target and stop loss were chosen after backtesting?
Target of 120 points and stop loss of 240 points.
15:12
What is the daily positive goal and daily loss limit?
Daily positive goal is two consecutive wins (240 points); daily loss limit is one stop loss (240 points).
15:50
What refinement was made to the entry point rule?
Only take buy/sell orders when the moving average is also above/below all pivot point lines.
19:29
What is the update criterion for a strategy?
Pause and update if the strategy fails to close two of the last three months below the expected target or closes two consecutive months in the negative.
22:02
Four Pillars Framework
Provides a clear, structured approach to building any trading strategy, making it replicable.
00:02Pivot Point Direction Reading
Simple rule-based method to determine market direction, easy to apply.
02:19CCI Confirmation Filters False Signals
Shows how confirmation reduces false entries, improving strategy reliability.
03:39Backtested Target and Stop Loss
Demonstrates evidence-based selection of risk parameters rather than arbitrary choices.
15:12Strategies Need Monitoring and Updates
Emphasizes that no strategy works forever; regular review is essential.
21:34[00:02] extremely difficult for me. Until I discovered that every objective strategy for success needs to have four fundamental pillars. And when I understood that, I started building strategies, man, with method, with logic, and with a
[00:15] structure. So today I'm going to develop a complete strategy with you from scratch using these four pillars. And without beating around the bush, these four pillars are: first, direction so we know where the price is
[00:29] going. Secondly, confirmation is needed to validate whether or not it is worthwhile to operate in that direction. Third, an entry signal for us to identify the best time to pull the trigger. Fourth, entry points to determine where to position
[00:44] the order. These are the four pillars that every good day trading setup should have. every good day trading setup should have. Come with me, man.
[00:58] define the asset we're going to use this strategy on, and also the for the mini-index, because that's the asset most traded by people in day trading. And I'm going to use the 1-minute timeframe because that's the
[01:13] timeframe I most enjoy developing strategies on, okay? So, with that defined , let's move on to the four pillars. First pillar, direction. This is the first pillar of any objective strategy. And there are several ways to
[01:25] identify the direction of the price. We can use color patterns, indicators, moving averages, but today, man, I want to create a strategy using the Pivot Point. So, let's go , man. Go to indicators, more
[01:38] pivot, it will appear here for you, look, the pivot, insert it into the chart, click OK. Now you can double-click on the Viv Point and, dude, it changes all the lines to purple. So come here, look at line one, change it and look at this purple color. The
[01:51] same thing happens on line two. Look, the pivot point changes here too, look at the purple color. Next, come in levels and changes that look at the Leandro Storm method. Enter the level 55, click add. Now remove the
[02:04] 61.8 level and the 100% level, then click OK. Hey man, we're going to read the price direction in a really simple way. If the price is neither above nor below all the lines, as is the case here, it means
[02:19] we are in a sideways movement. So, in this case, we have a lateral direction. Now, if the price is above all the lines, then it means we have an upward trend. And of course, when the price is below all
[02:34] the lines here at the Pivot Point, as is the case, look closely here, it means that we then have a downward direction. So it 's pretty simple, man. If the price is between the lines, it means we have a sideways movement. If the price is
[02:48] above all the lines, it means we have an upward trend. If the price is below all the lines, it means we have a downward trend. Beauty? Okay, so we have our first pillar, right? The strategy we
[03:01] 're creating, the direction is based on the pivot point, okay? Second pillar, confirmation of direction. Dude, we need some way to confirm the price direction, because sometimes this kind of thing happens. Look, you notice that the
[03:14] price went below all the pivot point lines, so we would consider it a downward trend, but it quickly went back up. In other words, we had a false signal here, another false signal here, look. We had another
[03:27] false signal, but up here, because the price was heading upwards, but quickly returned inside the pivot point lines. In other words, we need confirmation to avoid these false signals as much as possible. And
[03:39] we can use various indicators to confirm the direction, such as slow stockhock, MACD, and flux diffuser. But I want this strategy that we're creating together to be simpler, cleaner. So let's use
[03:52] simpler, cleaner. So let's use the CCI Histogram indicator with 610 periods. So I inserted the CCI indicator here on the chart, at the bottom, and click on a horizontal line and
[04:04] Double-click on this horizontal line, place it here, look, at the 100 level, look, price 100, in appearance we can set the color to green. Now we add another horizontal line to the CCI, double-click on it. In this position,
[04:18] we place this horizontal line at -1. In terms of appearance, we can use the color red. And now, to finish up, let's double-click on the CCI indicator and change it here, look, the period is set to 610. Done. Hey man, the reading is pretty
[04:30] simple. When the indicator goes above the 100 level, we will believe in a buying trend. And of course, when it goes below the -1 level, we're going to believe in a selling pressure. So, how do you read the CCI along with the
[04:47] Pivotbridge indicator? Here's the thing, the first pillar is the price direction. So, if the price is above the pivot point, as is the case here, it means we have an upward trend. If the CCI is above 100, it means we have
[05:00] confirmation of the upward trend. And that means we can believe in all this upward movement here, right? As part of our strategy. the direction, and the second pillar, which is the confirmation of that direction. And it's also
[05:13] clear, right, man, when the price goes below all the pivot point lines, as is the case here, we're going to have the first pillar indicating a downward direction. If the CCI is below -100, as is the case here, then we have
[05:26] confirmation of the downward direction. In this case, then, we can believe in the downward direction as long as the price is below all the pivot point lines and as long as the CCI is confirming this downward direction.
[05:38] Beauty? OK, man. We now have two solid pillars. Let's move on to the third pillar. Third pillar, entry signal. Look, now we need a trigger, something that tells us exactly when we should consider opening a
[05:52] or a sell. So, when we see that entry signal on the chart, we know that it's a moment when the opportunity to buy or sell becomes real, you understand? And for that, man, we can use the indicator
[06:07] that's in my top five favorites, which is the Doncha Channel indicator. So, we come here, look, indicators, more indicators, search for Doncha, we insert this indicator into the chart, click OK. Here is the Doncha channel indicator
[06:19] . Double-click on it, remove the central average, go to properties, put it here, look, D1 offset, keep the period at 20 months. Click OK. Man, this indicator is amazing. As I said, it's among my
[06:31] top indicators. And the idea behind this indicator, man, is this. When the price starts to break through the lower part of the Doncha channel, it means that we have downward momentum, in the direction of the price drop. This generates
[06:46] a sales signal for us, you know? A sales trigger. Now, from the moment the price starts to break through the upper part of the doncha channel, as is the case here, look, we can start to believe it's a
[07:00] buy signal. So we have purchase triggers, you understand? And if you look at this indicator on the chart, you'll notice several times that this indicator works very well as a trigger, as an entry signal, both for selling and for
[07:15] buying. And if we combine this indicator with the pivot point and also combine this indicator with the CCI, we can create an excellent strategy, such as here, look, price below all the pivot
[07:30] point lines, that is, the first pillar, downward direction, CCI confirming the downward direction, because the CCI is below -1. Confirmation of the downward trend, second pillar. Third pillar, entry signal. Look at the price tag assaulting the lower part
[07:44] of the Doncha canal. Dude, this is an input trigger, it's an input signal. We realize that we might be believing the sell signals, because the price is showing strength. He's hitting, he's attacking the
[07:57] lower part of the Doncha canal. So, if you put these three pillars together, you already have a very strong structure, man. In this case, on the sales side, you can trust the sales signals, you understand? And of course, man, there are going to be
[08:12] graph, this is going to happen. Look, the price will go above all the pivot point lines. First pillar, upward direction. CCI above 100, which is the second pillar, confirms the upward trend. And look at the price tag assaulting the
[08:28] upper part of Donch's face. Look, purchase triggers, purchase signals. In this case, we might be believing in the purchase operations, you understand? Because we have three pillars working in favor of the buyer. So, man,
[08:42] you realize that we're putting together a coherent strategy. We're almost there, almost at the end. We already have the direction, the confirmation, and the entry signal. There's only one thing left to do now: where are we going to buy and where are we going to
[08:56] sell? That's where the fourth pillar comes in. Entry point. This, my friend, is the fourth and final pillar. And, dude, as an entry point, we can simply use an eight- period exponential moving average. Look, with
[09:08] displacement D1. I'm going to put this moving average in green. Wow, Pi, but why use an eight-period moving average , man? It's very simple. Within a good upward trend scenario, right? A buying scenario, man, the
[09:21] moving average will provide some nice support. That's when we have a in a buying scenario, the price will often find support at the moving average. We can buy there, the price will go up again, hit
[09:36] support, buy there, the price will go up again. This often happens if we have a well-defined buying scenario , you understand? And of course, when we have a well-defined selling scenario , the eight-period moving average
[09:50] can be used as resistance, as an entry point, in this case, for selling, you understand? The price holds up well in this region within a sales scenario. So the price, look, many times it will go up, it will encounter resistance,
[10:02] that the price will fall again. It's back at the eight-period moving average, we're resistance, believing that the price will fall again. And this, man, tends to happen over and over again within a good sales scenario, you know?
[10:17] Pio, but how do I find that good selling scenario and that good buying scenario? Wow, it's obvious, man, using the first pillar, which is the direction, the second pillar which is the confirmation, the third pillar, which is the entry signal,
[10:29] and that's it, that's how you can find a good selling scenario and a good eight-period moving average as an entry point. Let's start, man, with a buying scenario. Check out this auction here, man? This is the trading session of
[10:42] November 26, 2025. Initially, the price was between the extremes here, look, of the pivot point lines, meaning we were trading sideways. Next, the price, look, it went above the pivot point, right here. So, man, we
[10:56] have the first pillar. Alright, man? Furthermore, if we look here, at the bottom of the page, we'll see that the CCI is above the 100 level, which is the second pillar, confirming the upward trend. So, I'll put it here, look,
[11:09] second pillar, confirmation of the upward direction. And if we look here, man, which is the entry signal, because the price is touching, look, the upper part of the upper part of the Doncha channel, showing us, man, there's a
[11:24] buy. So, here we have, look, the third pillar and the fourth and final pillar, man, is that we are buying, so when the price returns to the buy, it returned here, we buy, it returned here, we buy, until
[11:38] we reach our daily positive target, you understand? So, in these situations here, look, where the price has returned to the moving average and we use it as support, it means that we have the fourth and final pillar there. Hey, look, does what
[11:51] I'm showing you in this graph make sense? We have the pivot point to the CCI to confirm its upward direction, the doncha channel to show the entry signal, and the moving average as an entry point. We created, man, a
[12:05] strategy based on logic, an objective logic, right? This is a buying scenario. Let's take a look now at a sales scenario. Well, man, in a sales scenario you just have to reverse the situation, right? This is the trading session
[12:18] from December 9th, for example, right? And here, look, the price was initially between the extremes of the pivot point lines, meaning that initially we had sideways movement until the moment when the price went below all the
[12:31] pivot point lines. In other words, here we have the first pillar, OK? And if you look at the footer, you'll notice that the CCI went below -100. This means that we have the second pillar, which is the confirmation of the direction from below. And if
[12:44] we look closely, man, we'll realize that the price is hitting the lower part of the doncha channel. This means that we have the third pillar, which is the input signal. Canal de doncha is telling us that we
[12:56] have a sales opportunity, we have a sales signal. So the fourth selling here, look, when the price returns to the moving average, because now we can use the moving average as resistance and we will sell at the
[13:10] moving average until we reach our daily positive target, understand? So all these entry points that we had in the moving averages are called the fourth pillar. So, once again, man, you realize that we're creating a
[13:24] setup together here, following an objective logic. Okay, man. We now have our complete strategy, right, with the four pillars: direction, pivot point, CC confirmation, histogram, signal,
[13:37] doncha channel, entry point, eight-period moving average, setting target, stop, and risk management. Now that we've created the strategy together, we need to determine the target, the stop loss, the daily goal, and the daily loss limit.
[13:51] Let's start with the target and the stop loss. Dude, in my strategies, I figure out the best target and the best stop-loss through trial and error. What do you mean , Pi? For example, man, I like to use a 240-point stop loss and a 120-
[14:04] point target. So, I run several backtests, testing this stop loss and this target. I go back several months and see if the strategy would work well that way. In this case, with a 240-point stop loss and a 120-point alpha. And I can
[14:19] test, man, several other scores to see if it works. For example, here we have a 300-point stop loss and a 200- point target. It's another scoring system that I also like to use in my strategies. So I go back to the
[14:32] chart and test to see which combination of stop-loss targets works best. That, man, is obviously a matter of personal preference. You know that my operational profile is not geared towards operating with a risk- positive return. I don't like to trade
[14:45] with a target larger than the stop loss because the success rate decreases. I like trading with a risk-negative return because I have a higher success rate. This is my operational profile, okay? But if you operate differently, you can,
[14:57] of course, create your own strategy with a different target and stop-loss than I use. Okay, man. I've been backtesting this strategy over the past few months, and I've noticed that the 120-point target and the 240-point stop-loss work very well.
[15:12] So I've already determined that the target for this strategy will be 120 points and the stop loss will be 240 points. Based on this , man, now I can define what the daily positive goal and the area loss limit will be. So let's go,
[15:25] man. Let's talk about the goal and the daily limit. If I have a target of 120 points and a stop of 240 points, it means that my stop is twice as large as my target. So, in order to protect myself from this risk of
[15:38] negative returns, I need to have a daily goal and limit. Anyone who follows the channel knows that I do the following, man. In strategies where the stop loss is twice the target amount, I use a daily positive target of two consecutive wins,
[15:50] meaning two wins and 120 points. In this case, 240 points. In other words, when I hit my daily positive goal, I will always score 240 points. And my
[16:02] daily loss limit, man, is this : one stop. If I get a stop loss, man, I'll stop trading. If you've been following me on this channel since 2018, you know that I always accept only one stop loss in all my strategies. So,
[16:15] in this case, folks, the maximum I'm willing to lose in a day is 240 points. So, even if the target is twice the stop loss, when I win, I will always make 240 points when I hit the daily positive goal.
[16:30] And when I lose, the worst that can happen is that I also lose 240 points. That way, man, we can even the score, you know? So, this is the risk management approach I like to use. It doesn't mean you
[16:43] develop your strategy based on these four pillars I've shown you today, in your own way and with your own risk management, understand? This is my risk management approach. Doing the backtest, okay? I
[16:57] that worked best for me were a target of 120 points and a stop-loss of 240 points. I've already shown the daily goal and the daily PD limit. So now I'm going to do another backtest to validate if this daily goal, this
[17:12] daily limit, is OK. I'm going to go back to my chart from the last few months and test this strategy month by month, following the rules to the letter, okay? And after I rules to the letter, okay? And after I do that, I'll come back here with you all.
[17:34] December up to today, which is December 18th, okay? And in December, so far, we've had four stop-losses and 15 wins, okay? We're now going to do the wins, okay? We're now going to do the backtests in November.
[17:53] November too. What I can say is that it worked well in November too, okay? I'm not going to hand you the results on a silver platter , man. Test this strategy yourself, do your own backtesting, see if it makes sense
[18:05] or not. And of course, always respecting the goals and limits. One daily positive target wins. I'm going to do the October backtests now.
[18:21] man. And in October we had significantly more stop-loss orders than in November and December, but it still closed with over 1000 positive points. I'll continue you, man, I'm not going to hand this over to you on a silver platter. Do your
[18:35] own backtests, okay, man? Draw your own conclusions. Keep marking gains. So, for example, here, look, you had two green arrows here, meaning you hit a positive area target. Then you go to the next trading session.
[18:48] order wherever you find the signal. If you realize that a stop loss would be triggered there, you go and put a red arrow to mark the stop loss. Then you go man. Then, after you finish
[19:01] doing the backtests, you zoom out from the chart, look at it, and count each stop loss you had, each profit you had, you understand? He's been doing this for at least the last six months here. I'm going to do the backtesting here, but of course, I repeat, I'm not
[19:13] want you to implement the strategy on the chart yourself and test it yourself so own conclusions. I've given you all the tools, now it's up to you, buddy. Well, man, I finished the backtesting, but I made an adjustment to that strategy.
[19:29] I'd like to discuss this with you. For us to buy using this strategy, it would be like this all the Pivot Point lines. You know the upward trend is going in, the CCI is above 100, so you have confirmation of that upward direction. The price
[19:43] Doncha channel, you know you have a buy signal, but now, man, the buy order on the moving average if the moving average is also, look, above all the pivot point lines. If the moving average is also above
[19:58] can buy. Now, if the moving average is between the pivot lines, then you shouldn't buy. You'll wait for the moving average to go up before you start entry point is like this. So that was the change, man. It's a very subtle change,
[20:12] So for example, here too, look, initially the price was between the Sideways movement here, it went down, look, the price went below all the pivot point lines. Further ahead here, the CCI confirmed the downward direction, but
[20:28] sell order here, look, at the moving average, because the moving average was between the Pivot Point lines, from the moment the moving average went below the can place your sell order at the moving average, using it as
[20:43] also do this because the price, look, touched the bottom of the Doncha channel, thus demonstrating a sell signal, okay? And then you would use the moving average as resistance. As I said, it's a subtle change, but it's very important
[20:56] based on the backtests I've done. Okay, man. Backtests have been done, and that gives me confidence that we're no longer operating in the dark. We have a setup based on concrete evidence. We have evidence that the
[21:09] logic we've put together in the graph tends to work. And the next step now would be for you to test this strategy in market replay. If you like this strategy in market replay, you can then switch to a
[21:22] real account, if you wish, with a few mini- contracts to test the strategy and see if it actually matches your trading profile before deciding to increase the number of contracts. Beauty?
[21:34] Monitoring and updates. Listen, it's crucial that you understand one thing: any and all objective strategies require monitoring and updates. So, no matter how good the strategy we want
[21:47] today is, at some point, it could be in two months or two years, it will start to perform poorly because the market changes, the flow changes, the natural. That's why you need an update criterion in the
[22:02] Pilsar 3.0 method. Hey, we use the update criteria that's currently appearing on your screen. So, if the strategy, for example, isn't to close two of the last three months below the expected target or to close two
[22:15] consecutive months in the negative, then we pause the strategy and immediately move on to updating it, because this ensures that you never operate with a dead strategy, a strategy that is performing poorly. So you
[22:30] need to have a criterion to identify when update it. Of course, right, man? I know that not everyone has the time or technical knowledge to create objective strategies from scratch,
[22:43] backtest them, monitor their monthly performance, and update man. That's what the PSAR 3.0 method is for. Within this training program, you will find ready-made strategies, such as Pilsar 100, 200, 300, and
[22:59] Pilsar 400, which will be added soon. We also have the Pilsar 1 and 2 robots, and soon I will also add the Pilsar 3 robot to the training, which operates automatically, OK? You have follow-up on the strategies, so
[23:14] my team and I follow and monitor the strategies and updates, man. So when a strategy starts to perform poorly, we notify you in the Telegram group and provide you with an update. In other words,
[23:26] you'll receive my portfolio of strategies ready-made, already tested, validated, and constantly updated, okay? The description of this video contains a direct link to the Pilsar 3.0 method. If the spots are currently full,
[23:40] you can join the waiting list, OK? When the next class opens, you will be notified. Well, buddy, you just saw in practice how the four pillars transform the creation of objective strategies into something simple and replicable.
[23:53] Wow, man, when you have a clear direction, confirmation of that direction, an entry signal, and an exact entry point, you stop trading based on guesswork and start trading with a method, with logic, with evidence, OK? Together, we created a
[24:07] complete strategy, tested it, validated it , all following an objective process. Now it's your turn, buddy, to apply these four pillars to your helped you, please leave a like
[24:21] notifications activated, because I won't rest until you become a successful trader. I'll be staying here, man, and see you in the next video. Go! here, man, and see you in the next video. Go! [music]

⚡ Saved you 0h 25m reading this? Transcribe any YouTube video for free — no signup needed.