
New Traders: Stop Using Indicators
45sChallenges common retail trading advice, sparking curiosity and debate.
▶ Play Clip"The title promises a new trader's guide to studying and practicing, and the video delivers exactly that with concrete concepts and a live trade example."
This video introduces new traders to the ICT (Inner Circle Trader) methodology, focusing on how to study price action by identifying liquidity pools, order blocks, and high-probability entry points. The core concept is that markets move to collect stop orders above old highs and below old lows, and traders should think opposite to retail strategies.
The module covers liquidity raids, stop runs, liquidity pools, ICT order blocks, high-accuracy entry points, low drawdown tactics, targeting, scaling profits, and making money when wrong.
Price action patterns repeat across all timeframes; the same formations can be seen on higher or lower timeframes.
Equal highs and lows are the most obvious price points. Retail sees them as support/resistance; institutional traders see them as liquidity where stops reside.
New traders should spend one full month studying double tops and double bottoms on a 15-minute chart without trading, marking them as 'buy stops' above and 'sell stops' below.
New traders should aim for 20-30 pips per week to develop patience and discipline, stopping after reaching the weekly target.
The ICT optimal trade entry uses the 62-70% Fibonacci retracement level to enter shorts, targeting 10-20 pips below equal lows.
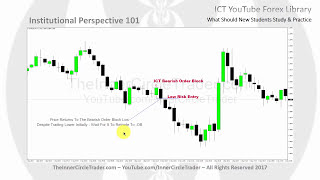
A bearish order block is an up-close candle that forms in a context where price is expected to move lower; price often retraces to its low, providing a low-risk entry.
In the example, the entry was at 1.1891 (low of the order block), targeting 1.1864 (20 pips below the equal low), giving a 27-pip scalp.
The trader entered with 3 lots, collapsed 2 lots at the first target (10 pips), and moved stop to breakeven, then scaled the remaining lot to lock in 20-25 pips.
The video demonstrates a complete short trade using ICT concepts: identifying a double bottom (sell stops below), entering at the bearish order block retracement, and scaling out profits. The key takeaway is to think like an institution, focusing on liquidity and stop runs rather than retail indicators.
What are the four reference points that make up price according to ICT?
Open, high, low, and close.
04:52
What does ICT mean by 'price is fractal'?
The same type of formation or setup can be seen on every time frame.
05:46
What do institutional traders see above equal highs and below equal lows?
Above equal highs: buy stops. Below equal lows: sell stops.
08:26
What is the recommended weekly pip goal for new traders?
20 to 30 pips per week.
12:20
What Fibonacci retracement level does ICT use for the optimal trade entry?
62 to 70 percent (62-70% retracement level).
14:23
What is a bearish ICT order block?
An up-close candle that forms in a context where price is expected to move lower; smart money sells short in that candle.
17:48
How many pips below equal lows does ICT target for a sell stop raid?
10 to 20 pips, sometimes up to 30 pips.
20:41
What is the purpose of scaling out profits in ICT trading?
To reduce risk and lock in profits while still holding a small position for further movement.
24:55
Only Four Reference Points Matter
Simplifies price action to open, high, low, close, rejecting all indicators.
04:52Equal Highs/Lows as Liquidity
Shifts perspective from support/resistance to stop order collection points.
07:2920-30 Pips Weekly Goal
Teaches patience and discipline, a realistic target for beginners.
12:20Bearish Order Block Definition
Provides a precise, low-risk entry point based on institutional order flow.
17:48Scaling Out for Risk Management
Demonstrates how to lock profits and reduce drawdown while staying in the trade.
24:55[00:00] Thank you.
[00:30] Hello folks, welcome back
[00:50] Alright, so we're embarking on a new journey for some of you And for those that have gone through my old vintage ICP tutorials these will probably be a little bit more
[01:02] user friendly and concise I did have the aim and goal in mind to make them as short, concise, as dense as possible
[01:15] with content but still not be so long in the time window I want the durations to be a little bit more manageable so that was the goal for this round of tutorials
[01:28] we're going to be talking about what should new traders study and practice.
[01:41] Okay, so what's going to be covered in this module? Okay, the ICT concepts used in this one are going to be the theory of liquidity rates or stop runs,
[01:53] introduction to liquidity pools, How to locate high probability liquidity pools Introduction of the ICT order block
[02:10] High accuracy entry points Low drawdown entry tactics probability targeting, the benefits of scaling profits, and how to make money
[02:25] when you are wrong. All these concepts and ideas are going to use in practical application but before we show you that it's important that I begin with a overview. When we look at price action as a new trader you're going to come
[02:45] into the marketplace, especially the Forex, because it's so exciting. It's fast-paced. It's a wonderful market. It's a beautiful market. It gives plenty of opportunities. You can be day trading it. You can scalp it. You can position trade it. You can swing trade
[02:58] it. It's absolutely phenomenal. I love it. To me, it's the best asset class today. However, like you, when I first got engaged in the study of price action for Forex, I quickly
[03:12] found myself doing a lot of things I shouldn't have been doing. And what's worse is I was an experienced trader from other asset classes, stock, bonds, commodities. And I did trade to currency markets by way of the futures market. So you would think having a decade
[03:30] of, or more really, of experience before getting involved in the foreign exchange market that I would have had a little bit better grasp on my emotions and my excitement. But that
[03:42] didn't happen because it's a 24-hour market. It moves around very liquid. And it's like a candy store for me. So I did a lot of things wrong, and I've learned over the years.
[03:55] And these videos are going to help you avoid a lot of those pitfalls. So we're going to cover an element of price action that I think is essential. and if you have no previous trading experience,
[04:10] if you've not corrupted your mind with the retail stuff that is promoted in the industry, you're actually in damage. Folks that have gone through trading courses and material
[04:24] are going to have some hardships with this. Not just with this teaching, but all of the ones I'm going to be teaching. the constant thing is I want you to think about the marketplace
[04:39] completely opposite to what retail teaches so retail is like Elliot Wave supply and demand harmonic patterns, animal patterns, all these things that you put on your charts
[04:56] they're all distractions, all you need to know is the open, high, low, and close. Okay, there's four reference points that make up price. And we make charts based on those four reference points.
[05:09] Now, we have an element of time that's a factor that won't be talked about in this module, but I will talk about it in coming lessons. But I want you to think about when, for instance,
[05:21] we're looking at this chart here. Now, this happens to be the day of this recording's euro dollar. Okay, it's a 15-minute time frame, and I want you to look at it, and maybe some things jump off.
[05:35] Maybe other things aren't so apparent or obvious to you, but I want to kind of change your perspective on price action. And I want you to focus in on areas in price action that doesn't make a difference what time frame you look at, okay, because price is fractal.
[05:51] Meaning that the things that you can see on one time frame, they can be seen on the lower time frame or the higher time frame as well. So it's a phenomenon that repeats itself. The same type of formation or setup can be seen on every time frame.
[06:07] So when we look at price or how I teach my students to look at price, I want them to first understand what makes the markets move. Without understanding that, your probabilities of being successful
[06:20] in developing yourself in a demo trade is highly unlikely, and you might as well forget about becoming a live fund trader If you can't do well in a demo, you're not going to do well on a live account.
[06:32] Everything that I'm teaching here should be done in the medium of a demo. All of my teaching is done in a demo, and that's just the best way to do it. It's put in the sandbox, it's risk-free, and you learn to develop good habits this way.
[06:48] So what do you do with a demo account? Well, before you even put on trades, I think that you should be studying price action like this. Okay I want you to think where everyone else trade idea would fail them Now think about that Because when you read books they tell you buy here sell here your stop here try to aim for this target
[07:16] Okay? So they're geared towards getting you into a move. And the stop losses are pretty generic. Below an old low, above an old high. I have started a new wave
[07:31] of free membership followers online, and they have shared their enthusiasm with the discovery of something so simple, but it evades most traders, even traders that have been trading for a long period of time.
[07:45] If you look at periods in price action where there are equal highs and equal lows, this is the easiest, most obvious price point to see in charts. Every time you see that, I want you to note that.
[07:59] okay, put a small little trend line horizontal, okay, and that's the only type of trend line I like, we're delineating previous points where it may equal highs or slightly higher or lower.
[08:12] It doesn't make a difference if it's exactly or if it's off by one or two pips. The general theme is if it looks close enough, then it's a double top or a double bottom.
[08:24] Now, retail circles will teach that these are good areas to trade off of as support and resistance. But institutional-minded traders think entirely different. They know what's sitting above those equal highs.
[08:36] It's traders' buy stops. And they know what's residing below the equal lows. Traders' sell stops. So the way institutional mindset is poised about looking at price action,
[08:51] they're looking for counterparties. They're looking for the opposite side of their trade. And so when everyone else is in the retail world looking for indicators to give them buy and sell points,
[09:04] institutions are actually thinking, where are the orders resting right now? And the easiest way I have learned to teach traders to start with, and there's other ways to do this, but as far as I'm going to go in the free content, this is the only one I'm going to teach.
[09:19] And it's a very simple one, and literally a five-year-old can see it in the chart. So anytime you see a double bottom or a double top, put a small little segment or a line above it or below it,
[09:32] delineating it, and put a notation of what it is. Above double tops on your chart, make a small little notation that it's buy stops, and below equal lows, sell stops. And I want you to study.
[09:44] Do not demo trade. Do not try to pick the direction. I want you to study it for one full month. Do nothing else. Pick one or two pairs, literally go through and watch how many times this phenomenon takes place.
[10:00] You can look at it on any time frame, but I think a 15-minute time frame is ideal because you'll see a lot of scenarios pan out. Now, I traded two markets today at the time of this recording. I sold short the dollar CAD and I also sold short the euro dollar.
[10:16] Okay, both pairs generally do not move in the same direction, But I knew there was a strong likelihood that the dollar CAD would sell off aggressively, and therefore any movement down in the euro dollar would be a suspect decline,
[10:31] and it would be reaching for sell-offs. So that's going to be the context behind what you see me do later on in this video that was a recorded trade. So as we're looking at price, I want you to take a look at this area right in here.
[10:43] Okay? We have equal lows, and price has already went above an old high, and broke down, and it found an area of consolidation. And this is the very consolidation that I taught you
[10:57] how to trade the New York setup for scalping. I want you to think about that. If this is a short, where could you reasonably expect the C price to go?
[11:09] Well, obviously, we would expect it to go lower, but targeting what specifically? Well, we know there's equal lows here, and I like to look at old lows and old highs
[11:21] and project 10 to 20 tips beyond those double bottoms and double tops. So in this double bottom, folks see that as support. Price comes down and hits it here.
[11:33] Retail-minded traders are going to see this rally up as a buy. I do not want you to think that. I want you to think the opposite. I want you to think that this whole scenario is just the market getting ready to sink
[11:46] and go lower and attack the sell stops that are below the marketplace here for those traders that have been fortunate enough to be long in all this movement, rode up to this high, but still did not take profits and have open positions,
[12:00] and their protective sell stops are going to be trailed up below these lows. So institutional-minded traders, they're going to see this as liquidity. The market will drop down 10 to 20 pips below equal lows,
[12:13] And that in itself, you need to be determining whether or not that's a trade that's viable for you. So what's a viable trade? I teach that my students as a new trader should think about 20 to 30 pips per week to start.
[12:28] And that's a very, very low threshold objective. It's easy to get. It probably doesn't feel that way now as a new trader, but I promise you over a few lessons, you'll see how very easy it is to find 20 to 30 pips over the course of a week.
[12:42] The problem is going to be your ability to refrain from trading once you get it. In your demo account, you should exercise patience and not do any more. Wait until the next week because this teaches two important and crucial elements to longevity in trading.
[12:58] Number one, it teaches patience. Patience, waiting for the next setup. Now, there's going to be a lot of gyrations in the chart that's going to draw your attention. You're going to want to do something with it. There's nothing wrong with paper trading it. In other words, making notations and saying, okay, I would hypothetically do this and hypothetically do that.
[13:12] but when you practice, practice with a demo account during one execution, manage it to get 20 to 30 tips for the week, and then stop. Don't do any more demo trading. And it also teaches discipline.
[13:26] So you're forcing yourself to follow rules. Everyone else is taught in the books to trade your eggs. Keep doing the same thing over again. While your hand's hot, play hard. That's just foolish.
[13:38] We're not gambling. We're looking for high probability scenarios and setups. So we have to understand what that is. So in addition to and a complement to the high probability shopping course,
[13:52] I'm using this first video to kind of like segue into a little bit more detail. I want you to think about what makes a price move. Prices move to levels where orders reside.
[14:06] Now olders reside above old highs and below old lows So if we see double tops and double bottoms our chart should be noted by this Notice there is an absence of any kind of indicator except for now the application of a
[14:23] Fibonacci. The Fibonacci is what I taught to use to get the optimal trade entry. Now what I'm going to show you here is the classic ICT optimal trade entry. 62 to 7 ounce at trace level, get short,
[14:38] look for an objector going lower. And here you can see how price did have several opportunities to get short at the 63% trace on level. Now finally expanded down hit the first scaling
[14:53] objective which is the old low. Same here. Then target one is hit, target two is hit, and then the semantical price went. Okay all of these levels are in agreement with running below
[15:07] these equal lows. So it's not the fact that the magic is done by the Fibonacci. The understanding is there's traders that have been going long here. Double bottom is going to
[15:19] have traders on their buy positions bringing their sell stops up. So the market's going to come back and grab those orders. The market does in fact correct all
[15:31] the sell stops and then look at the nice vault higher and price afterwards. This big response here is post-sell-stop rate. In other words, after the sell-stop has been gathered up
[15:44] and tricked, anybody that was wrong now has been knocked out. So if they bought here or somewhere in this run-up here, okay, they have been taken out. They can't capitalize on anything going higher.
[15:58] But what happens if you don't have the classic ITP, optimal trade entry on your chart, see miss it. What do you do? Well, if you don't get into that Fibonacci 62 to 79 certification level, as that
[16:12] balance occurs here, what are you left to do? Do you just let the trade go? No. Over the years, I've shared examples of me getting into a trade, and
[16:24] for those individuals that aren't really interested in learning from me, they're quick to point and say, well, that's chasing price. And you're going to see, just because we're not entering at the 62 to 79 cent level and we're getting in somewhere down in here
[16:37] that's not chasing price it's absolutely not chasing price and i'll give you a perfect example of it in this recording but i want you to think about what can we do as traders if we don't get
[16:50] this area up here because i first taught that this is where you should get in at the problem is over the years i've been inundated with emails stating that folks don't have the courage to get in and they want to get in, but many times they are too afraid to chase price because they heard
[17:04] me preach, don't chase price, don't chase price. My definition of chasing price would be once it breaks below the low here, then you are chasing price. It's gone too far, and you're too close to where the targets would be to be able to see
[17:18] a profit. Okay? So what do we do? Well, we can focus in above that low in this area right in here. I'm going to take you right into that area with a little bit more detail.
[17:34] So this is that section of price action. We just zoomed in. And I want you to look at this. The up candle right in here prior to this down move, this is what I refer to as a bearish ICT order block.
[17:49] Now, every up closed candle and every down closed candle does not make a order block. Okay, there has to be a context or a storyline behind why the price should be doing what you anticipate it doing.
[18:02] In this case, we think that the sell stops below the marketplace are going to be rated. Anytime we see an up-close candle, smart money will be in that candle selling short.
[18:15] But how can we use that information? Well, this very next candle, if you read the annotations on the chart here, price actually returns back to the bearish order block low.
[18:27] Okay, now we're to the low of this candle right here. Price is returning back to a great time of this candle's close. It hits that low. At that time, that's a low risk entry.
[18:39] Despite trading lower initially, we can wait for price to retrade back to the order block to get in if we know what we're looking for. So this retrade back to the bearish order block is a low risk entry point.
[18:53] Now, if the short is valid, this up-close candle will hold price below it until the targets are reached, or in this case, the sell stop that would be targeting below the equal lows.
[19:06] Now, notice also in here, as long as price is still above this low, this setup is staged properly to reach for the liquidity pool below this equal low that I noted a moment ago in
[19:20] the recording. Now as long as it's above this low, right here, the setup is still valid. But now I want you to think about this formation right here.
[19:33] This candle already starts moving lower. It went down to this point here and then started trading back up higher. At that moment, while you're watching price, right in here, that's when you time your entry. Notice that the candle is retracing right back to the ICT bearish order block's low.
[19:49] this up close candles low that is exactly when your entries made at the market
[20:01] institutional traders will short during up move now when price returns back to these up close candles we can be shorting it as well all right so now
[20:15] back to our example here. If we see that we can find levels that have double tops and double bottoms and the market will want to go through them, once this occurs
[20:27] chances are the market is going to go the opposite direction until it reaches another area of liquidity. So the market is always gyrating back and forth back and forth seeking liquidity above the marketplace and below the marketplace.
[20:40] below these equal lows, there's a specific range that I look for. It's 10 to 20 pips. Sometimes it can be as much as 30 pips, but I give a working range of 10 to 20 pips. So there's only two levels I'm looking for.
[20:53] It's not a zone. Exactly 20 pips below that low at $118.84, it's $118.64. Okay, very simple. Specific price levels, not zones, not ambiguous areas to try to figure out what's going on.
[21:08] it's exact, it's a science we know exactly what we're looking for but the problem is if we are expecting to sell short at that bearish order block at the low when it retrades back to it does this offer potential for us to take a trade Well we have an anticipated entry price at
[21:31] We have an anticipated 20-pick sell-stop rate price at $118.64. So now what we're anticipating getting in at $118.91 up here, which is the low of this up-close candle,
[21:43] and we already know 20-picks below these lows, So the lowest of the two equal lows is what I use. 20 pips below that, that gives us a range low of 118.64. So now we have two price points to determine whether there's enough of a range to make a profit.
[22:00] You take these two numbers and you minus them. 91 from 64 gives us 27 pips. So we have an anticipated range for profitable movement of 27 pips.
[22:12] That is enough to take a scalp. Now what I want you to do is I want you to watch me use everything that I just used here because this is what was going on in my mind before I actually executed and why I took the trade.
[22:31] Okay, folks. We're going to be doing a short. And I'm waiting for the trade to go back to the bottom of this candle here.
[22:44] So if it trades to $1.1891, I'll sell short. Not in a hurry if it takes off without me, that's fine. But I'm trading the bearish order block in here.
[23:01] All right, folks, so I'll be looking for that price at $1.1891. Since it hits it at market, I will go short. Now my stop has to be above the up-close candle or bearish order block, but because of the
[23:17] spread in this demo account it forces me to be 10 sips away, so I'm just going to elect to go with 1.1915 for my stop. Okay, it's about there.
[23:30] Fingers on the trigger, all I have to do is boom. Okay, now I'm short. My stop is just below 119.15.
[23:44] And I'm focusing my attention right below these equal lows because I want to see a sell stop rate. So I'm going to put my delineations on where that would be in terms of targeting. And just in case, I have my limit order lowered down to here.
[23:59] Okay, so if it goes down that low and it's not a stop run, I have a limit order to catch any accelerated price movement, but I'm really targeting that 20-tip run.
[24:11] So I have three lots short. I'm watching price. I want to see it trade below that short-term low that we're flirting with and then have a range expansion below there. So this recording is actually sped up for time purposes,
[24:27] but right now we're retesting the buys of the candles in the previous short-term low, and now I'm going to be looking for expansion on the down. side and it'll reach 10 pips and hopefully 20 pips it's about two minutes away from 830 new
[24:40] york time usually it's a big volume increase for volatility and i'm saying that we're up to collapse two of the three standard lots down short on euro and i'm watching waiting to see if price
[24:54] gets down to that second level or 20 pips okay it's already showing 10 pips of the decline As soon as it hits that lower level line, I'm going to collapse two of them.
[25:06] There you go. And move my stop down to plus one. Now I'm in a situation where I don't really care. But look at the entry points. Zero heat. No drawdown on that entry. No drawdown whatsoever.
[25:18] It was not chasing price. So I have two of these three sand lots banked. And now I'm watching price later on. And I'm going to be looking to lower the stop loss.
[25:31] And I may get lucky here and see a run down to that limit order. But always keeping in mind that I started the trade with the context of it being just a stop run on sell stops.
[25:45] So I want to be mindful of how much the price shows a willingness to stall or not want to go lower. And I'm watching price in here do that. So I've collected a small portion of the position also.
[25:58] Now here's the second time. taking something off a very small portion of the original three standard lots on. Now it's a small little fragment of the position.
[26:11] Price does one more attempt to break lower. Again, now it's 10 o'clock. The time has passed. About an hour and a half has gone by. And at this time, I'm watching price.
[26:24] I do not want to see it reverse or start to show a sign of rejection. stop is then lowered to now I'm going to be trying to lock in 20 pips with my stop loss
[26:37] as it breaks down I will lower my stop so that way if it does knock me out now I have 20 pips locked in 25 pips is locked in now we're in an area where it could start to reverse it could fail
[26:49] to get down to that other limit order so I'm not going to be able to move the stop because the spread won't permit me to do so so I have to either allow my stock to be hit or my limit order to be taken or I
[27:04] can collapse the trade now I was away from the computer here at the time but had I been there I would have been collapsing right now so ultimately the price comes back up and it does in fact stop me out eventually as you'll see but
[27:25] I've profited along the way taking out small portions because you never know. You never know if it's going to go down to your objective. And if you've taken the risk on initially, that risk needs to be reduced to a point of
[27:38] which where it's no longer impactful. And there's my stop loss being tagged. And there is the fruits of that short. very very predictable in terms of price action and not a bad little scalp for a run on stops
[27:57] the context was there everything was outlined and you can see the post trade results ultimately later on you can see as we showed in the beginning of the video your dollar does vault up higher
[28:09] after running those stops hopefully you found this insightful until next time wish you good luck and good trading you
⚡ Saved you 0h 28m reading this? Transcribe any YouTube video for free — no signup needed.