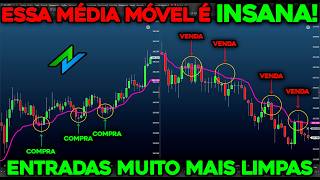

This Moving Average Adapts to Volatility
43sThe unique concept of a self-adjusting moving average that reacts to market volatility is intriguing and promises a new edge for traders.
▶ Play Clip"Delivers on the promise of a new indicator with practical examples, but includes promotional segments and some fluff."
This video introduces the VIDYA (Variable Index Dynamic Average) moving average, an adaptive indicator that adjusts its speed based on market volatility. The presenter explains how VIDYA differs from traditional moving averages, demonstrates its use as dynamic support and resistance, and provides free code for installation. Several strategy ideas are outlined, including combining VIDYA with Donchian channels and CCI, emphasizing the need for backtesting.
VIDYA is an adaptive moving average that changes speed with market volatility, unlike fixed-speed exponential and arithmetic moving averages.
VIDYA uses the CMO (Chande Momentum Oscillator) indicator to adjust its period dynamically: when the market is strong, CMO rises and the average accelerates; when the market is calm, CMO falls and the average slows down.
On a 5-minute mini-index chart, VIDYA forms horizontal ceilings (resistance) during downtrends and tables (support) during uptrends, providing clean entry points.
The presenter recommends using 8, 17, and 34-period VIDYA settings, derived from the golden ratio (Fibonacci), for mid-range trading. Longer periods make the average too heavy.
If the 8-period average is above the 17-period, and the 17-period is above the 34-period, it's a pure uptrend; the opposite indicates a pure downtrend; anything else is sideways.
In an uptrend, VIDYA acts as support; in a downtrend, it acts as resistance. The presenter shows examples where the average stays horizontal, inviting entries.
A strategy on the 1-minute mini-index: use a 300-point stop loss, 150-point target, and a Donchian channel (144 periods, displacement 1). Sell when price touches the bottom of the channel and returns to the 8-period VIDYA.
Adding a flux diffuser (another indicator) can filter false signals. The presenter shows how the flux diffuser confirms trends, but may also prevent some trades.
Use only the 34-period VIDYA with CCI (set to 610 periods). When CCI is below -100, use VIDYA as resistance; when above +100, use as support; otherwise, avoid trading.
Download the VIDYA indicator from the link in the description, save the file, then in ProfitChart go to Import/Export, select the file, and import. Then add it from the indicators menu.
VIDYA is a powerful adaptive moving average that can improve entry points and trend identification. However, any strategy using it must be rigorously backtested before live trading.
What does VIDYA stand for?
Variable Index Dynamic Average
00:02
How does VIDYA adapt to market volatility?
It uses the CMO indicator to adjust its period: when the market is strong, CMO rises and the average accelerates; when the market is calm, CMO falls and the average slows down.
01:13
What are the recommended VIDYA periods for mid-range trading?
8, 17, and 34 periods, derived from the golden ratio.
04:08
How do you identify a pure uptrend using the VIDYA trio?
When the 8-period average is above the 17-period, and the 17-period is above the 34-period.
05:05
In a downtrend, what role does VIDYA typically play?
It acts as resistance, forming a ceiling for the price.
06:06
What is the suggested stop loss and target for the 1-minute mini-index strategy?
300-point stop loss and 150-point target.
08:57
What is the purpose of adding a flux diffuser to the strategy?
To eliminate many false signals by confirming the trend.
11:50
In the CCI setup, when should you use the 34-period VIDYA as resistance?
When the CCI is below -100.
13:55
What is the key caveat about the strategies presented?
They are just ideas and must be rigorously backtested before use.
15:07
Adaptive Moving Average
Introduces a unique indicator that adjusts speed based on volatility, unlike traditional fixed-speed averages.
00:02Fibonacci Calibration
Shows how to derive optimal periods from the golden ratio, enhancing the indicator's effectiveness.
04:08Practical Strategy Example
Provides a concrete trading strategy with specific parameters, demonstrating real-world application.
08:44Free Indicator Download
Offers a free download of the VIDYA indicator, adding tangible value to viewers.
15:35[00:02] because unlike exponential moving averages , this moving average automatically adapts to market volatility. In other words, the market is volatile, this moving average accelerates, it reacts quickly. Now, when the market is
[00:15] calmer, this moving average slows down, becomes smooth, becomes stable, perfect for use as support and resistance, making entry points much making entry points much cleaner. This face represents the moving average. Its
[00:29] speed changes depending on market strength, while market strength, while exponential and arithmetic averages are fixed. And look, man, you can't find that moving average in Profit Chart. I had to
[00:41] develop the code for you, and I'm going to give it to you for free so you can download it during this lesson. And more than that, man, I'm also going to show you how a moving average calibrated with a cube can be superior to traditional moving averages
[00:56] at entry points. All of this is free for you. Come All of this is free for you. Come with me, man. First, what is a moving average? It is an adaptive moving average. Pay
[01:13] attention, man. Moving averages, both arithmetic and exponential, have a fixed speed. The moving average, however, changes its speed as the market changes. How does she do that, man? She uses an indicator called CMO. So, when the
[01:28] market is strong, the CMO indicator rises, and that's when the media accelerates. When the market loses momentum or moves sideways, the CMO falls, and that's when the media slows down, you understand? She doesn't use a fixed period; she uses a
[01:45] dynamic period in her configuration, and in this way, she can adjust to market volatility. And the result of that, my friend, is that the moving average identifies the trend, smooths out the noise, and, most importantly, creates perfect
[02:00] support and resistance zones. Let's take a look at this on the 5- minute timeframe of the mini-index. OK, man. We've been here for 5 minutes at the mini-index. when the price is moving downwards and then
[02:15] recovers, this moving average forms a sort of ceiling for the price. Notice how the average becomes quite horizontal? It's as if the average is waiting for the price to reach that point so we can hit our sales target. You'll notice that the price then
[02:30] accelerates again, and when it decides to breathe, that is, when it decides to return to the moving average region, which is when it starts to decrease volatility, you'll see that the moving average becomes quite
[02:43] horizontal again, forming, as I said, a kind of ceiling for the price, where it tends to encounter resistance. And you 'll find several examples of this in the chart. Look at that, downward movement, downward movement. The price returns
[02:56] to breathe, returns to breathe, and it finds the moving average region, resistance. And of course, man, in an upward movement, the price advances, look, in favor of the upward trend, it returns to breathe and when it returns to
[03:11] breathe the moving average becomes very horizontal, making a kind of table for the price, practically inviting us to buy here. So, if our strategy aligns with the price, finding the video moving average
[03:26] at those points, we could be buying. It's a good 5-minute timeframe chart, but I could simply go to the 10-minute chart and find several good
[03:38] moments where the moving average formed a ceiling for the price and also, of course, several good moments where the moving average formed a table for the price. But despite all that, man, now comes the question: gee, I understand that the
[03:53] Vidia moving average is very good as both support and resistance, but when should I use it as support? when to use it as resistance. And now comes the most important part. Let's calibrate the moving average with the cube of the number of phi. And
[04:08] you'll see that it outperforms traditional moving averages when it comes to entry points. Moving average trusted to the cube. Dude, on mid-range Vidia games I like to use these settings. An eight-period moving average is shown in
[04:22] green, a 17-period moving average in red, and a 34-period moving average in yellow. Periods longer than these make the average too heavy, and it ends up losing its ability to react to volatility. It's different, isn't it, from
[04:37] exponential and arithmetic averages? Piu, but what is this "cube wire" thing? Wow, if you watched my video about the golden mean in cube wire knitting, you already know that 34 and 17 come from the golden ratio. Anyway, if you haven't watched this video, there's
[04:52] Anyway, if you haven't watched this video, there's watch it now, okay? Let's now look at some examples using this trio of video media. So let's go, man. It's that old story: if the eight-
[05:05] period average is above the 17- period average, and the 17-period average is above the 34-period average, we'll simply consider it pure you look at a chart and you find this here, look, above
[05:21] 17 periods and 17 periods above 34, you're going to consider it a pure upward trend, okay? And of course, man, every time you see the averages like this , look, organizing themselves and looking like this , look, first eight
[05:36] periods, above eight periods, 17 periods. And above 17 periods, 34 periods. You will then consider it a pure downward trend. And anything different from that, man, you're going to consider lateralization. So look
[05:51] here, for example, right now, we have the averages showing sideways movement, because the eight- period average is between the 34- period and 17-period averages. So here we have a lateral movement, you understand? Hey
[06:06] man, I imagine it's already obvious, right? When you find the moving averages crossing upwards in this way, demonstrating an upward trend, that's when it 's most appropriate to use the averages as
[06:19] support zones, understand? Where will we be shopping? Notice that the average to you; look, it's perfectly horizontal, ideal for placing our buy order. Look, it stays perfectly horizontal in all
[06:34] showing you. Look, it actually forms a support region for us. So, man, this, combined with your strategy, could become quite powerful. So, in this case, man, with this downtrend we're
[06:47] seeing, you could be selling from up here if your strategy then, look, selling here when the price returns to the moving average, because in that case we could consider that the averages here would be
[07:01] acting as resistance, okay? Since the trend is towards cycling. And I repeat, man, this applies to any timeframe, any asset, and even the Renco chart. So, notice here, we previously saw a sideways movement
[07:13] because the averages weren't crossing upwards. From this point on, the averages began to show a clear upward trend. Hey man, if this fits your strategy, you could be using, look, the
[07:26] moving average, in this case, of eight periods, as a support zone for you to buy. Notice again, the average is quite horizontal in all these examples here. Look, it's as if the average is inviting us to
[07:38] buy at these points, right? Look, the moving average is perfectly horizontal. can also take a look at the mini- dollar. For the mini dollar, I would go with the 4R chart. And here, my friend, you can find several good examples. That
[07:52] too, look, man, the averages were coming from sideways movement. From that point on, we started to see a downward trend , as you can see from the moving averages. So, if your strategy fits this moment, well, you can
[08:04] use the eight-period moving average as resistance, as a resistance zone, because look, it's very horizontal, showing us something like a ceiling for the price. So, man, like I said, this works
[08:17] for any timeframe, any asset, and even the Renco chart. This analysis works in any market that has liquidity. So, man, with the moving average it's possible to develop various strategies. You
[08:30] can use your operational style and introduce the video moving average as an entry point. You can also use them to identify the trend through the cubed thread method, as I just showed you.
[08:44] These averages offer us a variety of opportunities. I'll give you some examples now of how I could be putting together a strategy using video averaging. Dude, if I were to put together a strategy using the moving average video, I'd probably go for
[08:57] the 1-minute timeframe of the mini- index. I would use a 300-point stop loss, a 150-point target, a loss limit , as always, a stop loss, and a consecutive gains. That's how I would manage the risk, right? You know me, you
[09:11] know my operational profile. I would probably also use a probably also use a Donch channel, perhaps around 72 or 144 periods. Let's try with 144 periods. Displacement of one. So,
[09:24] dude, an example from today's trading session, right? How might this strategy we're creating here with the moving average work? Look, initially the averages in this trading session here, November 27th, were showing
[09:36] sideways movement. Then, from that point on, look, the averages downward trend. Beauty? I would then wait for the price to touch the bottom of the Don channel, and when the price returns here, look, at the eight-period moving average,
[09:50] I would already have my sell order placed. So I would sell here when the price returns to the moving average; the price would then enter the exit position down here. That would be the first gain. He realizes that the price is touching the channel of
[10:02] reposition my sell order here at the moving average. That's because the averages continue to cross downwards. So I would sell again here, look, sell order is selected here and down here the price would catch up, exit the trade, and here
[10:18] , right? If that were my strategy, obviously. So, dude, the logic of this strategy would be: m crossed downwards, price hit the bottom of the doncha channel. So, he made this movement, look, striking the
[10:32] When it returned to the moving average region , I would be hitting the sell signal. When it hit the lower part of the Doncha channel again, returning to the moving average, I would hit the sell signal again, believing that
[10:45] prices had started to fall again. Of course, man, this is just a test, right? We are creating a strategy, outlining a strategy here. That doesn't mean it works. The only way to really know if this is likely to
[10:57] work is if I were to run these robust backtests, right? I'm just giving would happen, man, in a buying scenario. Within this strategy we are developing, I would expect the price to touch the top of the
[11:10] Don channel, as is the case here. When returning to the moving average, I could be buying into this sort of table that the moving average creates for us. So, point target, because that's my trading style, I like to trade
[11:24] would be triggered at that point. Up here , look, the price would be high enough to exit the operation. And you realize that here again, look, the price is already touching the top crossing upwards, I would buy when the price returns here, look, to the level that
[11:37] the moving average makes for the price. In this case, the order would be triggered here, and the price would pick up from the operation up here. So this could be a good strategy, man. We're sketching together here. To strengthen this strategy,
[11:50] I could do other things. For example, you could add a flux diffuser here, because using a flux diffuser would eliminate many false signals. For example, here, in this case, the averages are crossing
[12:03] bottom of the Donchion channel. In this strategy we're creating, if the Odonchion channel, with the moving averages crossing downwards, it means we can sell here, look, at the moving average, right? OK? And with the support
[12:17] of the flux diffuser, this becomes even clearer to us, because the averages here, look, from the flux diffuser are the same as the video averages. Look, green, red, yellow. Green, red, yellow. So, the flux diffuser averages
[12:30] are confirming the trend. We could sell it here. All good? Notice that once again the price continues to affect the lower part of the doncho channel. In theory, we could sell again at the average here, look, of eight
[12:44] periods, the video average. However, if we were to observe the flux diffuser, it would hinder us, because now, look, the flux diffuser averages are no longer equal. The video media, right? We have red, green, and
[12:58] averages green, red, and yellow. The flow diffuser is no longer confirming the downward trend, so we could sell back here , but we couldn't sell up front. But that's clear,
[13:11] man, as I'm telling you, it's not a ready-made strategy. We are just outlining some examples of possible strategies using the video moving average. Another setup idea that just popped into my mind, man, is this one. We
[13:24] could use just the 34-period moving average, because it's quite strong, It held up well here, look, like resistance. And on several other occasions, it also held up very well as a support. We could use just
[13:39] that moving average, but in the footer, man, we could use the CCI we put one horizontal line at 100, another horizontal line at to a heavier setting, like 610 periods. Hey man, whenever
[13:55] the indicator is below -1, when the price returns to the 34-period moving average, we can use the 34-period moving average as resistance . Of course, whenever the indicator is above 100 and the price
[14:10] is returning here, look, to the 34-period moving average, we could use the 34-period moving average as support. And when the CCI is neither above 100 nor below, say, -1, well, we wouldn't use the 34-period moving average
[14:25] , neither to buy nor to sell, because in that case the CCI would be showing us sideways movement, we would n't do anything, you understand? Until the Look, in this case, folks, while I'm recording this video, the CCI went below
[14:39] -1. So, in that case, if I had already tested this strategy and seen that it actually works, I would then moving average, hoping that the price would return to
[14:53] here, believing that the price would then, well, start to fall again. So, this is another setup idea you could be developing, okay? You can see that it works well in some of these examples I'm showing you,
[15:07] but we can't be sure if this actually works without backtesting it first, understand? Robust backtesting. Man, there are so many possibilities, right? I could stay with you all until tomorrow sharing ideas and
[15:21] enjoy doing most. I enjoy developing strategies. But that's not the point of the video, right? The purpose of the video was to introduce you to the moving average. OK, man. Now that you understand how the video moving average works and I've
[15:35] given you some ideas for possible setups with this indicator, I'm going to show you how to download and install the video moving average. In the description of this video, you will find this link; register there and keep an eye on your
[15:48] email. You will receive this file in your email for you to download. After you download this file, save it to a folder on your computer. Once that's done, you'll come in with a strategy. Next, you will come to
[16:01] import/export. You will click on this folder. You should then be able to find that file. Look, Vap Trader moving average. You double-click . Next, you click here, look, to the side. Next, you
[16:14] click on import. You'll see , look, successfully imported strategies . And there you have it, man. You just need to then go to indicators, more indicators. Search here, look, put it in and it will appear for you. Look,
[16:28] moving average. Pill Trader, you insert it here on the chart, click OK, and here's your moving average, okay? Setting it up is very simple, you double-click on it and change the period here, change the colors here too, and so on. Again,
[16:41] you can find this moving average for download in the description of this video. And now, folks, two quick warnings. First announcement: the new class for the Pilsar 3.0 method closes today. And for those who don't know, this training covers
[16:55] all the strategies and all the robots that I use in my day-to-day work. And of course, man, you also get ongoing support with updates whenever needed. So, man, we follow this update criteria
[17:09] that you're seeing on your screen right now. If any strategy meets these update criteria, we will update the strategy. Or if any robot fits the bill , we'll upgrade that robot. And we do this, man, because the
[17:22] market changes and strategies need to keep up with the market. So don't miss out, man, because tonight at midnight we're closing registration for this new Pilsar 3.0 method class. The link is in the description of this video and also in the
[17:36] first pinned comment. Don't lose out, man, because these are the strategies and robots I use in my portfolio of strategies and robots, OK? message concerns the bot that's on sale for Black November. If you
[17:51] only want robots for day trading, especially linear gradient robots , which are those robots that average down, well, this bot is for you, and we're having a Black November promotion on it exclusively. There are more than
[18:05] 15 robots, both for Profit Chart and Metatrader 5. You receive support in our VIP group from 9 am to 6 pm. Hey everyone, today is the last day for you to test our robots in the group linked in
[18:20] this video's description before you make your decision. So today is also the last day to apply for the bot 2.0, okay, man? video, okay? I sincerely hope
[18:33] you enjoyed this moving average video. This is my gift to you, and it's reciprocate, man, leave a like, subscribe to this channel and activate the bell, because I won't rest until you become a successful trader or achieve your goal
[18:46] . I'll be staying here, man, and see you in the next video. เฮ the next video. เฮ [music]
![The Moving Average That Anticipates Reversals (Forget the EMA) 🔓💰 [FREE]](https://img.youtube.com/vi/Hds7IuhwzFY/mqdefault.jpg)
![The Only Order Blocks Indicator You'll Ever Need [FREE]](https://img.youtube.com/vi/q10Cimko20g/mqdefault.jpg)
![The Exhaustions Indicator Is Much Better Than You Think [FREE]](https://img.youtube.com/vi/JL0ZXQmZKPo/mqdefault.jpg)
⚡ Saved you 0h 19m reading this? Transcribe any YouTube video for free — no signup needed.