
Why Stop Losses Fail You
45sOpens with a relatable frustration that hooks traders, promising a simple solution to timing entries.
▶ Play Clip"Title accurately describes a complete trading system with three indicators; content delivers exactly that."
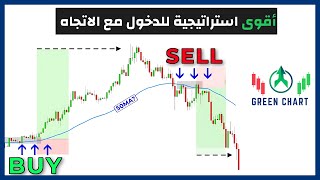
This video presents a complete trend-following trading strategy using only three indicators: a 50-period exponential moving average (EMA), a 5-period simple moving average (SMA), and the Williams %R oscillator. The strategy is designed to help traders enter after a correction and exit safely, with clear rules for trend determination, entry signals, and exit management. It is applicable across all timeframes and suitable for day traders, swing traders, and long-term investors.
The strategy is divided into three parts: chart preparation with indicators, entry and exit rules, and money management. It works on all timeframes.
Exponential moving average with period 50, source H+L+C/3. Determines the overall trend by its slope: upward slope = uptrend, downward slope = downtrend.
Simple moving average with period 5, source close. Used for trailing stop-loss and exit when two candles close below it.
Oscillator with period 14, levels -80 and -20. For buy signals: wait for %R to drop below -80 then rise above. For sell signals: wait for %R to rise above -20 then fall below.
Step 1: Determine trend on higher timeframe (e.g., hourly) using 50 EMA slope and 10 candles above/below. Step 2: Wait for correction on lower timeframe (e.g., 5-min) – candle close below 50 EMA. Step 3: Entry signal – Williams %R triggers. Step 4: Exit – take profit at 2:1 risk-reward, then trail with 5 SMA; exit when two candles close below SMA.
Never risk more than 1% of account per trade. Test strategy on demo account first.
The strategy provides a simple, rule-based system for trend following, emphasizing strict capital management and emotional discipline. It is not 100% successful, but mastering one system with clear rules is key to long-term trading success.
What are the three indicators used in this trend-following strategy?
50-period exponential moving average (EMA), 5-period simple moving average (SMA), and Williams %R oscillator.
01:47
How is the 50-period EMA calculated in this strategy?
It uses the source H+L+C/3 (high + low + close divided by three).
01:59
What is the role of the 50-period EMA?
To determine the overall trend direction by its slope: upward slope indicates uptrend, downward slope indicates downtrend.
02:14
What is the role of the 5-period SMA?
It is used as a trailing stop-loss to exit the trade when two candles close below it (for buy) or above it (for sell).
05:47
What are the key levels for the Williams %R indicator in this strategy?
-80 and -20. For buy signals, wait for %R to drop below -80 then rise above. For sell signals, wait for %R to rise above -20 then fall below.
04:46
How do you confirm the trend on the higher timeframe?
The 50 EMA must be sloping in the trend direction and price must have been above/below it for at least 10 candles.
07:30
What constitutes a correction signal on the lower timeframe?
A candle closes below the 50-period EMA (for an uptrend) or above it (for a downtrend).
08:55
How do you set the entry order for a buy trade?
Place a buy stop order above the high of the signal candle (the candle where Williams %R rose above -80).
10:30
What is the recommended risk per trade according to the strategy?
Never risk more than 1% of your account on any trade.
15:05
How do you exit a trade using the 5-period SMA?
After reaching 2:1 risk-reward, trail with the 5 SMA. Exit when two candles close below the SMA (for buy) or above it (for sell).
11:48
Flexibility Across Timeframes
The strategy works for day traders, swing traders, and long-term investors, making it widely applicable.
01:16Williams %R Entry Signal
Clear, objective entry rules using overbought/oversold levels reduce emotional decision-making.
04:46Trend Confirmation with 10 Candles
Requiring 10 candles above/below the EMA filters out false trend signals.
07:302:1 Risk-Reward and Trailing Stop
Combines fixed target with trailing stop to lock profits while allowing trend to run.
11:201% Risk Rule
Emphasizes capital preservation as the foundation of long-term trading success.
15:05[00:01] but the market pushes you out with a stop-loss order and continues on its way without you. The problem isn't your analysis; the whole issue lies in the timing of your entry. So, what if there was a simple and clear method that showed you how to enter a trade at the best time after the correction is over? In this video, I'll explain the trend-
[00:15] following strategy that relies on just three indicators to give you a strong entry signal. We'll go step by step, from setting the conditions, through the entry rules, to the exit rule, which I'll tell you about at the end of the video. So stay with us until the end. In
[00:36] followers. This is Dr. Mohamed Abu El-Gheit from the
[00:59] simply means we're not trying to outpace the market or predict peaks and troughs. We see where the market is headed and follow it. We wait for the price to pause a bit during a correction, and as soon as it gives us a signal that it will continue its course, we enter with it. The great thing about this strategy is that it's very flexible. Whether you're a
[01:16] day trader, swing trader, or even a long- term investor, you can apply it because it works on all timeframes. In the next part of the video, we'll divide the explanation into three parts. In the first part, we'll prepare the charts indicator and the tools we'll use in detail. In the second part, we'll explain the rules for
[01:31] entry and exit, and in the last part, we'll talk about the most important rule: money management. Let's start with the first part. First, for this strategy to work correctly, we need to prepare our conditions. We'll use three basic indicators, and I'll explain the role and settings of each one in detail. The
[01:47] first indicator we have is the moving average, and we have two moving averages. The first of these is the exponential moving average. This is the exponential moving average. Here we'll go to the
[01:59] average settings, and the first thing we'll change is to 50, meaning we want a 50-period exponential moving average. 50, meaning we want a 50-period exponential moving average. Here we'll change the source, and the close will be set to H + L + C / 3. What does that mean? It means the high + low + close divided by three.
[02:14] This is how the indicator is calculated, and we do n't change anything else. This is the first indicator we have in today's strategy. The role of this indicator is to determine the general direction of the market, meaning we are in an uptrend or a downtrend. We'll
[02:31] know this from the slope of the indicator. If the indicator is sloping upwards, this indicates that the trend is up. If the indicator is sloping downwards, this indicates that the trend is down. The
[02:43] second moving average we have will be a simple moving average. Here it will appear: Simple Moving Average. We'll click on it like this, and then we'll go to the indicator settings. Here we'll set this to five. We'll click here on Five, and the source here means the indicator's calculation method. We'll leave it as close, so
[03:00] this is our second moving average. We can change its color, of course. So now we have 50-period exponential moving average, calculated as HLC/3, and the other is a 5-period simple moving average,
[03:16] HLC/3, and the other is a 5-period simple moving average, calculated according to the closing price. We've added two indicators; we need a third. However, some people using the free package at TradingView might encounter a problem: they're only allowed two indicators. To overcome this,
[03:31] we'll go to Indicators > Multiple
[03:44] Moving Averages, and this indicator will appear. This is the indicator's programmer, and we'll click on it here. This indicator gives you more than one moving average, but its advantage is that it allows you to control the source. First, we'll choose allows you to control the source. First, we'll choose EMI, set it to 50, and the calculation method, as we said, is AZE + C/3. Then we'll choose SM. What does Simple Moving Average mean?
[03:57] We'll choose five here, leave the current closing price as is, and cancel the rest of the indicators. We'll just change the colors. That's how we've cancel the rest of the indicators. We'll just change the colors. That's how we've
[04:09] two moving averages at all. Now let's move on to the third indicator. The to the third indicator. The
[04:22] oscillator indicator. The function of this indicator is to measure the strength of the current closing price compared to the highest and lowest prices in a specific period. This period here is 14 candles. What is the benefit of this indicator? Its benefit is
[04:34] that it determines whether the price has reached an overbought or oversold level. Overbought means the price has risen too high, while oversold means the price has fallen too low.
[04:46] How do we use this indicator in our strategy? We use two very important levels: the -80 level and the -20 level. If we're looking for buying opportunities, we focus on the -80 level. We wait for the indicator to fall below -80 and then rise back above it; this is a
[05:03] buying opportunity. If we're looking to sell, we wait for the price to rise above the -20 level and then fall back below it; this is a selling opportunity,
[05:15] along with the other conditions of the strategy. That's how we add the three indicators we need to our strategy. Let's review the role of each indicator. The first indicator, the one in red, is the Exponential Moving Average (EMA).
[05:30] This average determines the market direction through its slope. If it is sloping downwards, this means that we are in a downward trend. If it is sloping upwards, this means that we are in an upward trend. The second average we have, the one in orange, is a simple moving average. The
[05:47] role and function of this average is to help us exit the trade safely and protect our profits when the trend begins to enter a state of weakness. The third indicator we have is the Williams %R indicator.
[05:59] state of weakness. The third indicator we have is the Williams %R indicator. tell us the best time to enter a trade, especially after the price starts to
[06:11] correct. So, we simply have three indicators: one that determines the trend, one that determines the entry point, and one that determines the exit point. Today, we have a complete system, so let's see how to apply it practically.
[06:27] We'll start by explaining the four steps of the strategy and applying them first to our current timeframe, the hourly timeframe. This strategy can be applied to any timeframe; it's not necessarily limited to the hourly timeframe. We'll apply the strategy to the
[06:43] hourly timeframe, entering on the five-minute timeframe. This is one way to enter the strategy. We can also apply the strategy to the weekly timeframe and enter on the daily timeframe, or to the four-hour timeframe to the weekly timeframe and enter on the daily timeframe, or to the four-hour timeframe
[06:58] minute timeframe. It depends on the method you're using. With it you can choose the timeframes on which you can apply the strategy and determine which timeframe you will enter from. We will start applying the first step with us in the strategy. The first step with us in the strategy is determining the trend. So the first step
[07:14] with us is to know where the price is going, up or down. So how will we do this? We will look at the 50 moving average line, which we said is the 50-period moving average. If we find the line sloping upwards, meaning if we come here from a point like this point, well, I am at this point, where is the line before it? The line here is
[07:30] slanted upwards, so what does that mean? This trend is still rising, but how can I be sure? I need to This trend is still rising, but how can I be sure? I need to see if this trend has passed through 10 candles, meaning where did the average start to trend from? From this exact point, the moving average, which had been
[07:45] declining, began to rise. So, we'll count 10 candles. Here we are with a ruler, counting 10 candles. Here we have 10 candles; this is the tenth candle. We're in an upward trend, and we were able to determine this using the
[07:57] 50-period moving average. We saw the average sloping upwards, which indicates an upward trend. How do we confirm this? We count 10 candles above the moving average, meaning the moving average is sloping upwards, and there are also 10 more candles, and the price is stable above the moving average. What do we do next? This is the first
[08:14] step: to determine the direction of the trend, whether it's upward or downward. Based on this, we'll identify the opportunities we're looking for. In an upward trend, we'll look for buying opportunities. If it's a downward trend, we'll look for selling opportunities. This is the first step; we've been able to determine the trend and know what to look for. Okay, the
[08:29] second step is to wait for a correction. So, we've now identified the trend on the hourly timeframe. Let's move to the timeframe we'll be entering on, so here we're on the five-minute timeframe. This candle was on the larger timeframe. There were about 10
[08:43] candles above the moving average, and the moving average was sloping upwards, confirming the upward trend. Now, after this candle, we wait for a correction. We wait for
[08:55] candle, we wait for a correction. We wait for the price to correct and for a candle to close below the 50-period moving average. So, after determining whether the trend is upward or downward on the larger timeframe, we move to a downward on the larger timeframe, we move to a smaller timeframe to see the entry opportunity. On this smaller timeframe,
[09:07] we see where the correction will end and then enter with the trend. The correction signal is when we wait for a corrective movement. We see a candle close below the 50-period moving average, and we know
[09:19] below the 50-period moving average, and we know the correction has happened, so we start preparing for our entry. So, how do we enter? Now we'll move on to the third step: the entry signal. On the same timeframe you're using, the five-minute timeframe, we'll
[09:33] five-minute timeframe, we'll look at the Williams %R indicator. This indicator is very important. We'll use its default settings: 14 ( default settings: 14 ( its period), -20, and -80. We'll look for an entry signal
[09:47] from this indicator. We wait for the indicator—we're now looking for a buying opportunity to enter with the upward trend—to drop below the -80 line and then rise back above it. Now, we need to see
[09:59] drop below the -80 line and then rise back above it. Now, we need to see which candle this rise coincided with. We'll see exactly which candle this rise coincided with—the candle that witnessed the rise. We wait for the Williams %R indicator to drop below the -80 level and then rise back above it. We'll look for the candle where the
[10:15] -80 level and then rise back above it. We'll look for the candle where the indicator rose above the -80 level. This is what we call the signal candle—the candle where this rise occurs, the rise from below the -80 level to above it. Now, I'll start placing my orders.
[10:30] My orders will be as follows: How do I enter? My orders are that I will come here at this candle, and above this candle, I will place a stop-loss order. This is my entry point. I will place a stop- loss order directly above the candle, and I will close the loss. It is very important to find the lowest low and place
[10:47] very important to find the lowest low and place my stop-loss order a little below it. So, the entry is when we place a buy order above the highest price of the signal candle, and the stop-loss is placed below the nearest clear low that we see, which is this low, and this is the stop-loss. The
[11:03] third step is the fourth step, which is managing the trade and exiting. The trade has now been activated for you, so here is an opportunity like this. You will start entering from here, and your stop-loss will be right here at entering from here, and your stop-loss will be right here at this red line.
[11:20] trade has been activated, we don't do anything else until the trade reaches double the stop-loss. So, you've until the trade reaches double the stop-loss. So, you've achieved your target of double your stop-loss. Now, after this happens, we move to the second stage. Here, you secure a portion of the profit and proceed with a
[11:36] trailing stop-loss. This means that when we achieve a 2:1 risk-to-risk ratio, you start using a trailing stop-loss. Your trailing stop-loss will be the simple moving average (SMA). The
[11:48] final exit signal is when you stay in the trade until in the trade until two candles close below the SMA. So, in this strategy, we're working on two timeframes. The larger timeframe, let's say in
[12:04] our example, is the hourly chart. The sole purpose of the larger timeframe is to determine the overall trend. If the overall trend is upward, we look for buying opportunities. If the overall trend is downward, we look for selling opportunities. Once we determine the trend, we don't return to this timeframe. We move
[12:20] to a smaller timeframe, such as the five-minute chart. The smaller timeframe is where we apply all the subsequent practical steps, which are... First, we need to identify the correction. Second, we need to identify the First, we need to identify the correction. Second, we need to identify the entry signal. Third, we need to exit
[12:35] the trade. Most of the work will be on the lower timeframe. Now, let's move to a larger timeframe, like the hourly timeframe. Let's say we find lower timeframe. Now, let's move to a larger timeframe, like the hourly timeframe. Let's say we find this area, let's say here, for example. We've already exited this opportunity, we've taken it and finished it, and we want to
[12:50] look for another opportunity. What will we do? We'll move to a lower timeframe here. If we've passed more than 10 candles and the exponential moving average is still trending upwards, we'll move to the lower timeframe again. we'll move to the lower timeframe again.
[13:12] We said the first step was on the larger timeframe to determine the overall trend so we know if we're looking for a buy opportunity or a sell opportunity. So, we know we're now looking for a buy opportunity. Now we'll enter to look for the correction. We'll enter this trend to
[13:25] look for the correction. We'll enter this trend to identify the correction on the 5-minute timeframe. So, where did the correction occur? The correction happened here. As soon as we see a candle close below the 50-period moving average on the lower timeframe, it means the correction has already happened in this area. Then, wait for the entry signal.
[13:40] Wait for the Williams %R indicator to drop below the -80 level and then rise again. The candle that the indicator rises with here is what we call the signal candle, and it will be our
[13:53] entry point. So, if... Let's look at the candle. We'll find that the candle the indicator rose with is this one. This is the candle where the Williams %R indicator rose again, above the -80 level. This is the entry candle, or the signal candle. So, what do we do? We'll place a buy stop above this area. We'll go
[14:07] to this area and place a buy stop above the highest price of the candle. Where is the highest price of the candle? Here it is. We'll go right above it and place a pending buy order right here in this area. This is where the buy and place a pending buy order right here in this area. This is where the buy stop is activated. When does this base form? That's why
[14:19] we'll place our stop loss below this low. This is the red line because this is the appropriate low because by the time this order is activated, this low had already formed. So, we'll place the stop loss here in this area. If we work like this, we'll come here. This is our
[14:33] entry area. So, the buy stop is here at this area, and this is the stop loss. We want to adjust the risk threshold ratio here, so it should be two. We noticed that here, the target was achieved, and then the price reversed. So, you're at this point; you'll take a profit. If you want to exit completely, that
[14:48] depends on each individual and their management of the position. You can follow the rules we mentioned for exiting: we'll take a profit here and secure the trade, then we'll use a trailing stop-loss. After that, we'll see if two candles close completely below the five-period moving average. This is our exit signal.
[15:05] As we can see, the two trades reached their targets. Will all trades be like this? Certainly not. That's why capital management is crucial. Never risk more than crucial. Never risk more than 1% of your account on any trade, no matter how strong the opportunity seems. One
[15:19] last, very important point: all the rules we explained using the buying example apply in reverse to selling. For example, to enter a sell trade, first make sure the overall trend is downward on the larger timeframe, and then you'll move to the smaller timeframe.
[15:34] The correction will be triggered by a candle closing above the 50-period moving average. The entry signal from the Williams %R indicator will be when the indicator rises above the -20 level and then falls back below it. All the conditions are
[15:46] exactly the same for buying, but the opposite applies for selling. This concludes our explanation of today's strategy, the trend- following strategy. As we've seen, the strategy is a comprehensive system where each indicator has a clear and specific role. The 50-period moving average
[16:02] determines the overall trend, the Williams %R indicator identifies the best entry point, and the 5-period moving average secures our profits upon exit. The beauty of this strategy lies in its simplicity within the complex world of trading. True success doesn't come from using dozens of indicators, but from
[16:18] mastering one simple trading system with clear and defined rules. The whole idea is to separate your emotions from your decisions and rely on specific, clear rules. Always remember that no strategy has a 100% success rate, and no trading system will protect you on its own. True success
[16:34] depends on the most important rule. In trading, which is strict capital management, the 1% rule is your safety valve that will allow you to continue in the financial markets in the long term. My to a real account is to try it first on a demo account to make sure that you understand it well
[16:48] and see its results with your own eyes. If you liked this video, don't forget to press like, share and subscribe, and stay tuned for future videos. Peace, mercy and blessings of God be upon you.
⚡ Saved you 0h 16m reading this? Transcribe any YouTube video for free — no signup needed.