
The #1 Indicator Traders Ignore (ATR)
40sStarts with a bold claim about missing a gold mine, creating curiosity and FOMO.
▶ Play Clip"Delivers solid ATR strategies with practical examples, though some fluff and a subscribe request at the end."
The video explains the Average True Range (ATR) indicator and its application in trading, focusing on predicting breakouts, setting stop losses, and managing risk based on volatility. The presenter demonstrates how to use ATR values to identify low volatility periods that precede breakouts, and how to adjust stop losses and position sizes according to market volatility.
ATR stands for Average True Range and measures market volatility. The indicator displays a line, but the key is the ATR value (average pips over the last 14 candles). Higher value means higher volatility, lower value means lower volatility. ATR does not indicate trend direction.
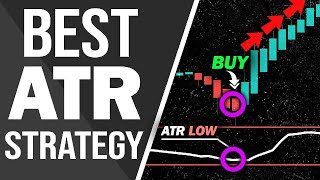
Markets cycle between low and high volatility. When ATR is at a relatively low point, a breakout is likely. To use this, pick a timeframe (e.g., 30-min), zoom out, find a low ATR value (e.g., 23 pips), and wait for ATR to drop to that level, signaling an upcoming volatility increase and potential breakout.
Once ATR indicates a potential breakout, use a trend indicator like Heiken Ashi to predict direction. Green candles suggest upward breakout, red candles suggest downward. Examples show that when ATR is low and Heiken Ashi shows green, price breaks up; when red, price breaks down.
Instead of using a fixed stop loss, use multiples of ATR. For example, if ATR is 24 pips, set stop loss at 24 pips; for tighter stop, divide by 2 (12 pips); for wider, multiply by 2 (48 pips). This adapts to market volatility and avoids premature stop-outs.
Chandelier Stop is an ATR-based trailing stop that keeps traders in trends until reversal. It's not for entries. SuperTrend is a similar indicator designed for trend detection and can be used for entries.
Risk capital should be adjusted based on volatility. If risking $100 on a 20 ATR market, then on a 60 ATR market (3x more volatile), risk only $33 (capital divided by 3). This balances risk and allows for similar profit potential due to larger moves.
The ATR indicator is a versatile tool for traders to gauge volatility, predict breakouts, set adaptive stop losses, and manage risk proportionally. By incorporating ATR into their strategy, traders can improve their timing and risk management.
What does ATR stand for and what does it measure?
Average True Range; it measures market volatility.
00:57
What is the default period for ATR?
14 candles.
01:24
Does ATR indicate trend direction?
No, it only measures volatility, not direction.
01:53
How can you predict a breakout using ATR?
When ATR is at a relatively low value, it signals low volatility, which often precedes a breakout.
02:35
What indicator can be used to predict breakout direction?
Heiken Ashi candles; green suggests upward, red suggests downward.
03:58
How do you set a stop loss using ATR?
Use a multiple of the ATR value, e.g., 1x, 0.5x, or 2x, depending on risk tolerance.
06:10
What is the Chandelier Stop used for?
It's an ATR-based trailing stop to keep traders in trends until a reversal; not for entries.
07:35
How should you adjust position size based on volatility?
If volatility (ATR) triples, reduce capital by 3x to keep risk constant.
08:54
ATR as the best indicator
Claims ATR is the best indicator because it measures volatility, a key trading metric.
00:31Volatility cycles
Markets alternate between low and high volatility, and ATR helps identify these phases.
02:35ATR-based stop loss
Using multiples of ATR for stop losses adapts to market conditions, preventing premature exits.
06:10Volatility-adjusted risk
Adjusting position size based on ATR ensures consistent risk across different volatility levels.
08:15[00:03] when the market is making large breakout moves it's hard to get large profits if the market is flat actually predict exactly when a price breakout is coming
[00:17] before it even occurs well that indicator is the atr if you are not using the atr indicator as part of your trading strategy then you are missing a gold mine it's literally the best indicator
[00:31] why because it can measure the most important metric on trading important metric on trading which is volatility and in this video i'm revealing the best way to use the atr indicator
[00:43] and as a bonus i'll also tell you how you can set your stop loss using the atr indicator and also a very important money management strategy so without further ado let's get started
[00:57] the atr indicator stands for average true range and its is very simple to identify the volatility on the market so when you open the atr indicator you'll get a single line
[01:11] but believe it or not you don't really need this line because the only important part of the indicator is the atr value the number in the corner so this number shows the average pips on the market in
[01:24] the past 14 candles you can switch this to whatever value you want in the settings but i prefer the original so you can see this means that in the current market the average pips of the last 14 candles
[01:39] the average pips of the last 14 candles is 53 pips so the higher the value lower the value the less volatile the market is the less volatile the market is but disclaimer the atr does not measure
[01:53] the direction of a trend just because the atr is heading upwards does it mean that the price is up trending so now i'm revealing the best way to use the atr indicator
[02:06] so like i said in the start of the video the big profits are made when the market has a high volatility so it's important for us to know when a market is volatile what you need to understand is that the
[02:19] is constantly changing from low volatility to high volatility and vice so we know that if the market is on a low volatility period it means that somewhere in the future we will see an increase in volatility
[02:35] luckily using the atr it tells you exactly when the market is on a low volatility so here's what you need to do first you pick a time frame in this case i'm using the 30 minute
[02:48] chart and next what you need to do is zoom out of the chart a little bit you can see that the atr is constantly switching from lows to highs so now what you want to do is find the
[03:01] relatively lowest point it doesn't have to be the exact slow just pick one that is low enough so now you point at it using your mouse to reveal the atr value now we know that in this time frame a
[03:15] relatively low atr is considered at around 23 pips if you chose a higher time frame the value would be much higher pips so now we know that once the atr drops
[03:30] down to somewhere around 23 pips volatility will start to pick up soon and high volatility means bigger price it's now easier for us because we already know that somewhere in the
[03:43] the price is going to break out but we just don't know the direction yet remember a high atr value means the price can either break out upwards or so now your only job is to predict the direction of the breakout
[03:58] there is actually a lot of ways you can do this but my favorite method is using a trend indicator such as the haiken ashi so you can see in this example the atr is on a relatively low value
[04:12] green candles meaning that the breakout is most likely to happen in the upwards direction and that's exactly what it did it went profits here's another example you can see that
[04:29] the atr is at a relatively low value which indicates that a breakout might happen now you can see that volatility is actually starting to pick up and the high kanashii is displaying huge
[04:41] meaning that the breakout will likely happen to the downside and that's exactly what happened so that's how you use the atr to predict when a price is breaking out so now i'm going to show you exactly
[04:56] profits as possible using the atr so when trading have you ever encountered this kind of problem where for example here and let's say because you normally use a 13
[05:13] pip stop loss you also decided to use it here but the your stop loss only for it to go back up again so missed the trend if you would have put your stop loss
[05:28] just slightly below here it will not get triggered and you would have participated in this trend so how do we avoid situations like this so knowing that different markets have different levels of volatility
[05:42] do you think it makes sense for us to use the same stop loss for all of them more volatile and you put a small stop loss 9 times out of 10 it will most likely get hit but
[05:57] if the market is calm and less volatile a smaller stop loss would make much more sense so what you need to do is use the multiples of the atr to determine your stop loss depending on
[06:10] your risk tolerance for example let's say your entry indicator displays a long signal here and at this specific point the average and at this specific point the average pips of the last 14 candles is 24
[06:24] based on that number in this case 24 pips but if you have a lower risk tolerance and think that 24 pips is too much and you want a tighter stop loss you can divide that value by 2
[06:40] pips but it needs to always be a multiple of the atr another example would be this let's say
[06:54] entry indicator and the atr value is 14 so you can put your stop loss at 14 pips but if you think that 14 pips is too small for your risk tolerance and you want a higher stop loss you can
[07:09] multiply that value by 2 to make it 28 pips it all depends on your risk reward ratio as long as it's still a multiple of the atr so back with our first example if you
[07:23] the atr which is around here instead of just making up a random number it wouldn't have closed the trade too early and you will still participate on this rally
[07:35] stop loss you can use an indicator called the chandelier stop this indicator is also based on the atr it is designed to keep traders in trend until a reversal happens
[07:49] so you can close your trade when a candle hits the chandelier stop and disclaimer this indicator is not designed for entry positions you don't want to take long or short positions based on this indicator
[08:03] if you want a similar indicator that is actually designed to detect trends you can use the super trend indicator instead so now i'm revealing an important money management strategy that you can use
[08:15] with the atr so let me give you a scenario let's say you're trading and the current atr value is 20 and you're risking let's say 100 on this trade
[08:28] so my question is do you think it makes sense to risk that same 100 sense to risk that same 100 but on a trade which has a 60 atr no because it's more risky that's like saying you would risk the same amount of
[08:41] when investing in the s p 500 and bitcoin obviously you want to lower your budget for the more volatile investment budget based on the volatility
[08:54] on the market so instead what you actually want to do is this let's say per trade you are risking 100 risking 100 on a market with 20 atr if next time you
[09:06] higher volatility of let's say 60 pips atr than the first one that means you want to put your capital three times less so in this case you would only put 33
[09:21] dollars on a market that has 60 atr and you profits because remember the market is three so it has a higher chance of making bigger movements
[09:35] so even with less capital you'll still get decent amounts of profits so i just revealed the best strategies that you can use with the atr indicator and all i ask for in return is a very small favor of liking the video
[09:51] and subscribe to the channel it literally takes only two clicks guys for watching and i'll see you in the next video




⚡ Saved you 0h 10m reading this? Transcribe any YouTube video for free — no signup needed.