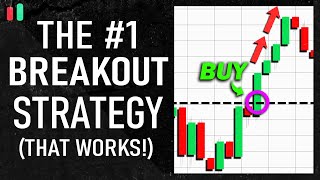

How to Spot a Real Breakout (Not a Fake One)
45sThis segment demystifies a common trader frustration, offering a clear visual example that sparks curiosity.
▶ Play Clip"Delivers a solid, actionable breakout strategy with clear examples, though the 'MUST KNOW' is a bit oversold."
This video presents a breakout trading strategy designed to capitalize on significant price movements. The presenter explains how to identify key support and resistance levels, avoid false breakouts, and manage trades with a two-step profit-taking system. The strategy is illustrated with chart examples and emphasizes the psychological and market dynamics behind breakouts.
A breakout occurs when price breaks beyond a key support or resistance level, often leading to a trend. Example shows price moving within a range, then breaking out and trending.
Instead of memorizing pattern names, focus on identifying key levels. Patterns like rectangle, pennant, wedge, and triangle are all based on price consolidation and key levels. Draw trendlines from multiple rejections.
A common mistake is entering at the first breakout. Breakouts don't always lead to trends; false breakouts occur. Use a momentum candle (big or multiple medium candles) as confirmation. Wait for the next candle to confirm.
After a confirmed breakout, price can: 1) continue trending, 2) pull back to the key level then continue, or 3) reverse (false breakout). Position yourself to benefit in all scenarios.
Enter at the momentum candle's close, set stop loss slightly below the key level. This ensures profitability in scenarios 1 and 2, and limits loss in scenario 3.
Step 1: Set a fixed profit target at 1.5x stop loss. When hit, close half the position and move stop loss to break even. Step 2: Apply chandelier stop indicator with ATR value 2 to let the remaining half run.
Demonstrates the strategy: identify triangle pattern, wait for momentum candle (multiple red candles), enter short, set stop loss above key level, apply two-step take profit.
During consolidation, buyers and sellers are balanced. A breakout shifts power, triggering stop losses and attracting breakout traders, amplifying momentum. Psychological factors drive the move.
Works well with assets that make sudden large moves, like cryptocurrencies. The sponsor, PrimeXBT, offers low-fee crypto trading.
The breakout strategy focuses on identifying key levels, confirming breakouts with momentum candles, and using a two-step take profit to maximize gains while managing risk. It's applicable to volatile assets like crypto and emphasizes patience and discipline.
What is a breakout in trading?
A breakout occurs when price breaks beyond a key support or resistance level, often leading to a trend.
00:30
What is a common mistake traders make with chart patterns?
They wait for the market to make the exact same movements as the pattern, but prices don't move like that in real life.
01:28
How do you avoid false breakouts?
Wait for a momentum candle (big or multiple medium candles) to confirm the breakout.
04:18
What are the three scenarios after a confirmed breakout?
1) Price continues trending, 2) Price pulls back to the key level then continues, 3) Price reverses (false breakout).
05:43
What is the two-step take profit system?
Step 1: Set a fixed profit target at 1.5x stop loss, close half position when hit, move stop loss to break even. Step 2: Apply chandelier stop indicator with ATR value 2 to let the remaining half run.
07:22
Why do breakouts happen?
During consolidation, buyers and sellers are balanced. A breakout shifts power, triggering stop losses and attracting breakout traders, amplifying momentum.
10:32
Focus on Key Levels, Not Pattern Names
Emphasizes a practical approach to pattern recognition, reducing complexity.
01:56Momentum Candle Confirmation
Provides a clear, actionable method to filter false breakouts.
04:18Positioning for All Scenarios
Shows how to structure a trade to remain profitable regardless of outcome.
06:09Psychological Logic Behind Breakouts
Explains the market dynamics that drive breakouts, adding depth to the strategy.
10:32[00:02] breakout trading strategy that can help you profit from huge price movements now before we continue kindly give me 10 seconds to talk about the sponsor of today's video primex bt an award-winning trading
[00:17] platform that offers extremely low fees you can register using the code data to earn 50 extra capital on your first link in the description below now back to the video
[00:30] so first what is a breakout actually a breakout simply refers to when the breaks beyond a key support or resistance level movements let me show you an example so in this
[00:46] we can see that the price is moving within a range and so we can place a level of resistance above and a level of support below here as price rejected it multiple times
[00:59] now notice as soon as the price broke out of the key level the market started trending and this would have been a good buy entry now the question is how do we find setups like this where the market can
[01:13] potentially break out well a simple way to do that is by i'm sure most of you have seen these patterns before we have the rectangle pennant wedge triangle all sorts of patterns
[01:28] now a common mistake that traders make when looking at this pattern list is that they're waiting for the market to make the exact same movements as the for example they look at the wedge pattern and they'll try to find candles
[01:42] exactly the same as this if you're still doing this single pattern because the truth is prices don't move like this in real life so instead what you want to focus on is
[01:56] finding the key levels let me give you an example so here as we look on top of the charts we can see that the price is forming lower meaning we can draw a downward strain line above it because again
[02:09] there are multiple rejections next as we look below the chart we saw more rejections and so we draw a support line below here now if you look closely we actually just found a triangle pattern
[02:25] downward trend line and a support line so this concept also applies for other patterns as well if you spot a support and resistance if you spot a support and resistance level then it's a rectangle pattern
[02:39] if you spot two opposite trend lines it's a pennant heading the same direction it's a flag pattern and so by knowing concept you don't even need to memorize the name of the patterns
[02:54] wedge or a rectangle at the end of the day all of them are based on one concept price consolidates forms key levels then breaks out so as long as you can find these key levels
[03:09] find these key levels the strategy would still work now pattern the next step is predicting the direction of the breakout will it happen to the upside or the downside so a common mistake that
[03:25] is that they immediately take a position at the first breakout that they see at the first breakout that they see for example here we spotted both a level of support and a level of resistance meaning we
[03:39] just found a rectangle pattern next we can see that a candle closed slightly above the upper level now traders would look at this and think oh the price broke above the level and so the breakout will surely happen
[03:53] to the upside well this is actually the wrong mindset to have because a breakout doesn't equal a trend there's always a possibility of it being a false breakout
[04:05] that's when the price broke above the key level only for it to come back down so if you took a buy position here you would actually lose money and so how do we avoid these false breakouts
[04:18] well a simple trick that i like to use to avoid false breakouts the breakout a momentum candle could be in the form of a big candle or multiple medium-sized candles
[04:32] let me show you an example so in this chart we can see that the price is forming lower highs meaning we can draw a downwards trend line above here and below it we spotted higher lows
[04:45] here as well and now we just formed a pennant's next we saw that a big green candle broke above the upper trend line but if you look closely
[04:59] bottom and only a small part of it broke out so for situations like this we need to have further confirmation by waiting for the next candle to form if it happens to be another medium-sized
[05:14] green candle then it counts as a momentum candle but unfortunately it was a red candle that formed instead so we ignore this signal next we saw that a big green candle broke out
[05:28] but this time a big part of it broke out so this [Music] now there are three scenarios that could formed first the price continues to trend
[05:43] second the price makes a pullback towards the key level towards the key level before continuing upwards and third the price reverses downwards and this counts as a false breakout
[05:56] and so what should we do should we wait for the price to make a pullback before entering or should we just enter right now well personally instead of trying to predict what will happen next
[06:09] what i like to do is position myself so that i'll always have the edge do is i'll enter a buy position at the momentum candles close and set my stop loss slightly below the
[06:23] so by doing this i'll still benefit in every scenario if the first scenario happens and the price continued upwards i will end up being profitable if the second scenario happens
[06:36] where the price pulls back towards the key level before continuing upwards would still end up profitable and if the third scenario happens where it's a false breakout my stop-loss will get hit
[06:51] money now after entering a buy position and the next step is where to set your profit target so first you need to remember that in a breakout setup
[07:06] prices tend to have larger upsides so if we're using a fixed profit target of 1.5 times your stop loss we are basically limiting our upside potential and so to make sure that we benefit if the price were to make a huge movement
[07:22] two-step works so the first step is you want to set a fixed profit target at 1.5 times your stop loss next
[07:36] if the price hits the first profit target instead of closing all of your positions you only close half of it then you want to move your stop loss to break even so now you still have the remaining half
[07:49] of your positions open with the new stop loss in place now profit system so for this next step you want to apply what's called the chandelier stop indicator
[08:07] next go to settings and change the atr value by two so now all you need to do is let the remaining half of your trades run
[08:19] you close your remaining position and take profits notice that by doing this we were able to benefit when the price made a huge because half of our positions are still open if we closed all of our positions
[08:34] we would have missed this upside potential and in this example we can also see that the price went straight up without forming a pullback this is why i prefer to enter positions right away
[08:48] because most breakouts actually happen without a pullback pullback to happen before entering a position chances are you will miss many profit potential
[09:01] in action in this chart we can see that the price is forming lower highs meaning we can draw a downward strain line above it and as we look below we also spotted a
[09:14] level of support because of these multiple rejections so we just formed a triangle pattern next a medium-sized green candle just broke above the key level however
[09:28] momentum candle and so we ignore the signal then we can see that a red candle broke below the key level momentum candle and so we ignore the signal once again
[09:44] you can see multiple red candles that formed after that so these multiple candles count as a momentum candle so we take a short position now for your stop loss
[09:57] you place it slightly above the key level and apply the two-step take profit system so step one place a profit target at 1.5 so step one place a profit target at 1.5 times your stop loss
[10:12] move your stop loss to break even and continue with step two apply the chandelier stop indicator and change the value to 2. then all you have to do is let the remaining trades run
[10:32] once this happens you close your position to ask is why do breakouts happen what's the logic
[10:45] behind it well let me explain when prices are on a period of consolidation it means that both buyers and sellers are equally strong but once a breakout happens let's say to
[10:58] the downside all of a sudden sellers are now stronger and because sellers are stronger buyers who bought at the support level because most of the time a stop loss is placed near a key level
[11:14] out plus sellers keep pushing so the downside momentum becomes much stronger not to mention breakout traders like us
[11:26] join in so all these factors combined causes the price to push lower and lower which causes a breakout pattern to form there's always a psychological reason
[11:40] behind it another question that people tend to ask is which asset should i trade the strategy with well if you think about it a breakout strategy will work very well with an
[11:52] that likes to make sudden huge movement an example of that would be cryptocurrency and so if you need a trading platform that offers crypto trading at a very low fee you can check out today's sponsor
[12:05] prime xbt which is an award-winning trading platform that gives you instant access to over 30 plus assets including crypto forex indices and commodities it offers very low fees
[12:17] ranging from point zero zero one percent for forex pairs and point zero five which makes this the perfect platform for scalping and day trading and exclusively for data trader viewers if you sign up using the code data
[12:30] you will earn an extra fifty percent bonus capital on your first deposit thousand dollars they will give you an extra five hundred clicking the link in the description below
[12:43] much for watching and i'll see you in the next video




⚡ Saved you 0h 12m reading this? Transcribe any YouTube video for free — no signup needed.