
AI Summary
This video presents a pullback trading strategy designed to help traders enter trends at lower risk. It explains the concept of pullbacks, identifies three common levels where pullbacks tend to end (previous resistance/support, trendlines, and moving averages), and introduces several confirmation techniques including candlestick patterns, trendline breaks, and the RSI indicator.
Chapters
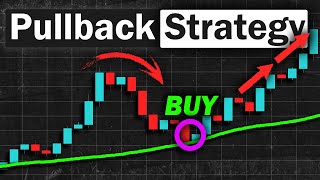
A pullback is a correction that happens in an existing trend. In an uptrend, price makes higher highs and pullbacks; entering on a pullback reduces risk compared to buying at the high.
Pullbacks often end at previous resistance levels that have turned into support (and vice versa for downtrends). The video shows an example where price broke resistance, pulled back to that level (now support), and continued up.
Pullbacks frequently end at trendlines. In a downtrend, price pulls back to the trendline and continues down; in an uptrend, it pulls back to the trendline and continues up.
Pullbacks often end at moving averages, such as the 50-period MA. The video notes that other periods (20, 100, 200) can also act as levels, and traders should adjust to what the market reacts to.
When multiple levels intersect (e.g., moving average and support), it creates an area of high confluence, increasing the probability of a reversal. However, price can still break through, so confirmation is needed.
Candlestick patterns like engulfing patterns and hammers signal rejection at key levels. An engulfing pattern shows strong selling/buying pressure; a hammer shows rejection of lower prices.
Another confirmation is drawing a smaller trendline at the pullback and waiting for price to break it. This signals that the pullback is over and the trend is resuming.
Set RSI settings to 50 for the middle line. Wait for RSI to cross above 50 for a long entry, or below 50 for a short entry, to confirm rejection at a key level.
The pullback strategy involves identifying key levels (support/resistance, trendlines, moving averages) and using confirmation techniques like candlestick patterns, trendline breaks, or RSI to enter trades with higher probability. Mastering multiple confirmation methods allows traders to adapt to different market conditions.
Mentioned in this Video
Tutorial Checklist
Study Flashcards (5)
What is a pullback in trading?
easy
Click to reveal answer
What is a pullback in trading?
A pullback is a correction that happens in an existing trend, where price temporarily moves against the trend before continuing.
00:03
Name three common levels where pullbacks tend to end.
easy
Click to reveal answer
Name three common levels where pullbacks tend to end.
Previous resistance/support, trendlines, and moving averages.
01:13
What is an area of high confluence?
medium
Click to reveal answer
What is an area of high confluence?
When multiple key levels intersect (e.g., moving average and support), creating a stronger area where price is more likely to reverse.
03:17
What is a bullish engulfing pattern?
medium
Click to reveal answer
What is a bullish engulfing pattern?
A candlestick pattern where the second candle's body completely engulfs the previous candle, indicating strong buying pressure.
04:24
How do you use the RSI indicator for pullback confirmation?
medium
Click to reveal answer
How do you use the RSI indicator for pullback confirmation?
Set RSI settings to 50, then wait for RSI to cross above 50 for a long entry or below 50 for a short entry.
08:00
💡 Key Takeaways
High Confluence Concept
Explains that combining multiple levels increases the probability of a reversal, a key principle for risk management.
03:17Candlestick Confirmation
Shows how engulfing patterns signal strong selling/buying pressure, a practical technique for entry timing.
04:24Trendline Break Confirmation
Provides an alternative confirmation method using a smaller trendline, useful when candlestick patterns are unclear.
06:17RSI Settings Adjustment
Highlights a specific RSI setting (50) that aligns with the strategy, a concrete actionable tip.
08:00Full Transcript
[00:03] pullback strategy that will change the way you trade so without further ado let's get on with the video first let's start with the basics what is a pullback exactly a pullback
[00:17] is simply a correction that happens in an existing trend understand let me give you a scenario let's say is on an uptrend and you're looking to enter a buy position
[00:32] now if you're an experienced trader you would know that it's quite rare for a to move in a continuous upwards direction most trends will actually look like this where the price is making a series of
[00:45] higher highs and pullbacks and so if you took a when the price is making higher highs there's a chance that a pullback or even a trend reversal might happen so instead of taking that risk it's
[01:00] pullback before entering a position this way you are essentially buying the trend at a lower risk
[01:13] here and not just continue downwards well based on my research i actually discovered three common levels where pullback usually ends and the first level
[01:27] you an example over to the left we saw the price rejected this level multiple times which makes this an area of resistance next the price broke out of the
[01:40] resistance and made a pullback notice where the pullback ended the previous resistance now turned support and then we saw the price went up even more and made a pullback once again and where
[01:52] did the pullback ended the previous resistance now turn support the same concept also applies for downtrends as well moving on the next level where the market tends to pull back into
[02:06] is the trend line so in this chart we spotted a downtrend and so we can place a trend line above here because price rejected it multiple times pullback towards the trend line and went down pulled back towards the
[02:22] and went down so that was an example of the price pulling back towards a trend the price pulling back towards a trend line possibly pull back into is the moving average here
[02:36] we spotted an uptrend and so we can apply the 50 period moving average as our key level now remember for this specific example we are using the 50 period because that's what the market is reacting to
[02:49] in the past markets can also react to other periods like the 20 other periods like the 20 100 and 200 period so you need to adjust to and as you can see the price made a
[03:02] pullback towards the moving average and traded higher pull back towards the and traded higher and that was an example of the price pulling back towards the moving average now there are also situations where you
[03:17] can find multiple levels in one chart like in this example we have the 50 period moving average applied and the price pulls back but notice that there's actually a level of support intersecting here this is called an area
[03:31] of high confluence and usually when price approaches an there's a higher chance that a reversal will form will form but keep in mind you cannot blindly
[03:43] just because the price made a pullback towards the level prices can still break and continue downwards and that is why you need to use other confirmation techniques before entering a position and one of
[03:57] use are candlestick patterns let me show you an example so here's a current downtrend as prices made lower highs and lower lows next we have the 50 period moving
[04:11] average applied as our key level and a resistance line intersecting it which makes this an area of high confluence now as price made a pullback towards the confluence you're looking to see if the price would
[04:24] show some type of rejection and what we got was a candlestick engulfing pattern which is when the second candle's body completely engulfs the previous candle so what this shows us is that at first
[04:39] buyers pushed the price all the way up creating a medium-sized green candle but then sellers stepped in and started pushing the price back down even as far as surpassing the previous candles opening price
[04:53] which indicates that there's a strong selling pressure at this area and if you want a stronger confirmation you can wait for the next candle to form which happens to be another big red candle
[05:06] so this is a good opportunity to take a short position chart over to the left we spotted an area of resistance as
[05:19] prices rejected this level multiple times then we saw the price pullback now to confirm that the price will upwards you're looking to see if there's some
[05:34] type of rejection at this area and what we got was another ejection in the form of a hammer which is when the bottom wick is sticking out so what this tells us is that
[05:47] at one point sellers tried pushing the price all the way down breaking the support level before buyer starts coming in that there's a strong buying pressure at this key area now
[06:01] to further confirm that the price will continue upwards the next candle after continue upwards the next candle after that was a big green candle and so this is a good opportunity to take a long entry
[06:17] finding candlestick patterns that signals rejection moving on the next confirmation technique that you can use is called break of a trendline and this is how it works
[06:29] in this chart we have a downtrend and a trendline drawn as our key level now as price has made a pullback towards the trend line we want to confirm that the price will actually reject this level and continue
[06:42] we can do that by drawing another smaller trend line right at the pullback once the price broke out of the smaller trend line that's where you want to enter your cell position
[06:57] chart here's an uptrend and we have our trend line placed below here which makes this an area of high confluence now as price made a pullback towards the
[07:10] confluence you draw a smaller trend line above it to confirm our signal you need to wait for the price to break out of the smaller trend line once this happens you take a buy
[07:22] once this happens you take a buy position trendline breakout technique don't force it instead you want to use
[07:34] other confirmation techniques in this case we saw a bullish engulfing pattern which means we're using candlestick patterns to confirm this setup that is why it's important to master
[07:47] multiple confirmation techniques so that you don't just rely on one strategy so if you found a market that doesn't support a particular strategy you can always use the others to avoid missing trade opportunities
[08:00] now moving on another confirmation technique that you can use is with the rsi indicator but first you want to edit the rsi by going to settings and change both of these values to 50
[08:15] middle like this and this is how the strategy works here's the usd cad with the rsi indicator applied and we saw the price rejected this level multiple times
[08:30] which makes this an area of resistance next the price broke out of the resistance and made a pullback now you're looking to see whether the price will actually reject this level
[08:42] and continue upwards the way you do that is by waiting for the rsi to cross above the middle line so this will be a good long entry let's
[08:54] show this again in another chart here we have a downtrend and the rsi indicator applied then we saw price rejected this upper meaning we can place a trend line above it next
[09:08] we also have your clear level of support which makes this an area of confluence now as price came back up to this level we want to confirm that the price will actually reject this level and continue downwards we do that by
[09:22] middle line so this is a good opportunity to enter a so this is a good opportunity to enter a short position
[09:35] pullback trading strategy that you can immediately use right now and all i ask for in return is for you to invest 2 seconds of your time into liking the video and subscribe to the channel it
[09:47] literally takes only 2 clicks but it means so much to me and you can also check out my other videos as well so thank you guys for watching and i'll so thank you guys for watching and i'll see you in the next video



