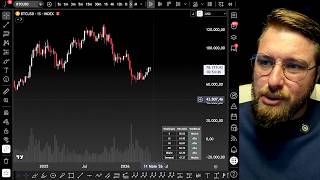

Bitcoin's Fake Move? Volume Drops While Price Rises
45sHighlights a classic bearish divergence that sparks debate among crypto traders.
▶ Play Clip"Title promises a 'giant liquidation' but delivers a routine technical analysis with speculative scenarios."
The video provides a detailed technical analysis of Bitcoin's price action for the upcoming week, focusing on liquidity grabs, volume dynamics, and strategic entry points. The analyst expects a bilateral liquidity capture, first targeting the $80,000-$81,000 region before a potential retest of lower levels, and advises caution for long-term buyers.
Bitcoin is close to a trend movement but hasn't broken structures to return to historical peaks. Rebound and pullback within a wide range, but volume is falling, suggesting the move may not be natural.
Price is rising but volume is decreasing, indicating limited room for negotiation. Unlike S&P 500 and Nasdaq at all-time highs, Bitcoin and crypto aren't keeping pace, suggesting potential capital rotation or suffering when correction starts.
The analyst believes a retest of the $60,000 region or lower is likely, which would cause panic but allow for larger accumulation with increased volume, unlike the current reduction.
Expects a bilateral liquidity capture: first upward to $80,000-$81,000, then downward. Notes significant liquidity zones and sell orders in the $80,000 region, with stop-losses and profit-taking.
The 4-hour bullish structure since April 2nd has support around $65,000, with invalidation at $74,500-$73,500. A breakdown below this would signal a reversal.
Recommends short-term scalping to capture upward liquidity to $80,000, offering 2-3% profit, but advises against buying the breakout due to longer timeframe weakness.
For swing traders, $80,000-$82,000 is a profit-taking zone. The analyst has 30% exposure with 17% profit, suggesting taking profits is wise.
Reiterates high probability of retesting $60,000 region, but not necessarily breaking below. Advises patience and not being aggressive in current region.
For long-term holders, DCA and patience are recommended. Buying at $78,000 is good but could fall further; 2-3 year timeframe is excellent.
Expects a weekly candle with long upper shadow (inverted hammer), indicating absorption at top and potential downward liquidity capture later in the week.
Ethereum, XRP, Solana remain extremely weak. Ethereum still in flag pattern with volume loss and profit-taking. No accumulation point yet.
Macro and geopolitical landscape is shaken, especially for altcoins. A catalyst is needed for improvement. Bitcoin dominance is high but will eventually fall.
Dominance is a secondary chart; technical analysis on it is meaningless because you don't buy or sell dominance. It can be manipulated by metric changes.
Be careful with bilateral liquidity grabs; expect volatile week. If itching to buy, hold off unless planning to hold for 250 years.
The analyst expects a volatile week with a bilateral liquidity capture, first upward to $80,000 then downward, and advises caution for buyers. Long-term accumulation remains viable but requires patience.
What is the expected bilateral liquidity capture pattern for Bitcoin this week?
First capture liquidity upward to $80,000-$81,000, then downward to lower regions.
02:19
What is the key invalidation level for the 4-hour bullish structure?
Around $74,500-$73,500.
04:38
Why is technical analysis on Bitcoin dominance considered meaningless?
Because you don't buy or sell dominance, and it can be manipulated by changing the metric.
11:51
What is the analyst's recommended strategy for short-term traders?
Scalping to capture upward liquidity to $80,000, aiming for 2-3% profit.
05:09
What is the analyst's view on buying Bitcoin at current levels?
Not worth buying now unless planning to hold for 250 years; wait for a retest.
08:14
Bilateral Liquidity Capture
Core thesis of the video: expects a two-sided liquidity grab, first up then down.
02:19Invalidation Level
Key technical level that determines bullish vs bearish scenario.
04:38Dominance Misconception
Debunks common misuse of Bitcoin dominance charts in technical analysis.
11:51Retest Probability
Highlights the analyst's expectation of a retest to $60,000, guiding risk management.
07:05[00:02] And here we go into the decisive week for Bitcoin, number 4786. very close, in my opinion, to having a trend movement again on the Bitcoin chart, right? Important fact, folks, we haven't yet
[00:17] broken any structures that would allow us to return to our historical peak, so that we can actually have greater optimism within the market. That's right, we had a rebound, that's right, we had a pullback, that's right, we are
[00:30] we had a pullback, that's right, we are indeed within a very wide price range, right? But notice some important movements, for example, we are going up, breaking through important regions on the chart, but with
[00:43] the volume falling, right? We have very little room for negotiation. This suggests that this movement may not be as natural as many people expect, right? We haven't seen any V-shaped recovery movement yet, mainly because this
[00:57] isn't a V anymore, right? The most that can be considered is a U-shaped recovery, but based on other markets, such as the S&P 500, which is at an all-time high, extremely stretched. Actually, this
[01:11] is the Nasdaq chart, which is also extremely stretched, and the SP500 is also extremely stretched, folks. BTC, cryptocurrencies themselves, aren't keeping pace with the same strength, the same violence of the movement, right? So we
[01:24] have that old saying, OK, the SP500 and NASDA are going up, but when this correction starts, we're going to have capital rotation or Bitcoin will suffer along with these assets, okay? In my personal opinion, it's more
[01:38] likely that we'll actually be doing retests down here, right? I still believe that we could end up seeing the price retesting that $60,000 region or even falling below it, which in my opinion would be the best-case scenario, okay?
[01:52] That would indeed cause a lot of panic in the market. Here, we could actually begin a slightly larger accumulation. This accumulation involves an increase in volume, okay? And not a reduction in volume, as we are seeing right now,
[02:06] okay? And sideways movements, folks, they eventually run out, right? Given that in the other weekly BTC chart, folks, we stayed for practically the same period of time and then we picked up a trend again, right? And given the reduction
[02:19] in volume, I believe it could be soon, okay? The movement that I 'm particularly expecting this week, folks, is a folks, is a bilateral liquidity capture movement, okay? First,
[02:31] capturing liquidity up here. Notice in the price that this region of 80,000 is a barrier, a huge resistance, but this also generates very noticeable liquidity zones here, right? People are placing stop-loss orders on their
[02:45] short positions, and a lot of sell orders are accumulating in this region as well. This is a sell order to take profit, right? Because a stop-loss order, folks, is a buy operation, right? So we always have to consider this counterpart, and
[02:58] exactly this movement in the quantitative data, right? Look at all this up here, folks, we have a lot of liquidity in the market. Lots of liquidity, lots of selling in the futures market. And along with that, folks, we have a lot of orders
[03:11] posted in the book, orders for sale, right? So, if I need to liquidate a buy position, I need a counterparty, which is exactly the , folks, my reading is that, in fact, given the momentum
[03:24] we have, we tend to capture this liquidity region here between 80 and 81,000, but we're also going to have a lot of selling pressure, a lot of profit-taking noticed that Opinage is rising very sharply this morning, converging, you know, towards
[03:39] this upward liquidity capture. But after capturing that liquidity, my view is that we'll capture it from below, okay? And also notice that we have exactly this confluence, right? If I increase the
[03:53] sell-off here above the 80,000 region, but then I have a gap in the price, okay? In terms of orders, personnel, and liquidity. And I'll get the liquidity again back in '74, right? Obviously, with shorter timeframes, we have
[04:07] liquidity in smaller regions, right? For example, here the region of [unclear] in smaller chart terms, but I don't have much defense of the price in this vacuum here, folks. I'll start to get interested after $4,000, which is when
[04:23] this 4-hour bullish structure that's been in place since April 2nd, around the $65,000 mark, and then we confirmed this trend and have n't seen a breakout of it since, right? For those who study
[04:38] need to have a breakdown of that structure, an invalidation of it, before we can actually talk about a reversal, right? This breakdown, folks, is in the region of 74,500, right? 73,500, depending on the analysis, but
[04:53] we've already had, it confirmed the region of 74,600, okay? And there's a lot of liquidity here too. And this is where buyer interest comes back folks, what is my strategy? Short-term operations, aiming to
[05:09] capture liquidity upwards, up to the 80,000 region, which provides a very interesting scalping opportunity of 2-3%, okay? But after that, folks, it's stop game, just set the target here to define it in the 80 region and be happy. But buying into
[05:24] this breakup, folks, in my opinion, is a bit much, okay? Why? Because it's not that great, longer graphical timeframes, okay? Just as seek liquidity upwards, eventually we also have to clean up
[05:38] below, okay? And I don't want to be bought off, you know, with too much exposure here in term, that's the scenario we have, okay? Short-term scalping operations, aimed at upward liquidity movements, with the
[05:53] primary goal, personally, of realizing profits in the 80,000 region to avoid downward liquidity searches as well, okay? Now, broadening the horizons, for those who operate swing trades, position trades, right? In the medium term, folks, that region
[06:07] of 80,000, 82,000 is also a region for me to take profits, to put money in your pocket. So, there are a lot of people with exposure here, dating back to the 65,000s, 66,000s. Notice that, even if you don't have a
[06:21] huge exposure, right? In my case, for example, I have 30% exposure, but I'm already 17% profitable. That's already a considerable profit for you to start yet have any indication that we 'll surpass $1,000, $120,000, the all-time high
[06:38] again. For now, the price, folks, isn't saying that. And looking upwards, we'll always have opportunities to enter rising funds, folks. Even if you realize now, "Oh, I was a fool," and
[06:51] eventually it will correct, and you can re-enter during that correction, no problem at all, okay? The important thing is to make a profit. So, if you're in a hurry, folks, wait a little bit, okay? Remember, in my personal analysis, in
[07:05] my market analysis, we still have a high probability of retesting this region at some point, okay? Whether it's 60,000, 1,000, or even a breakup. I'm not one of those who thinks Bitcoin is already at 40, okay? I don't
[07:18] believe it. I only believe in a retest of this region. Retesting may or may not break through this bottom, okay? Any small movement that seeks to capture this liquidity here, and then comes back, folks, for me that's already
[07:32] again. Obviously, you don't need to wait to catch the falling knife, right? Obviously, you don't need to be 100% out of the market, okay? That's not it, but in my market analysis, in my personal operational analysis, this isn't a region where you should be
[07:45] aggressive, at least not for now, okay? In case we get stuck in this back-and-forth any longer, okay? Keep floating on its side in this warm water for a while longer, and then is a completely lateralized accumulation, without any search for
[08:00] would need to move sideways more, like Bitcoin has done before, in other markets, but always seeking liquidity at the bottom, okay? So there's no reason for me to think that this time it's different, okay? So I'll continue with this
[08:14] analysis for the medium to long term, folks, between 20 and 40%, depending on the aggressiveness. Right now, I do n't think it's worth buying, okay? Unless 'll wear out your tattoo in 250 years, but that's no problem at all, right? A
[08:27] timeframe of 2 to 3 years, folks, if you buy now, you're buying in an excellent location. 78,000 is a good buying point, but you could still fall a little further. And it's in those moments that you have to have the skills
[08:42] of a diamond. So, for holding, the analysis is as follows: do your DCA and forget about other types of analysis, okay everyone? This is an intraday chart, right? The trading strategies that I use here on the channel, folks, won't work for you.
[08:57] Just accumulate your bitcoins and be happy in the long run. But for those who want to seek a slightly higher return, obviously with greater risk, in my opinion, the current price doesn't yet justify the risk,
[09:10] liquidity on both sides, right? Remember that this offers opportunities for scalping, but you also need to know how to profit from it. But after this search for liquidity, we'll probably be able to look for this other liquidity source
[09:22] down here later this week, okay? So on the weekly chart we could see, right, a candle, a body, a lot of upper shadow, indicating a movement here, like an inverted hammer, an absorption
[09:34] again in this top region, okay? And as for the other altcoins, right folks, Ethereum, for example, continues with its weak structure, okay? Extremely weak criterion. Look, if I pull a Fibonacci retracement here, folks, from this
[09:47] 're still in the flag pattern, right? While Bitcoin, technically speaking, is...? Remember, there's always room for market interpretation, right folks? The objective. It's already arrived in region 05, folks, Ethereum is still here on
[10:01] folks, Ethereum is still here on its banner. See, lots of absorption, same volume loss, right? The price is going up, folks, but you're already starting to see selling, profit-taking, and people changing their minds , right? So, very, very
[10:14] weak, okay? There is no question of aggressiveness in Bitcoin, at least in my personal, ethereal market view, and even less so in the realm of the market; it's extremely weak. Yes, we've already had several structural breakdowns here. We're
[10:26] working through this gigantic back-and-forth, and I only see possible entry points and trades in minute or 15-minute charts, for example, scalping trades, like the huge
[10:38] is a market anomaly. Please note that in 5 minutes we had a approximately 1.28%, okay? That's a lot for Ethereum, Compare the difference in volume, in amplitude, right? Price volatility,
[10:55] a small, ignored bar formed here, broke down, and provided a trade entry point. That's it, everyone! It's scalping, it's short-term trading, it's about well-defined targets and stops , okay? Yes, these are strategies to help you make a little more profit, but it's all just
[11:09] market speculation, okay? Invest now, guys, it's not worth it in the alt season , okay? Listen, it's 2026, if you still believe in this "season" thing, rethink your ideas, okay? Extremely weak, extremely weak indeed. Ethereal
[11:23] is very weak, XRP remains weak, Solana remains extremely weak. this moment, there's no point in talking about accumulation. The macroeconomic and geopolitical landscape, especially regarding cryptocurrency liquidity and reliability,
[11:38] particularly altcoins, is extremely shaken. So, an event, a catalyst, needs to happen for things to actually improve. August, but Bitcoin's dominance is extremely high and
[11:51] one day it will fall. Okay everyone, first, a dominance chart, alright? It's a secondary graph. You don't perform technical analysis on this chart. Why? Because you neither buy nor sell dominance. According to our staff, this percentage can go up
[12:04] or down depending on the metric. What do you mean , Ghost? Depending on the metric. more altcoins, would you agree with me that Bitcoin would still only be Bitcoin, only the market value of Bitcoin? If I add another altcoin,
[12:18] folks, now I have more volume, I have more market size in altcoins. Therefore, I have a drop here in BTC participation. If I remove , what do I have?
[12:33] I'm seeing an increase in BTC dominance, not because altcoins are weak or strong, I just changed my metric, okay? Furthermore, if you neither buy nor sell an asset, you have no way to analyze its technical aspects. Guys, I'm going to
[12:45] draw a wedge, the reversal movement, the absorption movement. That doesn't exist. Where there is neither supply nor demand. Technical analysis, demand. Technical analysis, price analysis, as the name suggests, price analysis.
[12:57] 60.93% is price analysis. No, it isn't. So, very careful with that nonsense you see on the internet, okay? Because this secondary graph, okay? Yes, you can use it, right? For example, people use
[13:10] F and Greed to see, you know, extreme market panic, that's all right, you analysis, but there's no point in talking about doing technical analysis here, for God's sake, okay? And always be aware, everyone,
[13:24] this percentage can be manipulated, okay? So, don't blindly trust any data you see. So, be very careful this week with this liquidity grab We can have an upward movement and then capture the lower price, okay? Both
[13:37] the Care Bears and our weaned little bulls tend to have a very volatile week. If you're itching to buy some Bitcoin, hold off a little longer, okay? It's not an upward movement, it
[13:50] best time for you to buy, right? Unless you, from Cryogeria, plan to spend your satogium 350 years from now, then that's fine , buy it now and be happy 250 years from now, okay? But before that, be careful with these bilateral liquidity-seeking moves here
[14:02] , okay? We've been stuck in the market for a long time now, haven't we? videos, but in fact I believe that this week, you know, because of the liquidity, we might see a trend movement, okay? So
[14:16] trends, always with well-aligned risk management and strategy. forget to like and subscribe to the channel. It cost. Goodbye.




⚡ Saved you 0h 14m reading this? Transcribe any YouTube video for free — no signup needed.