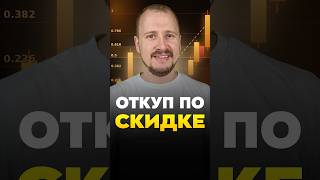

Where to Draw Fibonacci?
44sClear, visual explanation of a common trading confusion, appealing to beginners.
▶ Play Clip"A 90-second concept teaser padded with music — the discount-zone idea is real, but the 'strategy' is barely sketched and ends with a subscribe push."
This video presents a Fibonacci retracement strategy for buying assets at a discount. The presenter explains how to identify the discount zone between the 61.8% and 78.6% retracement levels and how to execute a trade from that zone with defined risk.
The Fibonacci grid can be drawn at multiple points on the chart; the presenter demonstrates several placement options before settling on the correct one.
A long decline followed by a reversal marks the first anchor point for the Fibonacci tool.
The entire rise from start to finish — including intermediate corrections — is used as the basis for the Fibonacci grid. There is little value without a concrete execution strategy.
The most coveted discount zone sits between the 61.8% (618) and 78.6% (786) Fibonacci levels. When price enters this area, it offers the biggest discounts for buyers of the prior growth.
Traders should wait for price to enter the discount zone without moving the grid. The grid stays fixed as one upward movement until price moves higher.
Enter the position from the discount zone (the golden ratio area), place the stop loss below the zone, and set the take profit at a 1:TM ratio.
Wait for price to enter the position and lock in the take profit once the target is reached.
The video outlines a simple Fibonacci discount-zone strategy: draw the grid across one upward move, wait for price to retrace into the 61.8–78.6% zone, then enter with a stop loss below the zone and a take profit at a fixed ratio.
What are the boundaries of the Fibonacci discount zone?
Between the 61.8% (618) and 78.6% (786) Fibonacci levels.
00:46
Where should the stop loss be placed in this strategy?
Below the discount zone.
01:16
What movement is used as the basis for drawing the Fibonacci grid?
One complete upward movement from start to finish, including intermediate corrections.
00:31
When should the Fibonacci grid be moved or adjusted?
It should not be moved until price moves higher; it remains fixed as one upward movement.
01:00
What does the presenter call the discount zone area?
The golden ratio.
01:16
Fibonacci discount zone
Defines the exact 61.8–78.6% retracement band that offers the biggest buying discounts — the core of the entire strategy.
00:46Risk management setup
Stop loss below the zone plus a fixed take-profit ratio gives the trade a clear, repeatable risk-reward structure.
01:16Grid placement principle
The Fibonacci grid must span one complete upward movement to remain valid — a key rule for correct application.
00:31[00:00] Все говорят о сетке Fibonacci, но никто нормально не объясняет, куда ее натянуть. Например, мы можем ее натянуть сюда, сюда или вот сюда. Когда это все закончится? Спокойно, сейчас все разложим по полочкам.
[00:13] Здесь на самом деле все красиво. У нас было длительное падение и потом пошел разворот. Это первая точка, куда мы надеваем нашу Fibonacci. Затем вот это все у нас одно восходящее движение.
[00:26] Да, здесь были коррекции, но потом цена снова отрастала. снова коррекция снова отросли соответственно все вот это движение от начала до конца у нас подходит для того чтобы накинуть сетку фибоначчи но толку с этого мало если нет конкретной стратегии
[00:44] по отработке сейчас этот вопрос мы тоже закроем фибоначчи у нас есть самая желанная зона дисконта это между 600 18-ым уровнем и 786 когда цена сюда дойдет это будут самые жирные скидки для
[01:00] всех тех кто откупал данный рост дальше просто ждем пока цена войдет в эту зону сетку fibonacci никуда переставлять не нужно пока цена не пошла выше вот это все у нас остается одним восходящим
[01:15] движением от которого мы ждем коррекцию дальше позицию выставляем от данной зоны можно назвать ее золотым сечением стоп лосс прячем под эту зону тейк профит тянем один к трем дожидаемся пока
[01:28] цена заберет нас позицию и фиксируем тейк профит просто подписывайся будем обучаться трейдингу и

⚡ Saved you 0h 01m reading this? Transcribe any YouTube video for free — no signup needed.