

The #1 Mistake Beginners Make in Intraday Trading
45sDirectly addresses a common pain point, promising a solution that viewers will want to learn.
▶ Play Clip"The title promises a 'best model' and delivers a detailed, structured trading strategy, though it's not groundbreaking and includes some filler."
This video presents a comprehensive intraday trading model designed for beginners and experienced traders alike. The core strategy revolves around establishing a daily bias using candle 2 and candle 3 closures, then aligning lower timeframe (4-hour and 15-minute) fractal models to execute trades. The presenter emphasizes the importance of confirming changes in the state of delivery (CISD) and using protected swings to frame entries, ultimately aiming to trade expansion candles across multiple timeframes.
The model starts with a daily bias, anticipating an expansion candle using candle 2 or candle 3 closures. A candle 2 closure is when price sweeps the previous candle's low and closes back above it, signaling potential expansion. A candle 3 closure occurs when the next candle engulfs the previous one, confirming reversal and continuation.
Before trading an expansion, a change in the state of delivery (CISD) must be confirmed on a lower timeframe. This involves price closing through a series of candles that made a low, confirming a swing point. Without CISD, the setup is invalid.
Once a daily bias is established, the same candle 2/3 closure logic is applied to the 4-hour chart to find a swing point. The goal is to align the daily bias with a 4-hour fractal model, looking for a continuation higher.
To trade the continuation, a new protected swing is needed. This involves price sweeping a low or reaching into a fair value gap (ideally both), then closing over a series of down-close candles. This forms a point of interest for entry.
The presenter walks through examples, including a range-bound market and Bitcoin, showing how to identify daily and 4-hour swing points, confirm CISD, and enter on the 15-minute timeframe. Entries can be positional (at the open) or after a continuation, with stops placed below protected swings.
The core principle is aligning a daily expansion candle with a 4-hour expansion candle, then using a protected swing on the 15-minute chart for entry. This alignment allows for holding trades toward higher timeframe targets, improving risk-to-reward.
The model is a systematic approach to trading that emphasizes patience and alignment across multiple timeframes. By waiting for daily bias confirmation, 4-hour swing points, and 15-minute protected swings, traders can enter high-probability setups with clear risk management. The presenter stresses that this is the 'easiest' way to trade, but it requires discipline to wait for all conditions to align.
Daily Bias is Key
Establishes the foundation of the entire model, emphasizing the importance of anticipating expansion candles.
00:28CISD Confirmation
Highlights a critical filter that prevents false entries, a key risk management principle.
01:25Protected Swings
Provides a concrete method for defining entry points and stop losses, improving trade precision.
03:44Timeframe Alignment
Shows how aligning multiple timeframes can lead to high-probability trades with better risk-to-reward.
12:28[00:00] How's it going and welcome back to another video. In this video we are going to go over the best
[00:16] model for beginners or anyone starting out. But also this is not just for beginners, this is anyone who is looking to trade. Let's get into the video. So the first step in this intraday model is
[00:28] having a daily bias and this is the most important part. It is anticipating the daily candle or a daily expansion candle. How we're going to do that is using a candle 2 or a candle 3 closure. If you do not know what this is, please check out
[00:43] my website where I cover candle 2 closure and candle 3 closure in depth with videos. But a candle 2 closure is where we have price sweep out with the previous candle and close back above it. With this we can anticipate the next
[00:56] candle to expand because reversal then expansion and this is when we can have a daily bias or look to trade is when we have an anticipated expansion candle. If this candle closes well or above candle
[01:11] 2's high then we can also look for a continuation in candle 4. Now it is important to note that with a candle 2 closure we do need a change in our state of delivery inside that candle 2 before we
[01:25] can look to trade that expansion higher. Now we went over how to get daily bias with a candle 2 closure or we can trade candle 3 or candle 4. Now if we don't have a candle 2 closure as you can see
[01:38] here price fleets out its previous candle but does not close back above it. This means we can wait for another candle. We don't have a bias for this candle. Once this candle prints it is engulfing
[01:50] this candle previous if it closes over its body. That means it is a candle 3 closure. With a candle 3 closure, then we can look to trade candle 4 as price has shown that it has reversed in candle 2
[02:03] and is looking for a continuation higher in candle 4. Now once again, we do need to confirm this on the lower time frame looking for a change in the state of delivery to have occurred before we're looking to get on side in candle 4. If there is no change in the state of delivery then we cannot
[02:20] look to trade this. And if you don't know what this is I have an entire video on confirming swing points using the change in the state of delivery on my website. Now once we have a daily bias this is when we are going to go down to the four hour chart. We are simply looking for the
[02:35] same thing on the four hour chart a candle 2 or a candle 3 closure. In this scenario you can see have a candle two closure so we can look to anticipate candle three four and then a continued
[02:47] expansion if we haven't hit our draw on liquidity or our higher time frame key level so the goal is to have a daily bias in this case we're going over a bullish scenario so with a bullish daily bias we
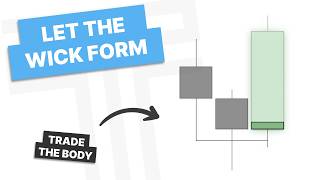
[03:00] want to see price open trade lower to form the wick once the wick is formed which is what we're using for our candles for then we can look to trade it higher so once we have that candle through closure what are we going to look for we're going to do the same thing that we just did with the
[03:15] daily and hourly but with the 4 hour and 15 minute fractal model so if we zoom in here once we have a 4 hour candle 2 closure or candle 3 closure we're going to first check that we have a flood change
[03:29] in the state of delivery we're going to do that by finding the low finding the series of candles that made that low and then once price has closed through that level it has confirmed the swing point and we can look to trade that continuation higher. How are we going to trade that continuation?
[03:44] We're going to look for a new protected swing. So what is that? We need a point of interest, so sweeping out a low or reaching into a fair value gap, or ideally both, so you can see here we sweeping out all these lows into this fair value gap and then price closes over the series of down close candles into that point of interest once we have formed that we can anticipate
[04:04] this wick to have formed right so we see how we're doing the same thing on the higher time frame as we are on the lower time frame and we can look for this to expand higher so the goal of this model is to trade candle free on multiple time frames or an expansion candle on the daily aligned with a lower
[04:20] time frame fractal model. With that we can look for price to expand higher. So let's get into some examples and trade review and go over this. So here we are with our first example and you can see we are trading within a range. We have just taken out our range low so we could be looking
[04:35] for price to trade to our range high which also lines up as a fractal model target. So with this we have a candle to closure on the daisy at a point of interest. So we could be looking for
[04:48] this to trade higher if we have what? An hourly change in the stated delivery. So taking a look here, adding my indicator on, it shows that we have an hourly change in the stated delivery. With a green key spot here, we could be looking for price to trade higher from here considering
[05:03] we have that confirmation of the daily wick. Now here I'm going to go to the four hour time frame. So here on a four hour time frame, what am I looking for? I'm looking for a four hour swing
[05:15] point within this daily candle. So let's let this move ahead and here you can see we'll go ahead and rewind but we have formed a four hour swing point right here as we have swept out this previous low as well as had a candle to closure and this confirmation here which is a new protected swing.
[05:33] So with that we can go down to the 15 minute time frame. I'm going to go ahead and put on this indicator template which will show the daily candle as well as four hour candles here and we be looking to trade this higher here. So in this candle we've already opened up and taken out this
[05:49] high. It's usually not ideal to long after that as we're going to get either a consolidation or a retracement if we're going to continue higher. So I'd rather wait to see if we get one of those. So we'll go ahead and remove all these drawings. Let's see what happens.
[06:03] Here we are getting that retracement. So we can kind of wait until we get into the New York session. Now let's take a look at our phases of price here. Expansion, consolidation. So this is where we're going to want to see a low ran out before we want to see a move higher. So we can
[06:20] also form a new swing point here as this candle has no wick. We could also be looking for price to take out this level as well. So here we open up, we reach into this low, so we could be looking for a move higher now. Now once again all we're looking for now that we have
[06:36] confirmed the low a day with a swim point is just a 15 minute continuation. So here you can see we did form a 15 minute continuation with SMT. We could look to trade that long or we could look for a retracement back into the range to get
[06:50] some better risk to reward. So maybe taking a retest here or we can look for a new continuation. Let's see what it would look like with a retest entry or we can see if we get a new continuation. So there's a retest, here's a new continuation, and we could also
[07:05] take an entry there, or on the retest of that. There's a retest of that, and we get a new continuation higher. But what are we really doing here? Well, if I go ahead and click this button
[07:17] here, it will show the 4-hour chart with the daily chart. So with the daily chart on there, we were just letting the daily wick form using that 4-hour swing point here, and now we're looking to trade a continuation. So we're looking for the continuation down here, but it already took out
[07:31] a target and then consolidated. So we're waiting for a new continuation. This new continuation within the daily range is actually a reversal, and we can look for another continuation if we want to here. But overall, what are we doing? We're aligning all these time frames together,
[07:47] a candle three, and then we're also looking to trade another candle three. So this is candle candle 2 here we wanted to trade that or we could wait for another candle 3 there which gives a another two r there so we just trying to align all time frames in one direction then use protected swings or the close over the series of down close candles into a point of
[08:08] interest to frame our continuations higher so as we let this continue higher you can see we continue to get another continuation candle three and four continue higher and into the new day so we'll
[08:20] replay that one more time to right there. You can see our daily candle. We open, we form a low, we trade and trend higher, and then that forms an open low, high close, and we're trying to find
[08:34] four-hour swing points to trade away from on our intraday time frames for the four-hour and 15. So here we are on Bitcoin. So let's see if we can find some examples in here. You can see we have a
[08:46] daily swing point formed. We form an hourly rate fair value gap. We have a candle two closure. Do we have an hourly change in the state of delivery? We'll go ahead, go down to the hourly time frame here. Do we have an hourly change in the state of delivery? We do. So you can see as
[09:02] we get into this next day, our model will print out a green box and I'll be looking for longs in this day. Now if I'm looking for a long set up here in candle three, what am I going to want to
[09:15] look for a four hour swing point. So going down to the four hour time frame do we have a four hour swing point to trade away from? Let's see if we farm one and no we do not get a four hour swing
[09:27] point right? We just create failure swings. So this is not something we'd be able to trade yet. Let's go back to our daily time frame as this candle closed. It has so we can be looking for price to respect this EQ if it's going to trade higher. Once again going to the four hour time
[09:43] So down here on the 4 hour time frame, do we have a 4 hour swing point? Not yet, so let's see what happens. Here on a new candle open, we reach into this gap and we have a candle to closure.
[09:56] So now what do we have? We have a candle for continuation on the daily, so we're looking for this to trade higher. We have a 4 hour swing point, so the next thing to do is go down to the 15 minute time frame. So down here on the 15 minute time frame, we're just going to be looking for a continuation
[10:13] to trade this higher. So you can see, we open up right here. Could I just take a long setup right here? Sure, I just need my stop down here. Can I get 2 hour? Sure. That would be trading the reversal, and we're fine to do that if we want to.
[10:28] We can also see if we can form a continuation, a new continuation in this cancel to form the wick of the 4 hour time frame. Let's see. So right here we reach below these lows, and we form a new continuation, which would be
[10:43] a close through the series of candles here. Let's see. Oh, we made a new low, so we have a new series of candles, in this case it's just one, and
[10:55] we close over. Now we can look long here, put our stop here, and then look for 2R, which would be right here, or I can hold until it's higher. So two possible entries here, one would be a reversal, we have a wider stop, one would be a continuation, we have a smaller stop.
[11:11] Let's see, this one hits RTP. Let's see if the next one hits RTP as well. It takes a while, but it does hit RTP as well. Do you see both of those works and what are we noticing right here?
[11:25] We'll go ahead and replay it just a little bit. We are aligning a four hour sling point with our daily candle, expecting our daily candle to expand. Once we find protected swings on the 15 minute timeframe, we can look for it to expand as well. Now do you have to trade an
[11:41] expansion candle in the daily? No you don't have to, it's just the easiest, right? The easiest is going to be aligning that candle 3 with a lower timeframe candle 3 and then a continuation entry But if you notice right here we could also trade this back across the range but that not in line with the daily candle so I would prefer not to You can see we have a continuation SMT
[12:03] a CISD, and we have a small work that supports expansion lower. We could look for that to expand lower. You can see it expanded lower into this low, right, taking out our current day's low.
[12:15] But I would always prefer to align with the daily time frame or with that expansion. So, one more time, what were we doing? We'll clean up the chart with no indicator. We're looking to trade an expansion on the daily.
[12:28] Since we had a daily swing point at a point of interest here with a candle 2 closure, and that was paired with an hourly change in the state of delivery, I can look to trade this candle higher. This candle never gave any opportunity because it didn't make a 4-hour swing point, but since
[12:44] it closed over candle 2's high, we can expect a further continuation. using the EQ of this, we'd want to see that be respected, but we can look for a 4-hour swing point in there. So inside that next daily candle, which is right here, we have a new 4-hour swing
[13:00] point and a candle to closure. So now we have aligned our daily expansion, which we are expecting to go higher with a 4-hour swing point, and then we're taking an entry on the 15-minute time frame, expecting it to go higher. So here we are in our last example, and what do we have here?
[13:17] we have a daily candle 2 closure. Why is this ideal? It is ideal because it is also forming a protected swing. It is closing over the series of down-closed candles into the low, right? It's
[13:29] taking out these lows to the left. So it is also forming a protected swing at the same time. So what does this mean? We could be looking for a candle 3 continuation from the upper half of this daily range higher. So what would we want to do? We'd want to look for a 4-hour swing point.
[13:44] So let's let this open up. What do we notice? We have price open low first which is ideal if we're bullish because we're forming the lower wick of the daily candle. And what do we have? A candle to closure. And so here we have a candle to closure. Then we'd want to go to the 15 minute time frame.
[14:04] Here on the 15 minute time frame, what do we have? A change in the status delivery, which means it's valid to look for candles to trade higher in this next candle. What do we notice before the opening here?
[14:18] We notice that we have already went into this fair value depth and closed over these down close candles, forming a new continuation already prior to the open. This is where I could look to take a positional entry, put my soft on this low because I have
[14:33] protected swing prior to the open and then look for 2R or hold runners to those higher time frame objectives. Because I'm entering around the opening price of the daily candle, right around it or below it, if I'm expecting price to expand I can almost hold this toward the close of the daily
[14:49] candle. You can see we form a new continuation. So if you didn't get entered into this first one, you could enter into this next one as well. And then we expand higher. So you can see what are
[15:02] are we doing? We're aligning a daily expansion candle with a 4 hour expansion candle. And then, do we get a continuation here too? We also do as well. So just to review, you can see what did we do. We aligned a daily candle 3 where we are expecting it to expand with a 4 hour candle
[15:20] 3. Then we're looking to trade this 4 hour candle 3 with a protected swing. In this case we have a protected swing form just prior, so it's a positional entry, or we could wait for another continuation within that candle tree. Then we're just letting it expand as we're expecting this
[15:36] daily candle to expand. And like I will go over in my future targets video, if I'm looking for a higher time frame target and letting these run, this is where you can get really good risk to reward trades.
⚡ Saved you 0h 15m reading this? Transcribe any YouTube video for free — no signup needed.