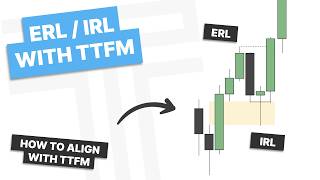

Internal vs External Liquidity Explained
40sClear, concise explanation of a key trading concept that is highly searched and educational.
▶ Play Clip"Delivers exactly what the title promises — a clear explanation of internal/external liquidity and fractal model integration, with practical examples."
This video explains the relationship between internal liquidity (fair value gaps) and external liquidity (swing highs/lows) in trading, and how to combine this with a fractal model for entries. The presenter demonstrates how price moves between these two liquidity types and how to use candle closures (fractal models) to trade these moves across multiple timeframes.
Internal liquidity is defined as a fair value gap, a three-candlestick pattern where the wick of candle one does not overlap with the wick of candle three, creating a gap.
External liquidity is a swing point in the market, such as a high or low, identified by a candle with a lower high on each side (or vice versa).
The market moves between internal and external liquidity. Price often reaches into internal liquidity (fair value gap), reacts, and then moves toward external liquidity (swing point).
Reactions at these levels matter. Just because a fair value gap exists doesn't mean price will reach it; it could continue trending. Pairing with fractal models (candle closures) helps identify valid trade setups.
In the first example, price reaches into a fair value gap, forms a candle closure (reversal), and then expands toward external liquidity (a swing low). Candle three and four can be traded.
It's important to analyze the phases of price at levels. A bullish candle with a small wick may not indicate a reversal, so waiting for confirmation is key.
External liquidity is always the swing low that made the swing high, or the swing high that made the swing low. This helps set higher timeframe targets.
Trading from fair value gaps inside a higher timeframe trend toward external liquidity is generally easier than trading retracements back into a range.
In the second example, after taking out a previous high (external liquidity), a fair value gap below provides a target. An SMT (Smart Money Technique) divergence adds confluence for a reversal.
The same logic can be applied across timeframes. An hourly fair value gap (internal) can be a target for a lower timeframe entry, while the daily low serves as a higher timeframe target.
For a short entry, place the stop above the swing high or on the bodies of the reversal candle. Using a lower timeframe entry allows for better risk-to-reward ratios.
To use a daily bias with a 15-minute entry, wait for a new invalidation (protected swing) on the lower timeframe. This aligns with the 4-hour and 15-minute fractal model.
This concept is fractal and can be applied to any timeframe, from 1-minute to weekly charts. The same principles of internal/external liquidity and candle closures apply.
On the weekly chart, a fair value gap (internal) and a reversal candle can set up a move to a previous low (external). Drop to the 4-hour and 15-minute for entry.
The concept is practical and can simplify trading. It involves identifying internal and external liquidity, waiting for valid fractal models (candle closures), and using higher timeframe targets.
The video provides a clear framework for combining internal and external liquidity with fractal models to identify high-probability trades. By understanding how price moves between these levels and using candle closures for confirmation, traders can apply this strategy across any timeframe for consistent results.
Definition of Internal Liquidity
Provides a clear, testable definition of a key trading concept.
00:22Definition of External Liquidity
Clarifies the distinction between internal and external liquidity, essential for the model.
00:41Reactions Matter More Than Levels
Highlights the importance of confirmation over assumptions, a core trading principle.
02:10External Liquidity as Swing Point
Offers a simple rule for identifying external liquidity targets.
04:53Improving Risk-to-Reward
Practical advice on using lower timeframe entries to achieve better risk-to-reward ratios.
08:46[00:00] How's it going everyone and welcome back to another video. In this video we are going to talk about the relationship between internal and external liquidity combined with my fractal model. So let's get into the video.
[00:22] So what is internal liquidity and what is external liquidity? Internal liquidity is a fair value gap. So a three candlestick pattern, which the wick of candle one does not overlap with the wick of candle three, creating a gap between those wicks or a fair value gap.
[00:41] That is what we are going to define as internal liquidity. What is external liquidity? External liquidity is a high or a low, a swing point in the market. So you can see we have a high with a lower high on each side.
[00:56] So this is our swing point or external liquidity. Now how do these two work together? Well the market will move between internal and external liquidity. So here you can see we have a fair value gap as the wick of this first candle here in this
[01:10] three candlestick pattern does not overlap with the third. So we have internal liquidity or a fair value gap. Now what do we have? We have a swing point. We have a candle with a lower high on each side, so this is external liquidity.
[01:26] So price reaches into internal liquidity here, and we have a reaction, or a candle to closure. Where could we anticipate price reaching for? This external liquidity, or this high here. So then we could look to trade candle 3 in this fractal model towards that high, or even candle 4.
[01:44] Now what do we notice here? It continues. right so we take out external liquidity if we get price action showing that we're going to get a retracement or a reversal not just blindly thinking it should go to internal liquidity
[01:57] what do we have candle to closure internal liquidity so we can go from this external high back into this internal liquidity or this fair value gap and this can continue to repeat and
[02:10] would just be creating a trend of a low high higher low higher high now the reactions at these levels or these phases of price at these levels are what matters just because we have a fair value gap
[02:23] doesn't mean price is going to reach into it it could continue to trend but here when you pair it with the fractal model or these candle closures you can see when we have a candle to closure that's when you can actually look to trade the relationship so on this first one here from
[02:38] internal liquidity to external liquidity, you can trade this candle free because you have a context and then you have a valid fractal model. You can trade this external liquidity to internal liquidity here because you have a candle closure or a valid fractal model. So simply put, what are you going
[02:57] to be doing? You're going to be finding highs and lows and fair value bets, looking for the market to move between the two, and then looking to trade valid fractal models in between those two using continuations. So if I have a higher time frame here, reach into a fair value gap, and it's looking
[03:14] to trade into external liquidity, I can then look for a fractal model to trade to that external time. Let's get into TradingView and go over a few examples of this. So here in this first example, we just going to show the relationship between internal and external liquidity So here you can see we have a fair value gap Let see if price reaches into this fair value gap It does And you can see we have a candle to closure at the fair value gap So this
[03:42] is showing us that price is reversing out of this fair value gap. So if we reverse out of this fair value gap, where would we want to go? From this internal liquidity to external liquidity or this
[03:54] low so that is what we can look for price to do you can see we get this expansion lower a candle three and a candle four both that could be traded from internal as we're reaching towards external
[04:08] but we notice we have multiple days of expansion now we haven't hit this low yet and what do we do we have a candle with no wick that reaches up and we have two fair value gaps right here. Now taking a look here, this is what I mean when I say it's important to look at the
[04:24] phases of price at these levels. This is a very bullish candle. It closes with a small wick, but that's not very bearish or telling of a reversal. So I don't want to wait for the next candle to form to tell me what happens. So you can see we now hit both these fair value ups.
[04:40] So we have internal, where would be our external? Because we have price showing a reversal, our external liquidity is always simply going to be the swing low that made the swing high or the
[04:53] swing high that made the swing low. Now if you've seen my relevant swings video this isn't very relevant because it is a failure swing to this one here but internal we can look for to go to
[05:05] external and there you go. Now how are you blending this with the fractal model is you're using this relationship and pairing it with a candle two or a candle three closure. In this
[05:17] case, they are both candle two closures. So a candle two closure at a fair value gap or internal liquidity, I can look for it to trade towards that external liquidity as my higher tempering target.
[05:29] Candle two closure at a fair value gap here, showing a reversal, I can look for it to go from this internal liquidity to this external liquidity. And you can keep this going as if you continue, we have now taken external liquidity out and what do we have? A fair value gap. So we could look for
[05:47] price if it forms a reversal to reach back up into that fair value gap or back into that internal liquidity from external to internal. Generally speaking, people have an easier time trading from
[06:00] fair value gaps inside the higher time frame trend towards external liquidity instead of trading that retracement or reversal back into the range. So let's go over an example of how to actually use this model now that you understand the relationship between internal and external liquidity while
[06:17] looking for a valid candle 2 or candle 3 closure. So here we are in the next example and what do we notice? We have a little bit of a range here but we have taken out this previous high or this external liquidity. Now do we have internal liquidity below? What do we have? We have a
[06:34] fair value gap here. So if we can find the reversal point up here, we could look to trade this from this external liquidity back into this gap or really back into this previous day's low. That's
[06:47] really what it is. So taking a look at this, what do we have? We have taken out our previous day's high and we have a small wick which can support expansion lower. But taking a look at a correlated
[07:00] asset you can see that we have an SMT here so SMT is adding that extra confluence to look back lower now going from our daily we have that bias There a few ways we can go about this and we can do both of them So we can
[07:15] look at the hourly or we could look at the 4-hour and 15-minute model. But on the hourly, what would we want to see? We have our point of reversal. Let's go ahead and throw on my indicator here. You can see we have that SMT. We have a point of reversal. We have that change in the state
[07:30] delivery and so with that we could be looking to trade this lower but what would we want to see a new swing put in where would we want to see that well we have a fair value gap right here so let's see if we find a swing point in that area we do we have a candle to closure at a fair value
[07:49] gap so you can repeat this logic across time frames we now have internal liquidity here on the hourly chart and where can we look for that to go to external liquidity and this is going to be
[08:01] that lower time frame model right this is a lower time frame target this is our higher time frame target for this time frame target so if we wanted to trade this we have an hourly swing we can go to the five minute time frame and wait for a valid fractal model so we're going to go ahead and
[08:18] switch this to bearish just so it cleans it up a little bit and then let this continue on so what we have we now have a valid model right here because we've had an smt psp but mainly that
[08:30] swing point with a change in the stage delivery and we have a new protective swing right here because we reach into a fair value up and then close through this level so we can go take an entry here we can put our stop either on this high or on the bodies of that and then look for 2r
[08:46] which is right around that lower time frame target now if you want to get higher risk to reward trades stop trying to jam your stock loss and getting taken out of your positions just take an entry using a lower time frame and then look for those higher time frame targets we're trading
[09:02] this hourly internal to external model right here which is a target but what is our hourly target it's that daily low down here so we can look to take an entry and have our runners or our target
[09:14] all the way down there if we wanted to let's see how this plays out you can see it takes into the next day. We eventually go and finally hit this level right there. So you can see it takes a bit
[09:29] of time, but that is our higher time frame target if you want more risk to reward. So that's an example of using that relationship between internal and external liquidity on the hourly and five
[09:41] minute chart. On the hourly chart paired with the daily chart for a target, but what if we wanted to use that relationship from the daily but then use a 15 minute entry? Well let's take a look at how we could do that. We have that whole idea that we are looking to trade from this high, right,
[09:57] from the hourly chart into this low. So if I wanted to use a 15-minute for entry, I'm just waiting for a new invalidation. That would be using the 4-hour and 15-minute fractal model. We have a candle to closure. We reach higher. Do we form a continuation? And we do right there.
[10:15] You can see we have a new protected swing. So I could look to take a short entry. I could put my stop right here or on the high. If I put it on the high, the risk reward doesn't make as much sense. So I'm gonna put it on this lower timeframe high.
[10:27] Why does that still make sense? Because I wanna see 50% of this being respected and my stop loss is still over 50% of that. So here is an example of using that relationship on the daily chart for a bias and then using a four hour and 15 minute fractal model to align with that you can see there it goes and hits its pt right there so let get into another example of this
[10:51] relationship now like i said this is a fractal thing you can use this on any time frame you can use it on the 15 minute the one minute the weekly time frame the daily it is fractal you can use it
[11:04] everywhere. So here we are on the weekly time frame, we have a fair value gap. If we have internal liquidity here, and we have formed a reversal, right, a candle to closure, where could we look for this to go to? This previous low or the external liquidity. So using the weekly here,
[11:21] we could drop down to the four hour time frame to get a better look at this. And what do we notice? We have a valid model, right? We have that change in our state of delivery, these continuations have formed and we've now formed what I would want to see be the intra-week high because we have that
[11:37] intra-candle change in the state of delivery. So what could we look for? Well we have fair value gaps right here. So I could mark these out and generally during expansions what do I want to see?
[11:49] Shallow retracements. I don't want to see it go back up into a premium here. I want to see a nice shallow move. So we are reaching up into this internal liquidity. So if we form a reversal
[12:01] candle, what could we look for? We have a candle to closure here. We could look for this to trade to this external liquidity here. So now we have this higher timeframe target where we're looking for
[12:13] price to trend to in this lower timeframe target here. So we could go down to the 15 minute time frame that is aligned with the four hour chart and wait for a valid model. So we'll create this up here and see what happens.
[12:27] So I don't have a change in the state of delivery yet so I need to wait for that. And now I get a change in the state of delivery so I could go look to trade this lower. Let's see if we form any sort of continuation. We're at the end of a
[12:43] higher time frame candle so now we're at the beginning of a new one and what do we have we have that t-spot overlapping with a fair value gap so this shows us where we want to see a continuation form and there we form a continuation as price reaches into a point of
[12:59] interest gets the closure through to take an entry on the open of the new candle and then look for 2r or I could look for what that higher time frame target down here so let's see how either of those
[13:12] works. So there we hit R2R on that new continuation. If you wanted to, you could look to hold this to the higher time frame objective. You can see it's quite the hold, but we do finally go
[13:26] and take out that level. Now it is a practical concept, guys, so you can use this on any time frame, and you can really practice it however you want. Right here, what do we see? We see on the 15
[13:39] minute time frame as we're reaching for this higher time frame objective we had a candle to closure at a fair value gap we could then look for this next candle to go into this external liquidity or to this target so then I could go trade a 15 minute and one minute model it is a practical
[13:54] concept once you learn how to use it it can simplify your trading and your bias so I hope you found it helpful if you did give it a like give it a subscribe and I'll see you guys next time have a good one
[14:09] you
⚡ Saved you 0h 14m reading this? Transcribe any YouTube video for free — no signup needed.