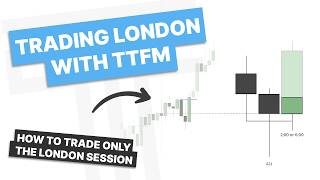

The 3-Step London Session Model
47sClear, structured trading framework that viewers can immediately grasp.
▶ Play Clip"The video delivers a clear, actionable London session model with multiple examples, but the presentation could be more concise."
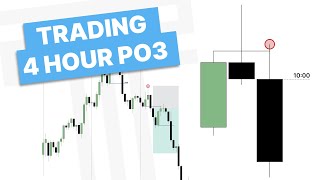
This video presents a structured trading model for the London session, centered on establishing a daily bias and aligning it with lower timeframe confirmations. The core concept involves letting higher timeframe wicks form—daily and four-hour—before trading the body with a protected swing on the 15-minute chart. The presenter demonstrates this approach through multiple examples on futures, gold, forex, and oil.
Before dropping to lower timeframes, establish a daily bias using the simplest method: a Candle 2 or Candle 3 closure. This involves identifying expansion, retracement, and internal-to-external movement, with a closure at a point of interest or fair value gap.
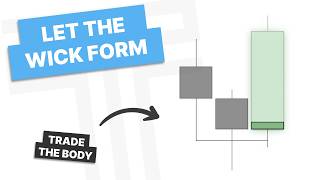
The core principle is to wait for the daily candle's wick to form before trading the body. A closure alongside phases of price confirms the bias, and the following candles should expand towards a draw on liquidity.
For the London session, look for a reversal either in Asia or during the early part of London, typically around the 2200 (10 PM) or 2 AM candle on the four-hour chart.
On the 15-minute timeframe, first confirm the swing point by looking for a change in the state of delivery (CISD), such as price closing above a series of down-closed candles that formed a low.
The complete model: have a daily bias, let the daily wick form using a four-hour profile, use a four-hour candle closure to find an expansion candle aligned with the bias, let that wick form as well, and then trade on a protected swing on the 15 minute for expansion.
During expansion day trades, you can hold the position towards the highs of the expansion candles or towards the close, as expansion candles have small wicks. The holding period can span the duration of the higher timeframe candle and potentially the next.
Advanced daily bias cases include identifying range plays. At a range low, look for phases of price to determine if the price will reverse to the other side of the range or consolidate for a continuation. An SMT divergence with a correlated asset can also help estimate continuation targets.
A candle 2 closure that is a failure swing (sweeping a previous high but failing to close above it) can still be traded, but requires more confirmation on lower timeframes, such as cleaner structure and continuation. Failure swings near the reversal point are concerning, but less so if further away; still demand more confirmation.
On a daily chart for gold, if we have expansion into a fair value gap, the bias could be for a retracement. A four-hour candle 2 closure allows anticipation of candle 3 to go higher. Small wicks still allow for significant daily range (e.g., 100 points).
On the 15-minute timeframe, a deep run is only acceptable to trade if there is SMT (Smart Money Technique) divergence on the low. If trading around that area, SMT is a prerequisite for confirmation.
When holding with higher timeframe candles, you can use a time-based exit at the end of the candle's range, or just hold for the expansion of candle 3 and 4 for optimal risk-reward.
When trading Forex, the timing will be off by an hour due to different higher timeframe opens. The core principles remain the same, but this adjustment is necessary.
On the 15-minute chart, a change in the state of delivery confirms the swing point (low of the day). A continuation forms a sequence of higher lows (protected swing). Entries can be taken on the continuation or after a new higher swing forms.
The goal is to align the daily candle and four-hour candle for expansion, then get onside with protected swings. This can lead to 2R to previous day's highs. If an expansion day is caught, holding a runner towards the end of the day yields excellent risk-reward.
The model does not depend on kill zones or session times. What matters is that the higher timeframe candles have formed their wick. As long as that condition is met, entry can be taken regardless of the entry time (1900, 2200, 1 AM, etc.).
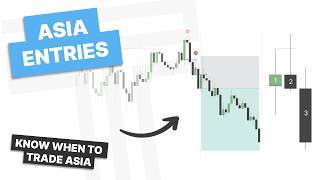
While this is a London session model, it can also be used during Asia and New York sessions. It is presented as the preferred method for trading London, but the logic is universal.
If London forms the high or low of the day, trade a London reversal. This is essentially a four-hour candle forming its wick in London, and trading it with a 15-minute CISD or continuation.
In some scenarios, a V-shape reversal may not offer a clear continuation immediately. In that case, a positional entry can be considered. Losses can happen, but the model's logic is consistent.
The central idea is to trade the daily wick. Let it form, let a four-hour wick form, and trade that expansion using London session as the entry point. If an expansion day is caught, the move higher is significant.
Daily Bias is the Foundation
Focuses on establishing a clear bias before any lower timeframe action, a core principle for any trading setup.
00:17The 'Wick Form, Trade Body' Rule
This is a distinctive rule that directly contrasts with many traders' habits, emphasizing patience and avoiding premature entries.
01:10Time-Based Exits
Offers a specific strategy for exiting trades based on the nature of expansion candles, which is a practical tip.
03:04Failure Swings Demand Extra Caution
Addresses a common, tricky scenario, providing a concrete rule for when to require additional confirmation.
05:37Lower Timeframe Wick Formation > Kill Zones
Challenges conventional wisdom on trading sessions, stating that the wick formation is more important than specific entry times.
13:43[00:00] How's it going everyone and welcome back to another video. In this video we are going to talk about a London session model.
[00:17] We've gotten a lot of comments about this, so let's get into the PDF. So the first thing before you drop down to deliver timeframes is you need to establish a daily bias. Now you can do this in many different ways, using phases of price, daily closures, as
[00:31] well as EQ, as I talk about in previous videos, but the most straightforward and simple way to do this is using a candle 2 or a candle 3 closure. So here you can see we have expansion, a retracement, and then we're going internal to external,
[00:46] and we have a candle 2 closure at a point of interest or this fair value bet. So then we can anticipate, if we have confirmation on the lower time frame, candle 3 to expand higher.
[00:58] Now with candle 3 getting a good closure, and here it is closing over the series of down-closed candles into this gap, or this singular one, so a new protected swing, we can also anticipate candle 4 to go higher.
[01:10] Essentially, we need a daily bias before going into the day. Once we have that daily bias, and in this example it will be bullish, the goal is to let the wick form and then trade the body. We don't want to be trading this candle before its daily wick has formed, otherwise it needs to make a new low.
[01:27] So what we're going to do here is once again wait for a closure alongside the phases of price. As you can see, we have a candle to closure. We could then anticipate the following candles to expand, and if our bias is right, they should expand towards some sort of draw on liquidity.
[01:43] Now with London Session specifically, we're going to want to see that reversal either in Asia or the beginning parts of London. So usually the 2200 candle or the 2am candle for the 4 hour profile.
[01:56] Now once we have that candle closure, we will drop down to the 15 minute time frame and what are we going to do on this time frame? First thing we want to do is confirm the swing point. How do we do that? We look for a change in the state of delivery.
[02:08] So we find the low, find the series of candles that made that low. price close over it? Yes it did. So now we have the confirmation that this reversal has formed. We have the anticipation that price can trade higher in this following candle. So what are we
[02:23] going to do next? Well we want to let this wick form and then trade the body of that candle. So we are going to wait until we can anticipate that wick to have formed which most simply is waiting for the intracandle change in the state of delivery and then we'll look to get on side
[02:37] to let this trade higher. Now what are we doing within this model? We are having a daily bias and we're letting that daily wick form using a four-hour candle or a four-hour profile. Using
[02:49] that candle closure, we're finding an expansion candle that aligns with that daily bias. From there, we are letting the wick of that expansion candle form as well. We've let the daily wick form, we've let the four-hour wick form, and once we've anticipated both of those to have formed and we
[03:04] have some sort of protected swing on a lower time frame, in this case the 15 minute, we'll look to it on side and trade that expansion higher. Now if these are expansion candles you can hold towards the highs of these candles or towards the close as expansion candles have small wicks. So you
[03:19] could expect to hold this for the duration of this higher time frame candle and potentially even the next as it reaches for its higher time frame draw on liquidity. Let's get into trading due and go over a few examples of this. So here we are on the daily chart on ES and we're going to be focused
[03:34] more so on the lower time frame price action because I have a lot of videos on the daily chart, but I am going to give that daily context. Now we know the most simple way to get a bias is using a candle 2 or a candle 3 closure on the daily chart, but I am going to talk about a few
[03:48] more advanced ways and advanced scenarios. So what you notice here, we have a range where we have taken out the range high and we trade to the range low. What do we want to be looking for at a range low? We want to look for the phases of price. Does price form a reversal here or does it consolidate
[04:05] for a continuation right because we have expansion into a low do we expand out to reverse to the other side of the range or do we consolidate or retrace for a continuation signature so looking at this candle here I would say that a consolidation or a retracement And we have an SMT off this previous high with YM So with that I could be looking for
[04:26] a continuation lower. What would be a continuation lower? We reach into our previous day's low. Now looking at our correlated asset or NQ, we could also be looking for it to trade to its
[04:38] range low if we're not going to reverse with that SMT. So taking a look at this, we have a bias, we have a framework. We're looking for price on the indices to trade to its previous day's low.
[04:51] That is our daily bias, and that's what we're going to go into the four-hour chart with. Now, going into the four-hour chart here, you can see we have this SMT, which I'll go ahead and label, and I have the daily candles marked up. How do I have the daily candles marked up? I'm
[05:05] using my indicator, put it on daily and hourly, and I turn off all the model. That way, I just at four candles with the EQ and I can see what the daily chart looks like. So going into this next day, if we are looking for price to trade into this previous day low, we want to find a swing
[05:21] point on the four hour chart to trade away from. Right here, we do get a little swing, not really something I trust because it is quite internal, but also early in the day. Let's see if we get anything else out of this. More of a consolidation. And then we do have a pretty aggressive move lower
[05:37] here however it did fail to take out this previous high and that's the advanced example we're going to get into here this is a valid candle to closure because you can see it swept out its previous candle and then closed below but it is a failure swing so in a case like this it doesn't mean you
[05:54] cannot trade it it's just i would prefer there to be smt here if i am going to trade something with failure swings i must demand more confirmation on the lower time frame i need some pretty clean structure and continuation to anticipate that. So we do have a candle closure. We can go look
[06:09] to trade away from this so we can go down to the 15 minute time frame. So down here on the 15 minute time frame I'm going to include my indicator but also a daily candle on the right side here. So we'll go ahead and remove all these drawings so you can see what's going on here and play into
[06:23] this next candle. Now like I said I have failure scenes on the high here. That's pretty concerning if you're trying to trade around the reversal because it's quite close. Here we are a bit further away from that reversal. So I don't mind trading away from various things when we're that
[06:37] far away, but I need to demand more confirmation or a clean structure in this continuation or candle three. So here you can see London forms a reversal. This is kind of end of London looking
[06:49] for entry beginning in New York, but we'll also get into some examples where we're taking those entries in the London session for our candle. So what am I going to wait for here? Let D wake form and then look to trade the body. So what I have, a very nice and aggressive reversal here, which
[07:05] forms a protected swing. So I could look to get on side on the open of this candle three, put myself on the protected swing, and then where am I looking for? That previous day's low, which we already
[07:18] talked about and defined as our draw on liquidity. Now, why does this make sense? Our whole goal is to let the daily wick form, let the 4-hour wick form, and then look to trade away. So we've
[07:30] anticipated that the daily has formed its wick earlier in the day, and then we have a 4-hour candle 2 closure that we can be looking to trade away. So with that, I'm just going to look for a continuation in candle 3 because I want to let this 4-hour candle form its wick as well. Once
[07:46] we have anticipated it has formed its wick from an inter-candle change in the state of delivery, I can look to get on side and now the main thing I want you to take away is all of these candles are going in the same direction. We have anticipation for a bearish expansion candle, anticipation for
[08:02] a bearish expansion candle. They both form their wick and we have a protected swing. We can look to trade this lower and there we go ahead and hit our previous day's low or our target for that day.
[08:14] Let's get into another example. So here we are in this next example and we are on gold. Here is the daily chart and the monthly chart. We have expansion. I'm doing this as a retracement because we are reaching into a fair value gap here. So what would we be looking for
[08:30] if we react here for price to trade to this previous high? Now we inside this daily candle here Let drop down to the four hour timeframe Now Now down here on the four hour time frame what am I looking for I looking for a candle closure
[08:44] There you can see we have that four hour candle two closure. We can anticipate candle three to go higher. Important thing to note is, yes, we have a little bit of a wick here, but if we look at our daily range of these expansion candles around 100 points,
[08:57] you know, we're halfway through it. We could see an expansion towards the previous EQs here. So still have a lot of range left that is important. A small enough wick to still allow for range. So let's go down to the 15 minute time frame here. Now down here on the 15 minute time frame,
[09:13] what do we notice? We notice we do have that c2 reversal, but we have a very deep run here. The important thing to note, I'll only ever look to trade away from something like this if we have fmt on the low, right? And if I'm trading around that area. So we now have a continuation that has
[09:30] formed with smt prior to the open the new higher time frame candle we could one look to take that as a positional entry or wait for a new continuation to form so right here we have that new continuation
[09:43] that has formed we could look to get on side with that and see if this works right what would be r2r right around back towards that daily open or we could look back towards that daily eq right go back up into the range those previous highs let's see what happens
[09:57] right there we hit r2r and let's see what happens right if we have this four hour candle expand right and we get another expansion candle on the four hour you can see this is what i was talking
[10:11] about in the pdf where if i am on slide with these higher time frame candles i can hold towards the end of the higher time frame candles range right that's a time-based exit or i can just hold towards what candle three and candle four expanding and that's where you get really good
[10:26] risk to reward. The main point of what I'm trying to show here is we have anticipated the daily WIC to form. We have a continuation that has formed. A little bit of a sketchy equal low down here. We do have SMT, but we form a new continuation. And then you can get on side with that
[10:42] as we continue to trend or move higher. That is another example. This is a reversal day. As you can see, we do reverse out of that fair value gap. We are looking to trade that. So it is more advanced trading candle too but we do get that nice daily range back towards that 100 points I
[10:58] was talking about. So let's get into another example. So here we are in our next example we are on GBPUSD now the only difference in going to Forex is the timing will be off by an hour due
[11:10] to their higher time frame opens. What do we have here we have a sweep of a previous low with a candle to closure so if we have an hourly confirmation we can anticipate this next candle to expand higher, which we do. Now going down to the four hour time frame, what is the
[11:25] whole point of this model? We are anticipating this next daily candle to expand higher. We're wanting to let that look form. So we want to see a four hour swing point form before trading it higher, right? Because we have expansion. We want to see some sort of new swing to trade away from.
[11:41] Now looking here, what do we have for points of interest? We just have a fair value gap here. Let's take a look. As you can see, price reaches into that gap, it sweeps it out, and forms a candle to closure.
[11:53] So you can see the wick, we could anticipate that to have formed because of this candle to closure, and it is respecting the upper half of this daily's range. So what would we do now? We go down to the 15-minute time frame.
[12:06] So down here on the 15-minute time frame, we have that candle closure. Let's go ahead and let it close. And what do we have? We have a nice change in the state of delivery to confirm that swing point or the low of the day.
[12:18] We also have a continuation. So really, I could take any entry right now with my stop on this previous low. Or if I want to let this 4-hour candle form its wick as well, I just let a new swing form here.
[12:31] Let's see what happens. Right here, we have an ideal candle to closure because we are trading that protected swing at the same time. we could lift to take this entry here, and that allows us to get 2R to those previous
[12:43] days highs. And we get that 2R, but if we go back to our daily timeframe, we're just looking for our daily candle to go here no we looking for it to expand So if we do catch an expansion day that where you can get really good risk to reward if you hold any sort of runner towards the end of the day So if we let this play out what do we have
[13:04] We have now London session opening within a continuation. This is also something we could trade. We just want to let that rick form its low. You can see a pretty deep opposing run. We just need to find some sort of reaction here.
[13:17] And that is a pretty aggressive reaction. So then we could also look to get on side with London, right? So this is an early London, late Asia type of move. This could also be a London session trade. So I could just get onside anywhere in here.
[13:30] I stop around that low and then looking for 2R as well. So let's see what happens here. And we hit that almost immediately. As you can see, the whole goal of this model is to align the daily candle for expansion,
[13:43] the 4-hour candle for expansion, and then look to get onside with protected swings. I don't really care too much about kill zones, any bets have heard me say that. At the end of the day I don't care if I'm entering at 1900, 2200, or 1am or 2am.
[13:59] All that matters to me is that the higher timeframe candles have formed its wick. So as long as the higher timeframe candles have formed its wick, I can look to get on site. So this is a London session model, yes, but you could also use this in Asia, you could
[14:12] also use this in New York. But this is my preferred method for trading London. Now before we end this video, let's get into one more example where you're trading in London reversal. So here we are in this last example.
[14:25] We are on oil futures. We have on the daily chart here a candle to closure. We have a nice V-shaped reversal. And if you take a look, you do have that change in the state of delivery here on the hourly chart.
[14:37] If you wanted to check that, you can see we have a valid model on the daily. So this is the most straightforward. We have a candle to closure on the daily. We have that bias. Now we're down on a four-hour chart. And what are we waiting for? we're looking for a swing. You can see 2200 didn't form that swing, but we do have a gap right here
[14:54] that we could be looking to trade away from. Now, if I am trading in London, there are many times where London will form the high or the low of the day. In that case, how am I going to trade it? I'm going to look for a London reversal. So essentially, that is a four-hour candle forming
[15:09] its wick in London. I'm trading that with a 15-minute change in the state of delivery or a continuation. So here you can see we have a very deep opposing run or a reversal forming in London.
[15:21] Now let's talk about this for a second. Once again, a more complex example. There is no series of candles in here to trade off of, right? This would be our change in the state of delivery. So we can wait for that or we can use this V shape and seek a continuation.
[15:35] But either way, we're just looking for a continuation right now to get on side with this reversal. And you can see we may not get on side in this candle. This sets up a positional entry, so we could try that. Let's see if we get 2R on that, or if we take a loss, right? Losses
[15:51] do happen. So here's right around that 2R mark. Let's see if we hit that. And we do eventually go and hit that after a bit of consolidation after running out these previous highs. So this isn't as good of an example as I was hoping for on the lower time frame, but
[16:09] the idea remains the same. It's the same logic. All we're looking to do is trade that daily wick, right? Let that form and trade away and catch that using London session as a reversal or a
[16:21] continuation of Asia reversal. Let the daily wick form, let a four-hour wick form, and look to trade that higher. And you can see if we do catch that expansion we do move it higher or you could even
[16:33] trade this continuation in 10 a.m. as it forms a reversal into an expansion candle. Now I hope this video was helpful. I gave a lot of different ideas in here that are not so straightforward so don't
[16:45] get too confused on them but just remember the same idea. If you have a daily bias you want to let that daily wick form then use the four hour candles to let that wick form have either a candle closure or a reversal candle trading c2 and then find a protected swing that aligns with both of
[17:02] those. I hope you found this video helpful. I'll see you guys in the next one. Have a good one.
⚡ Saved you 0h 17m reading this? Transcribe any YouTube video for free — no signup needed.