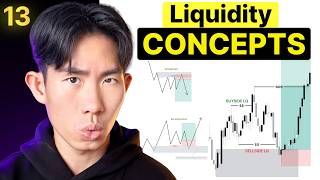

Why You Keep Getting Stopped Out
60sDirectly addresses a common trader frustration with a bold claim that it's not bad luck but market mechanics, creating immediate relatability and curiosity.
▶ Play Clip"Delivers a solid, in-depth explanation of liquidity and inducement, matching the title's promise, though it could be more concise."
This video explains the concepts of liquidity and inducement in trading, which are crucial for understanding market movements. The speaker argues that price moves are not random but are driven by the need to sweep liquidity from areas where stop losses and pending orders are clustered. By understanding these concepts, traders can avoid being stopped out prematurely and align their trades with the actions of 'smart money'.
Traders often get stopped out before the market moves in their intended direction. This is not bad luck but the market seeking liquidity to fuel its moves.
Liquidity is where orders are resting in the market, including stop losses, breakout entries, and pending orders. It acts as fuel for price movement.
Liquidity is commonly found above swing highs, below swing lows, above strong highs/lows, around trendlines, and at support/resistance levels. The more obvious the level, the more liquidity it holds.
Buy side liquidity is orders above highs (stop losses from shorts, breakout buyers). Sell side liquidity is orders below lows (stop losses from longs, breakout sellers).
Institutions need large orders to fill their positions. They induce retail traders to place orders, creating liquidity, which they then sweep to move price efficiently.
A liquidity sweep is price taking out a previous high or low, triggering resting orders, often forming a V-shape reaction. It happens before reversals or continuations.
A liquidity zone is a point of interest (supply/demand zone, order block) that has swept liquidity. This adds confluence, making it a stronger area for price reaction.
Inducement is a move or structure the market creates to tempt traders into entering early, placing stops in obvious places, or believing a move is confirmed. It is the bait that generates liquidity.
Inducements often occur near significant points of interest like order blocks or liquidity zones, where retail traders are likely to pay attention and place orders.
Liquidity is the target, inducement is the bait. They work together: inducement builds up available liquidity, which is then swept, allowing the market to move.
Nothing happens by coincidence in the market. Every move has a purpose. Understanding market mechanics allows traders to read moves and trade with clarity and confidence.
Understanding liquidity and inducement is essential for trading success. By recognizing where liquidity sits and how inducements bait retail traders, you can avoid being the liquidity and instead align with smart money, improving your trading results.
What is liquidity in trading?
Liquidity is where orders are resting in the market, including stop losses, breakout entries, and pending orders.
02:10
Where does liquidity commonly sit?
Above swing highs, below swing lows, above strong highs/lows, around trendlines, and at support/resistance levels.
03:33
What is buy side liquidity?
Orders sitting above the highs, such as stop losses from shorts and breakout buyers.
07:34
What is sell side liquidity?
Orders sitting below the lows, such as stop losses from longs and breakout sellers.
08:14
Why does price need liquidity?
Price needs orders to move efficiently. Liquidity provides the fuel for price to move in a desired direction.
10:06
What is a liquidity sweep?
Price taking out a previous high or low, triggering resting orders and stop losses, often forming a V-shape reaction.
14:29
What is a liquidity zone?
A point of interest (supply/demand zone, order block) that has swept liquidity, adding confluence.
18:55
What is an inducement?
A move or structure the market creates to tempt traders into entering early, placing stops in obvious places, or believing a move is confirmed.
23:51
How do liquidity and inducement relate?
Liquidity is the target, inducement is the bait. Inducement builds up available liquidity, which is then swept, allowing the market to move.
29:14
What is the pattern to remember?
Inducement builds up available liquidity, then price sweeps the liquidity, then the market moves.
51:10
Liquidity Definition
Provides a clear, foundational definition of liquidity that underpins the entire video.
02:10Institutional Logic
Explains why institutions need liquidity and how they manipulate price to get it.
10:06Inducement Concept
Introduces the key concept of inducement as bait, which is essential for avoiding traps.
23:51Liquidity and Inducement Relationship
Clearly summarizes the relationship between the two concepts, making it actionable.
29:14Market Mechanics
Emphasizes that every market move has a purpose, encouraging a deeper understanding.
47:35[00:02] price started to reverse against you, go and sweep your stop loss, and then move and sweep your stop loss, and then move exactly in your original direction? I know how frustrating that is, and a lot of traders think that this is just bad
[00:15] luck. It's not bad luck, bro. It is just the market seeking liquidity. It is just the market seeking the fuel it needs to move price in its desired direction.
[00:28] And if you do not understand how the market uses liquidity and inducement, you will keep getting baited into the wrong move before the real move actually happens. So, in this lesson, I want to break down liquidity concepts and
[00:42] inducements. These are, to me, the biggest game-changer in my trading. Like, when I really understood liquidity, and I started trading like someone who knows their which is really just spotting
[00:55] liquidity, the amount of times that I got stopped out reduced significantly, which also means that lesser losses. And when you incur lesser losses, you automatically incur more profits.
[01:09] So, if you don't understand where orders are sitting and how the market is drawn to them, you will keep on looking at a chart from a lens of a trader who is lost and inconsistent and is confused, right? The price action that is going on
[01:23] here just looks very random to you. But once you understand liquidity, like I said, it's the fuel, you start to see why price tends to sweep certain highs or lows or certain zones before making its real move. So, yeah, this is going
[01:39] right? So, please make sure you pay attention from start to the end. I can triple guarantee you, if you really understand liquidity, you will just get much less often. Does that make sense? Like,
[01:54] much less Okay, that it isn't a even a real phrase, but like you would just get stopped out a lot less frequently. Okay, I don't even know what I'm saying. often. That's it, okay? So, what is liquidity? Liquidity is where orders are
[02:10] resting in the market itself. It includes stop losses, breakout entries, and pending orders. Right? So, basically, stop losses or Right? So, basically, stop losses or stop orders, and also any sort of like
[02:24] other orders where there is some form of liquidity right there. And it's basically the fuel for price movement. The market is often drawn towards these areas because this is where a lot of
[02:36] orders are clustered. Right? And this is where liquidity tends to be sitting at. So, the market is to sweep the liquidity and then move in the desired direction. So, like in this case right here, what
[02:50] a sell over here without understanding liquidity, you'll most likely be placing a stop loss above this swing high right here. And then as a result, guess what? This is your stop losses, but this is liquidity for the
[03:03] over here when price came down, there was not enough fuel, right? There was just continue going down there to smash a TP. As a result, it needs to grab more fuel. And it's going to grab more fuel by going up there and sweep some
[03:18] Which is where you place your stop losses, which is also where other retail traders tend to place their stop orders, and then reverse and hit back down. Right? So, in this case, this is actually a liquidity sweep.
[03:33] So, you might be wondering where does liquidity usually sit at, right? Like smart money need? Now, these are the areas, some common areas where you can find liquidity. Above a swing high
[03:47] and below a swing low. Okay? Above a strong high and below a strong low. Now, just think about it. When retail traders, they see like a swing high just because price is just reverse and hit back down, they're going to be placing a
[04:02] stop loss above those highs. Same thing for people who want to enter for a buy, they're going to be placing a stop loss below this lows itself. Same thing in this strong high and strong low right here, right? So,
[04:15] is resting liquidity behind any high or traded in the past. So, in this case, price came down, goes up, pulls back, and then goes up once again creating a strong low right here.
[04:28] over here. So, as long as price have not swept that price point, that is going to be liquidity. lows, these are very common chart patterns which a lot of you guys are
[04:41] taught to memorize, you know, if you enter for a double top, you should enter above those highs. If you enter for a longs, when you see a double bottom, you should place your stop loss those lows. Once again, stop losses equal liquidity.
[04:55] Okay, not only are there stop losses, but there are also stop orders, which is pending orders. Because a lot of people, they might want to trade the breakout of area right here, right? So, what happens is that they might place like a stop
[05:08] order right here, so that when price eventually goes up there, trigger their stop order, they are entered into a long position. As a result, you know, price can benefit from this move to the upside. So, that's not just stop that is
[05:21] contributing to the liquidity, but there's also your stop orders as well. Okay, so, once again, that is just the fuel the market needs fuel the market needs to move in a particular direction.
[05:35] And another area will probably be like trend lines just like this. Okay, so, once again, another very common retail concept is to, you know, when price is you draw a trend line below it just like this, connecting all the higher lows. Or
[05:49] connecting all of these lower highs. And as a result, a lot of retail traders placing their stop losses or stop orders below the trendline itself, guess what? That is untapped liquidity. Same thing as support and resistance
[06:02] levels, right? A lot of retail traders are taught to sell at resistance level their stop loss above the resistance level. And then when they are taught to buy at support level, right? Then they are taught to place their stop losses
[06:15] below the support level itself. The more obvious a level looks like to the public, the more likely liquidity is resting there. if you want to get stopped out less often, you need to start viewing the
[06:30] market from the lens of a professional trader, rather than from the lens of a Which means you need to do the opposite of what the sheep what the herd is actually doing. If everybody is looking for longs right
[06:43] for longs. If everybody is thinking that you should place your stop loss below these lows right here, you probably should see that price point as a area where there is sitting liquidity, rather than placing your stop loss just
[06:55] Okay? So, when you start to understand liquidity, what happens next is that you stop viewing the market from the same lens in which you have been viewing it for the past few months, for the past few years.
[07:09] same results. there's going to be liquidity, trendlines, support and resistance level, right? Very obvious swing points, there's going to
[07:22] Uh basically, like loss right there, then chances are there's available liquidity resting at the area there. Okay? So, now let's talk about another
[07:34] thing which is buy side and sell side liquidity, right? So, you can see there is liquidity right here. Now, this right here is what we call the buy side liquidity and this is what we call the sell side liquidity.
[07:46] Okay? So, let me just tell you what that means. Buy side liquidity is basically the orders that is sitting above the highs. Okay? So, this is the stop loss sell right here, they place a stop loss above those highs. And then there is
[08:01] also going to be breakout buyers that is trying to enter above the high right out this high, they're going to be enter for long position. So, as a result, all of these build up your buy side liquidity. Sell side liquidity is the
[08:14] opposite, right? It's the orders sitting below the lows just like this right So, these are the stop losses from buyers who are trading the reversal and low, right? People who are placing their stop orders right here so that when
[08:27] price comes down, they get triggered for a sell position. So, this contribute to your sell side liquidity. Okay? Sell side liquidity and buy side liquidity. the high, right? So, price comes up there, sweep the liquidity above this
[08:44] high and then reverse, this means that it's taking buy side liquidity. And then in this case, if price comes down and sweep the low and then reverse, it means that it's taking sell side liquidity. Okay? So, just remember that
[08:58] below the lows is sell side liquidity, above the highs is buy side liquidity. And if you don't want to remember that, it's fine as well, right? Because I honestly don't even bother to remember it. I just name it as liquidity, right?
[09:11] matter whether it's buy side or sell side liquidity, it's just liquidity. But obviously, if you're looking for shorts, you want to wait for price to sweep the liquidity above the highs. Right? You want to wait for price to sweep the sell
[09:24] side liquidity, not the buy side liquidity, right? So, in this case, price take out the available liquidity above the highs, then I can look for downside. So, ideally, I want to see price sweep
[09:37] looking for longs, I want to see price take out the liquidity sitting below the lows and then move in my desired direction. So, that my friend is the basics of liquidity, right? It's really just as
[09:53] simple as that. And once again, understand that if you cannot spot the liquidity, then you are most likely the liquidity. If you cannot spot the pattern, then chances are you're going to get trapped
[10:06] in the pattern itself. Let's talk about the logic behind this, okay? Why does price needs to seek this magical thing called liquidity? Remember, price need orders to move efficiently. Liquidity provides the
[10:21] Right? Which is why a lot of times, before a big move happens in the market, price need to come up to sweep some liquidity or come down to sweep some liquidity. Right? S- And this [snorts] will allow
[10:35] institutions to fill their large positions and cause price to move very downside. Okay, so once again, understand the logic behind it. If institutions today, they want to enter for a billion dollars
[10:49] worth of sell orders, chances are there is no one on the other side of the market that have that billion dollars worth of buy orders that is willing to, you know, that's able to fulfill their their billion dollars
[11:01] worth of sell orders. So, if there is no one that is liquid Smart money institutions, they need to get that liquidity from the retail traders itself. So, as a result, they are going to manipulate price or
[11:15] whatever you like to call it, to induce retail traders, right? To enter in a particular direction, place a stop loss at that area right here, so that later on they can sweep the liquidity, right? Grab the liquidity they need to cause
[11:28] price to move in where they want to it to move to. Right? So, that's the whole logic behind liquidity sweep. It's basically the fuel smart money need in order for them to manipulate price and cause price to move
[11:42] manipulate price and cause price to move either up or down significantly. doesn't just move randomly. Price needs to go up there, sweep some liquidity
[11:54] first, and then move significantly to the downside. Same thing right here. You liquidity below these swing lows right here, and then started to reverse and hit back up. Same thing right here. Price came down here. Guess what? We got
[12:07] down, sweep the liquidity below the support level, and then go up. Okay, so yeah, that's pretty much a liquidity sweep. You know what? Let me
[12:19] just share with you guys some examples. Let's try to apply whatever that we have learned here first before we move on to inducement, which is something that is a little bit more complicated. Okay, so let's try to identify some low liquidity
[12:33] train your eyes to spot these patterns itself. Remember, above swing high, below swing lows, above strong highs or lows, above and below support and resistance levels, and below and above trend lines
[12:48] itself. Okay, so let's train your eyes to spot the liquidity. So, in this case, okay? So, you can see price came up there, pulls back, swing high. available liquidity sitting above those highs. And just as expected, guess what?
[13:04] way. There was not enough fuel for price money need to go up there, sweep the available liquidity, trigger the stop losses, you know, stopped out all the retail traders, trigger all the stop
[13:17] orders, and now they got all the good old buy side liquidity for it to cause price to collapse significantly. Right? So, this is where caused price to just move very significantly to the downside.
[13:34] back. Right, so you can see right here, price came down, pulls back, price comes down, pulls back, and then goes down. So, a lot of retail traders, they might right? A little good old trend line right there. And guess what? There is
[13:48] liquidity above those trend line. Or even just above these highs itself here, pulls back, comes down, pulls back, and then goes down. So, this is a swing high. This is also a swing high. So, guess what? There is liquidity above
[14:02] these swing highs itself. And just as expected, price came up there, swept the liquidity above the swing highs, and then caused price to reverse. Okay? So, another example would probably be right here. Price went up, pulls back, and
[14:15] then goes up here, creating a swing low. Right, this time swing low, price came down, swept the sell-side liquidity, and then reversed and caused price to go up. sweeps, which is really just
[14:29] price taking out a previous high or low and trigger the resting orders and the stop losses there, and then cause price to reverse. It usually comes in the form of like a V-shape reaction, which means that price
[14:42] must move down very aggressively and then move back up very aggressively, forming what we call a V-shape reaction. Right, so in in this case, clearly there is a liquidity sweep because after price take out this low right here, right?
[14:57] Sweeping the liquidity below this low, what happened was that we got aggressive selling pressure to the downside, but it could not sustain itself. Right, because it's just smart money manipulating price, causing price to come down, sweep
[15:09] the next thing is that price started reverse very upside, right? Because there's a lot of buying pressure, a lot of buying momentum, right? Creating a V-shaped reaction just like this.
[15:25] So, liquidity sweep tends to happen before price reverse, before price actually continue, before a deeper retracement. Okay, so is a liquidity sweep does not automatically means that the market is
[15:39] this case, just because price of the liquidity below these lows right here market is going to reverse from bearish to bullish right now. structural highs, right? So, in order for the market to shift bullish, it
[15:55] right here, giving us a market shift like what we covered. Okay, so yeah, let's try to spot some more liquidity right over here, very obvious one. Price came up here, pulls
[16:07] back, goes up, pulls back, and then goes up, pulls back. Once again, this is what retail traders would deem as your resistance level, right? Once again, the for a sell right here, placing their stop loss above those highs itself. But,
[16:21] little did they know those are actually just our sweet old available liquidity for smart money to sweep before price continue heading back down. Right, so you can see a lot of instances where smart money is just sweeping liquidity
[16:34] particular direction. It happens every single minute, every single single second, every single hour, every single day, right? Because once again, that's just the fuel the market needs in order for it to move in a particular
[16:49] uh direction. Right, maybe I can give you guys two more examples. Right here, when price comes down, comes down, pulls back, and then goes down, and then goes up again. In this
[17:03] But, if you zoom in here, you can actually see what did price do? Price goes down up, pulls back, goes up, pulls back, and then sweep the liquidity below these lows, and then push to the
[17:16] upside. Right, so this is also a liquidity sweep right here. sweep on the screen right here. I'm not going to identify every single one of them because that's going to cause this video to be like freaking 1 hour long. I
[17:30] just want to give you a few more examples just so that you can really see charts and learn how to identify and spot liquidity on the charts. So another there, pulls back, goes up, swept the liquidity, and then comes down. Okay, so
[17:44] you can see another one right here. And then another one like right here as well. Where price came down creating a new what? Above the swing highs there's liquidity. Price swept that and then you
[17:57] can see price created a sharp V-shape reaction causing price to move down And where did price gravitate towards next? It gravitated towards this low right here, this swing low that was formed right here to grab the sell-side
[18:11] went up there, swept the buy-side orders sitting above the highs, and then came down here, swept the liquidity bit these lows right here, and then caused price to move up.
[18:26] Okay, so those are just some instances where there is very obvious liquidity and then price swept liquidity and then moved in a particular manner. So in this example, right? You can see this trend line right here.
[18:40] Guess what? There is going to be liquidity sitting below these lows right here. Okay, so we can expect that to get swept before price actually move up or swept before price actually move up or move down.
[18:55] about the concept of like a liquidity zone since we just covered liquidity. demand zones, we talked about order blocks, right? So those are our point of interest. Those are the zones in which smart money has entered for a large
[19:09] amount of buy or sell orders. If you combine that with liquidity, You have your liquidity zones. Okay, so liquidity zone is simply a point of interest that swept liquidity.
[19:23] It's simply a supply and demand zone that swept liquidity. It is simply an order block that has swept liquidity. So, in simple English, it's basically an area where price first takes an obvious
[19:37] area where price first takes an obvious high or low, triggers the resting orders right there, and then reacts from that point. Okay, just further giving us more evidence that that is indeed a price
[19:53] point or a zone in which smart money is focusing on right now. For example, in this case, you got an imbalance right here, so we can identify the order block. But, is this just an ordinary order block? No. It is an order
[20:08] block that swept liquidity from these lows itself, that swept the sell-side liquidity. So, as a result, this is an order block plus liquidity, which is also our liquidity zone.
[20:22] quite strong, right? There's a chance for price to react from the order block itself. But, now you're telling me that this order block is not just an ordinary order block, but it also swept liquidity, which means that
[20:35] this is really indeed a price point, a zone in which institutions are paying attention to. So, as a result, when price returns to this area, we can expect a movement to the upside. And just as expected, look at what
[20:49] happened after this order block was formed. Price came up, pulls back, comes know, once again sweeping some liquidity below these lows. And then when that happens, cause price to move up significantly.
[21:07] supply zone, right? Because this is the origin point that led to price, you know, coming down here very significantly. And is this just any ordinary supply zone? No, it's a supply zone that swept liquidity. Okay, price
[21:21] came up there, swept those buy-side liquidity above those highs, and then caused price to reverse. So, supply zone plus liquidity forming our liquidity zone, which means that the next time price actually came up there,
[21:33] we can expect some form of sellers to be stepping into the market causing price to move down. And in this case, that's exactly what area here. In fact, he actually broke past a little bit because maybe there's
[21:47] not enough sell orders within this area itself. So, as a result, it needs to sweep the liquidity above these swing highs right here, and then causes price to move to the downside.
[22:00] Okay, just to show you like an example in live market condition right here. What happened over here was that price came down over here, goes up, comes down, and then goes up.
[22:13] So, we know that there is available liquidity sitting below these lows right And then this is our good old liquidity sweep came down, swept the liquidity below those lows, and guess what? It also came
[22:29] down and mitigate this demand zone that we have right here, right? This demand zone that caused price to actually move to the upside. And is this just a demand zone? No, this is a demand zone that swept liquidity, right? Because if you
[22:41] price went up, pulled back reacting from this supply zone, goes up, liquidity below these lows, and then move to the upside. Right? So, this is move to the upside. Right? So, this is actually our liquidity sweep over here.
[22:56] Okay, so this is a demand zone that swept liquidity, and by the way, also here. And you can see, where did price pull back to? Price pull back to this demand zone, swept the liquidity uh below these
[23:10] lows, and then look at the price action that's going on right now in the live market condition. Price is moving up significantly because it has gotten all the fuel it need to actually move up very, very fast.
[23:23] Because of the liquidity, right? Because price swept liquidity, and also price has mitigated this demand zone that swept liquidity. So, you can just imagine the sheer amount of like buy orders that are just sitting at this
[23:37] price point right here. At this 1.17 area. It's just your supply and demand zone or your order block or any point of interest that swept liquidity. Now, let's move on to the next concept
[23:51] that I want to talk about today, which is called your inducements. Okay? Inducement is basically a move or a structure the market creates to tempt traders into entering too early, placing
[24:07] stops in obvious places, or believing the move is already confirmed. So, what that basically means is that inducement is the bait before the real Inducement is like, "Hey, dumbass retail trader, you should
[24:22] your stop loss right here because this pattern has just appeared into the market." It's the bait. It's the bait for you to It's the bait. It's the bait for you to actually generate liquidity for them.
[24:36] Okay? So, that's what inducements are. They are basically traps to entice retail traders to enter early so as to generate liquidity.
[24:48] examples on like what they would look like. Basically, how inducement works is that the market tends to create a very tempting structure, right? Just once again, enticing retail traders to enter early. So, in this case,
[25:01] guess what? There is double top right here. A lot of traders, they see a double top in a downtrend, they're going to be entering for a sell right here. placing their stop loss above those double top, just like what we have
[25:13] mentioned right here, above the equal highs, generating what we know as And then later on, price went up there, swept the buy-side liquidity, and then reversed. So, in this case, the inducement was actually this double top
[25:27] right here. It was basically a pattern to induce or entice retail traders to enter for a sell position early and place their stop loss above those highs, generating liquidity for the smart money,
[25:43] thereby causing the real move to actually happen. yeah. Market creates a tempting structural, retail traders react to it, you know, by entering too early, and then they place
[25:55] their stop loss, or they place their stop orders, and that creates liquidity. Price then uses that liquidity before moving in the intended direction.
[26:07] people see a double bottom just like this, right? Price comes down, mitigate a demand zone, and then double bottom, people are thinking that, "Okay, the pullback is over, right? Right now, price is going to go up right here."
[26:20] liquidity, right? Little do they know price swept the liquidity, and then move Another thing that is worth noting is that inducements tend to happen when it's near a significant point of interest, near a order block, or near a
[26:35] liquidity sweep zone. Okay? Because, once again, these are the zones in which smart money know retail traders are going to be paying attention to. So, they're more likely going to lay traps at those zones to entice retail
[26:49] before, you know, the real move actually happens. Another one right here. Okay, so this is the exact same example that we have right here, right? Double tops. But instead of
[27:02] retail traders entering for sales right here, another group of retail traders, place their stop orders above those highs right here because they might want break out above those highs, they're going to be enter for a long position.
[27:17] is also another form of liquidity, right? Stop orders over here, price up the liquidity and then cause price to over here. And then also same thing as a strong
[27:30] high and a strong low, like just pretty much what we covered over here. Okay, so in this case, another example, price comes down, pulls back, goes down, pulls back, and then you can see this is price pulling back to this supply zone,
[27:45] minute price get a reaction from this supply zone, a lot of retail traders, And then they're going to be placing their stop loss above those highs. Thinking that price is just going to go down and go down and they're going to
[27:59] hit TP straight away. But that did not happen because price haven't swept So as a result, it don't price went up there, swept the liquidity and then moved to the downside. All of this could be avoided if you just
[28:14] understood the concept of liquidity. All of this could have been avoided if you could just acknowledge that that right there is an inducement. if you just got a little bit of patience. Okay, just wait for liquidity
[28:29] to be swept, then you enter for the position itself. traders want to buy at a strong low when know, they buy right here, place their stop loss below those lows. Also,
[28:44] going to be placing their stop orders here as well, right? Because the downside. All of these stop loss uh stop orders contributing to the liquidity that smart money need to cause price to move to the
[28:58] upside. So, that's the concept of inducement. So, liquidity is basically where orders are resting. Inducement is what the market creates to encourage traders to place those orders there.
[29:14] place those orders there. Inducement is basically the bait that generates liquidity. Okay, so liquidity is the target. Okay, so liquidity is the target. Inducement is the bait.
[29:30] hand together. You need the retail traders to be induced to enter into a long or short position early to generate liquidity. intertwined. So, with that being said, maybe let me
[29:44] just show you guys some examples on the charts itself. Like, let's look back at here. Okay, like the one that I literally just shared with you guys. Let's try to identify where the inducements are at.
[29:57] So, in this case, let's say price was like somewhere around here. And this is where, you know, we have identified a price in an uptrend. You got a bullish break of structure to the
[30:09] upside. And then this allows us to draw a demand zone over here. Okay, so we here. If you know how to draw a demand zone, know how to draw a demand zone. It's not that difficult, right? So, as a result,
[30:23] what will happen next is that retail traders are going to be looking for a here. Okay? So, some people might want to draw their demand zone at this pivot candle. Some
[30:36] like this. Okay, but retail traders know that when price reach this area, they're going to be entering for a buy position. So, as a result, you know, they just wait. Okay, they wait for price to comes up comes down to this demand zone. And
[30:50] when price comes down to this demand zone, this is where they're entering for In this case, this is not really a good example, right? Because after price mitigate the demand zone, it just goes up because this is actually a demand
[31:03] zone that swept liquidity. But let's say price did not go up straight away. Okay? Let's say this is the demand zone. And then price started pulling back to this demand zone. Comes up, pulls back,
[31:16] highs, lower lows, shifted bearish in a short term just to facilitate the pullback. And then later on price comes down and touch this demand zone. So, the minute touch this demand zone right here, a lot of video traders will
[31:30] be entice, induce to enter for a long position early. So, as a result, they here. Okay, they enter for a buy position right here thinking that this move is going to happen. Okay, no liquidity has been swept whatsoever yet,
[31:44] But they are in the fantasy land thinking that price is just going to magically go up because he has came down to this awesome beautiful demand zone that they've mapped out. But that is really not the case, right?
[31:57] instead of going up, these retail traders, you know, they They place a stop loss below those lows itself. A few minutes later, an hour later, price came down, swept the low right
[32:10] here, swept the the all the stop orders and also all the stop losses. Now, the retail trader is mad that they got stopped out. out?" And then next thing you know, price go up in that direction.
[32:25] Well, my retail trader, it's because you don't understand inducement. If you did understand inducement and liquidity, then you would know that price cannot move up without a liquidity sweep.
[32:37] So, you entering for a buy position right here is way too early. You are doing exactly what the smart money has planned for you to do. And that is to enter early. So, if you search up the the definition
[32:50] of inducement in dictionary, you will see that induce basically means entice, right? It's to incentivize, right? It's to seduce you to enter early. And that's what happened in this case, right? Smart money has seduced you thinking that this
[33:04] move is going to happen. So, you enter for a buy position right here. Or if you are a little bit adventurous, you might want to trade the breakout, right? So, the retail trader might want to place stop orders below those lows itself,
[33:16] right? So, that when price comes down, take out this low, they enter for a sell position. That's sell stop orders. All of these stop losses, all of these stop orders just add on to the available liquidity
[33:28] that is sitting below these lows. And later on, smart money take advantage of all that pseudo liquidity and cause price to reverse and head back up. Okay? So, in this instance, that was not what happened, right? But I
[33:41] wanted to like show you an example. And now you might be wondering, what Okay? What happened right here that caused price to actually move up? Because there was no liquidity sweep happening over here. Price just gap all
[33:53] the way down because it was a Sunday, right? Because the market were closed on the weekends. And then when the market opened, prices went up straight away. happen without a liquidity sweep? No. It needs a liquidity sweep. And that
[34:07] liquidity sweep then? Because it did not happen when price is pulling back. right here. When price goes up, pulls back, and then goes up, what happens? Higher low. Retail traders
[34:22] want to trade a continuation. They enter for a long position right here. They place their stop loss below those lows. Also, the people who want to trade the breakout, they are placing their sell stop orders below those lows as well.
[34:35] Guess what? Generating liquidity. Okay, so below those lows right here, there is obvious liquidity. And just as expected, price came down, swept all the liquidity right here before moving to the upside.
[34:50] Just imagine the anguish. Imagine the disappointment of the retail traders, position right here, happily thinking and hit their TP. So, they continue holding the trade over here, over the
[35:04] weekend even. Right? And then today when the market opens, boom, their stop loss got triggered and then price actually started going up. Just imagine how sad they feel right now because they don't understand liquidity.
[35:17] understand liquidity. I know I sound like a evil MF right now, You can either blame the player or like no, don't hit the player, right? Hit hit the game.
[35:30] Okay? So, like you can either like blame and you know, just learn the rules of the game and learn how to take advantage of it. is for me. It just allows me to like see the market
[35:44] operating like a retail trader and start to operating like someone who actually knows his Okay, so let me just give you guys like another example maybe in like a bearish scenario right here if I can even find
[35:59] one. Let's try to look at this one. Is this a good example? No, this is not a good example.
[36:12] Okay, there we go. This is a pretty good example. So, over here, price came down, pulls back and then goes down causing all bearish break of structure causing all bearish break of structure to the downside.
[36:26] now, right? ideally, when we look at this price action right here, we are continue bearish and we're going to be looking for shorts. know, your swing high, which is the highest point that led to the break of
[36:39] structure, and your swing low. And this is the range that we are trading within. whatever that we have learned so far, right? So, I'm not doing anything crazy right here. This is just me mapping out the structure, the swing highs, the
[36:52] want to focus on. And then the next step is you might use you realize that, okay, price is still quite down here in the discount pricing, premium pricing. Or you can even, you know, map out your
[37:07] supply zones, right? Because this is where you want to look for shorts. Okay, where you want to look for shorts. Okay, there's a supply zone right here. right here, as well. Okay, there's two supply zones over
[37:21] How do we know those are the supply zone? Because you can see price move to the downside, pulls back, moves to the downside again, consolidation caused price move to the downside. If you want it to be even more
[37:34] precise, obviously, you can map out this supply zone that we have right here, led to this imbalance to the move to the downside. zone. And once again, if you draw your premium and discount, you'll be wise
[37:47] enough to know that you shouldn't be looking for a sell at this supply zone right here, because it is still within the discount range. Okay, so let me just try to identify liquidity
[38:02] literally just learned right here. Remember, above a swing high and below a swing low, there's our liquidity. So, in a downtrend, when we are looking for sweep the buy-side liquidity,
[38:18] move to the downside. Okay, so that's all I'm caring right now. If I'm looking for a short position, I just want to see price sweep the liquidity above the swing highs. Which means if price comes down, sweep
[38:31] don't care because this could just be the fuel that price need to pull back. That's it. But if I'm looking for shorts, I need to see price sweep some form of liquidity above the swing highs. Same thing. If I'm looking for longs,
[38:45] for a buy position like somewhere around here, I want to see price sweep the liquidity below the swing lows. Then I will start looking for longs. Okay, once again, that's the fuel that I need in order for uh price to move to the TP
[38:59] Okay? So in this case, where's the available That should be the first question you ask yourself. Where is the available liquidity? Well, price came down, pulls back, goes down, pulls back, goes down,
[39:13] pulls back, and then goes down. Guess what? That is your resistance level highs being formed right here, which liquidity above those highs here. So once again, this is another mistake
[39:27] that retail traders tend to make. They see price comes up to this supply zone, and they immediately enter for a sell the minute price mitigate the supply somewhere around here. And then they place a stop loss above the supply zone.
[39:40] Once again, just contributing to the good old liquidity. sell right here, they're just fuel for me. That's it. we're not going to be entering for a sell right here.
[39:55] We acknowledge that okay, swing highs are formed right there. There is available liquidity being built up right there, and I'm not going to enter for a sell until those get swept. Okay, cool. Next, where is
[40:07] find more liquidity. Well, in this case, there's a price goes up, pulls back, goes up, pulls back, right? So in this case, there is liquidity sitting above those highs here as well.
[40:21] In fact, when price went up here and pushed back, goes up, pushed back creating your equal highs, there was additional those highs itself.
[40:34] Okay, equal highs, liquidity being built up right here. And then later on, price went up there, swept the liquidity above those highs and then pushed to the structure. Clear as day, this is institutional
[40:50] price action. Clear as day, this is intent from the smart money. Okay, like money. All you got to do is to open your eyes and look. All you got to do is to stop being blind, start waking the hell up, and
[41:04] So, we know that supply zone has been formed right here. But, is this ordinary supply zone? No. It's a supply zone that swept liquidity. So, this is a supply zone that swept liquidity, which is a liquidity zone.
[41:20] So, in terms of like probabilities-wise, which zone do you think has a higher probability? Right, like do you think price is going to respect this zone or this zone? Now, let's let's do a quick recap. Okay,
[41:33] so drop premium discount. Right here. Right here. Okay, so now we got zone one and zone So, in this case, zone one, what does zone one has? Zone one right here
[41:46] is within a premium range, okay? Within the premium range. swept liquidity, right? Price went up there, swept liquidity above those equal lows. Okay? And then it's also like uh let me just
[42:02] see, supply zone, right? Supply zone within premium pricing, swept liquidity. And also I before I forgot to mention, but let do break of structure right So, that's zone one. Now, let's take a look at zone two. What
[42:16] does zone two have? Zone two is a supply zone within discount pricing, right? So, that itself is not a confluence. And then, it also have available liquidity sitting
[42:29] above those highs itself. Further on, just adding to the fact that this zone is not reliable. And it is also Yeah, like I said, within the the discount pricing itself.
[42:42] Okay, so, just by implementing whatever that we have learned so far, we have that we have learned so far, we have learned that in terms of probabilities, zone one has a higher chance of working out compared to zone two.
[42:55] chance, once again, not certainly, right? There's a higher chance for price to respect zone one and hit back down compared to respecting zone two and hit back down. It's just math, okay? It's just math.
[43:08] Because zone one has much more confluences. Zone one has much more things like just backing it up. Okay, so, in this case, let's continue to observe what price does. Price went up there, mitigate zone
[43:20] here. And then started collapsing heavily. But happened? Okay? Once again, I want you guys to understand the logic of price. If you don't understand the logic of price, there's no use trying to memorize
[43:34] must understand why price move the way it does. So, in this case, let's get rid of this. Let's get rid of that happened over here was that price went up there, swept the
[43:46] liquidity above those highs here. And when it does, to, you know, make a tiny little pullback, all right? There was not tells us that there was not enough fuel. Because if this liquidity is enough,
[44:00] come up there, sweep the liquidity creating a sharp V-shape reaction, and out this low right here. But, that did not happen. liquidity right here, there was still not enough fuel. And if there's not
[44:14] more fuel. And where is it going to grab more fuel? This zone right here. So, it you can see, the minute it taps into this supply zone that swept liquidity, right now, at this point in time, we're expecting price to move down.
[44:31] zone. If there is not enough fuel at this where price is going to be grabbing the few fuel? Above these highs right here. Because, remember, we got liquidity sitting above
[44:46] Okay? So, yes, there is a lot amount of sell orders at this price point. But, if there's not enough fuel, not enough sell orders, then price is just liquidity, sweep the trigger all the stop losses,
[45:01] all the stop orders, and then go down. So, in this case, let's just observe. Okay, price goes up, sweep the liquidity because, once again, there's not enough fuel right here at this supply zone, and came up here, swept this high right
[45:15] here, and then started pushing to the downside. You can see, the minute price swept the liquidity above those highs, huge amount of imbalance that was formed right here.
[45:28] then, let's continue to see what price does. And before we move on, observe. Okay? Pay attention. Listen to In this case, price moved down aggressively. Huge amount of
[45:43] selling pressure, huge amount of selling momentum. This is also known as our displacement. This is also known as our imbalance. different pieces of the puzzle start coming together. The imbalance was
[45:56] formed by the liquidity sweep. The liquidity sweep was created by the Okay? So, if you zoom in a little bit right here at this price action over when this big bearish candlestick was formed,
[46:10] There was a gap, right? There was an imbalance. We can mark that gap by identifying the low of the previous candlestick and the high of the next candlestick, giving us our fair value gap.
[46:23] Fair value gap. Wow. And look at where price reacted from. Prices go up, okay? Comes down. Comes down a little bit, reacted from
[46:37] the fair value gap, and then started pushing to the downside. downside, what happened? Remember, the market needs to sweep some liquidity before it move, always.
[46:50] liquidity. It needs to get fuel. frame, observe what we have right here. Price came down, pulls back, and then comes down, giving us our lower high, giving us a swing high. And with a
[47:07] swing high just like this, we know that there is buy-side liquidity. And that is exactly what price did. Price went up there, swept the buy-side liquidity above these highs, also mitigating the fair value gap,
[47:22] right? Filling up the remaining amount of like sell orders within this price point, the imbalance, before it started moving down aggressively. Nothing that ever happens in the market
[47:35] Nothing happens by mere coincidence in the market. Every single move has a purpose. And when you understand market mechanics, you start to read each move, and you start to trade the market with clarity and confidence.
[47:50] This is how I am able to like just predict where the market move. This is how I can and with so much certainty like where price is moving towards next few hours. I'm not special. I'm not super smart.
[48:03] I'm not super intelligent. I don't have a PhD. I don't have a Harvard degree. I'm not some guy working on Wall Street. I'm just a guy who have learned how to read the market and we have learned the heartbeat of the market and just flow
[48:16] Right? That's the beauty of market mechanics. Okay, so in this case, price up the liquidity and has to push it on the downside. Okay? So, yeah, there we have it. Right?
[48:29] down and you can see once you start like really understanding these principles and this way of viewing the market, everything starts becoming really obvious. Right? Just like Neo in the Matrix.
[48:43] You've taken the red pill. Okay, once you see it, you can't unsee it. move down so aggressively right here? liquidity above those highs right there and you also medicate this supply zone.
[48:56] Wow, everything is starting to add up. And like I said, once you see it, you cannot unsee it. That's the blessing of market mechanics. Once you infuse it into your bloodstream,
[49:09] now you can see. I was blind, but now I see. I was awake. I was blind, but now I see. I was awake. I was sleeping, but now I'm awake. liquidity and inducements and all this stuff. What I'm doing over the next 30
[49:24] which you can view the market from because like I mentioned in the first few lessons that what got you here will not get you to where you want to go. You need to change the way you see the
[49:36] market because when you change the way you see the market, you start to change the reality. You start to change your the reality. You start to change your P&L. You start to change your results.
[49:50] market mechanics concepts, all of this stuff is essentially just like pieces of the puzzle. Like I said, every single episode of this mentorship series I'm puzzle. But,
[50:04] it's just a piece alone. A piece alone will not change your trading overnight. It will not make you magically profitable overnight. You need to piece the different puzzles together. You need to take the liquidity concepts, the
[50:17] zones, right? The Q zones, the fair value gaps, the order blocks, the systems, the processes, and put everything together into a trading plan for you to like just
[50:30] for you to like just become a monster on the charts. where orders are resting in the market. Price is often drawn to those areas
[50:43] because liquidity act as fuel. It act as lubrication, right? For price to actually move. An inducement is the bait the market creates to pull traders into early and build more liquidity.
[50:57] So, it's like if this is the liquidity sweep, then this is the available liquidity, then this is the bait, then this is the inducement. So, inducement build up available liquidity, sweep
[51:10] liquidity, the market move. Okay, that's the pattern. That's the pattern that I want you to remember. Smart money layout inducement, build up available liquidity above the or below the inducements,
[51:23] and then price the long sweep the liquidity and then move. Okay? This is just the motion of the market. itself. And when you understand the difference
[51:36] between the baits and the target, the market starts making a whole lot more sense. At the end of the day, you must understand that trading is simply a pattern recognition game.
[51:48] The more charts you study, the more you start to recognize where liquidity is sitting. Where inducement is being created. And where price is most likely trying to move next.
[52:05] liquidity. Okay, keep on practicing. Keep on analyzing. Keep on reviewing. Keep on putting in the reps. The more liquidity you spot, the better you get at spotting liquidity. The
[52:20] easier it is for you to spot liquidity in real market conditions. wrong move of the market itself. for you. Right? Because it was sure as hell super duper eye-opening for me when
[52:33] inducements. I really believe that like this right trade forever. Okay, this was like the missing piece of not figure out why I keep on getting stopped out.
[52:48] Right? Why I keep on blowing account? Why I keep on, you know, losing money no matter how hard I try. It's all because I was just viewing the market from the wrong lens. I was trying to see the market
[53:01] using my own perception, my limited belief about the market, the programming. Right? And as a result, I just couldn't see price. I was blind.
[53:15] But once I started learning about liquidity, mastering liquidity, I see the market. I see it for what it is. I see it for the beautiful masterpiece So, yeah. I hope this was really like awakening for you. Right? Because this
[53:29] was really awakening for me. And I really wanted to like take more time just to pass down this knowledge right here because this is so important. talk about more important stuff. And we're going to talk about how to piece
[53:41] everything together. For now, keep grinding, keep showing up, and you win in the end. And as always, remember you're just one And as always, remember you're just one trade away.

⚡ Saved you 0h 53m reading this? Transcribe any YouTube video for free — no signup needed.