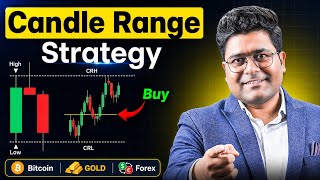
Candle Range: The 4-Hour Fakeout Pattern
48sEducational breakdown of a key trading pattern that many traders look for.
▶ Play Clip"Delivers the promised adaptation of the candle range strategy to crypto and forex, but the heavy sponsor segment at the start dilutes the density."
This video explains how to adapt the candle range strategy, originally designed for the Indian stock market, to trade crypto, gold, and forex. The strategy uses a 4-hour and 15-minute multiple timeframe analysis to identify high-probability scalping setups with defined targets and stop losses.
The candle range strategy gained popularity in a previous video and viewers requested an adaptation for crypto, gold, and forex markets.
The original strategy used the first candle of the Indian stock market; this video shows how to apply it to crypto tokens on exchanges like Delta Exchange.
Delta Exchange offers gold and silver tokens with lower fees (0.01% for futures) and is FIU-registered in India, making it legal for trading.
The strategy uses two main timeframes: 4-hour for setup identification and 15-minute for entry timing. A 5-minute or 1-minute chart can also be used for scalping.
When a 4-hour candle closes above the previous high or below the previous low after a fakeout (wick), it often retraces back to the range, creating a trading opportunity.
On the 15-minute chart, wait for a break of the nearest high above the lowest low (or nearest low below the highest high) of the recent 15-minute moves. Enter on close of the breakout candle.
Target 1 is the high/low of the 4-hour candle; target 2 is the previous swing high/low. Stop loss is set at the low of the 4-hour candle (for longs) or high (for shorts).
Book 60% of the position at target 1, move stop loss to entry, and hold the remaining 40% for target 2. There are only two targets; this is a scalping strategy, not a trend-following strategy.
To test a strategy's effectiveness, traders must execute at least 30 trades under the same rules. Most failures stem from not sticking to a strategy long enough.
In a live example, 6 out of 9 setups were successful (66% win rate), with a risk-reward ratio of at least 1:1, making the strategy profitable.
The candle range strategy can be effectively applied to crypto and forex markets with the right timeframes and discipline. Success depends on consistent execution over at least 30 trades and strict adherence to the defined rules.
What are the two main timeframes used in the candle range strategy?
4-hour and 15-minute charts.
03:07
What is the first target (Target 1) in this strategy?
The high (for long) or low (for short) of the 4-hour candle that triggered the setup.
11:23
What percentage of the position should be booked at Target 1?
60%.
12:06
How many trades should a trader make to properly test a strategy according to the video?
At least 30 trades.
13:53
Where is the stop loss placed for a long trade?
At the low of the 4-hour candle that formed the setup.
10:41
What condition must a 4-hour candle satisfy for a valid setup?
It closes above the previous high (for long) or below the previous low (for short) with a wick showing a fakeout (i.e., it initially moved beyond but closed back within the range).
04:04
What is the second target (Target 2) in this strategy?
The previous swing high (for long) or swing low (for short).
11:23
Which exchange does the presenter recommend for trading gold and silver tokens?
Delta Exchange.
02:21
What win rate was observed in the live example shown (number of successful setups out of total)?
6 out of 9 setups (approximately 66.7%).
17:01
What does MTF stand for?
Multiple Time Frame.
03:21
Fakeout and Retracement Principle
Explains the core logic behind the strategy: candles that fakeout often retrace, providing a high-probability entry.
04:04Simplicity vs Discipline
Emphasizes that trading is easy but discipline is hard; a key insight for trader psychology.
10:4130-Trade Rule
Provides a practical benchmark for testing any strategy, addressing a common reason for trader failure.
13:53Live Win Rate Analysis
Demonstrates the strategy's real-time performance with a 66% win rate, adding credibility.
17:01Paper Trading Encouragement
Encourages traders to practice with paper trading before using real money, promoting responsible trading.
19:31[00:01] Today we will talk about whether the candle range strategy works in crypto or not because I released a video just last week. You can see this candle range strategy and it has got 32,000 views. Now that I am shooting the video,
[00:16] within just two days, I have received so many comments. A lot of people are using it. After that, when I updated the live market for the next day, the daily market update, comments came in it also. Within the first hour, this strategy seemed
[00:29] great. But one comment and one question were being asked again and again. How to do this in crypto sir? I don't understand how to trade crypto, gold, crude oil. Because in this we
[00:43] used the first candle of the Indian stock market. So how to use it in the crypto market? So in today's video I am going to tell you how you are going to use the candle range strategy in the crypto market ? So quickly
[00:56] read the disclaimer and I will explain to you guys on the charts how to use it. remind you that on Delta Exchange you can use both futures and options in crypto.
[01:11] Both can trade. And look at this, options fees are now zero on OTM expiry. If you are using the Scalper offer in futures, there is zero exit fee and there is zero entry fee in spot. Also, let me
[01:26] remind you again that this is FIU registered. You get to trade the highest futures and options volume in India only in Delta. You can read many things by visiting its website. And the question is is Delta
[01:39] Exchange legal in India. So you see, we are registered with the Financial Intelligence Unit of India, 100% compliant with Indian regulations, so it is completely legal. You can trade futures and options without any worries on Delta Exchange.
[01:52] If you want to get a discount on your broker fees i.e. broking fees or trading fees while trading futures and options, then I have put the link in the description. You will also get 10% fee off on opening an account through that link.
[02:06] So let us now can see I have opened the chart of Gold Token of Delta Exchange India on Trading View.
[02:21] By gold token I mean XU US DT. Now why was I telling you guys about data exchange right now in the beginning ? That is why I was telling
[02:33] my friends who want to trade gold and silver in Forex, instead of on crypto tokens on Delta Exchange India and the fees have also become only 0.01%.
[02:52] You can trade both Gold and Silver tokens on Delta Pay at 80% less than the trading fees of other futures. how will I do it with the candle range strategy? What do you have to do for that? There are some time frames to keep in mind. How? What time frames do you have to keep in mind that we're okay here?
[03:07] Two time frames will be used minimum. How many? Two. The first time frame we will use is 4 hours. The second time frame we will use is 15 minutes. Now if you guys
[03:21] remember the video on Candle Range Strategy, then while showing you the video I had also explained that this is a strategy of MTF i.e. Multiple Time Frame Analysis. So, similarly, when trading crypto tokens using the candle range strategy,
[03:36] it will also be traded on multiple time frames. After this, if you want to use the third time frame, you can use 5 minutes or 1 minute. But the purpose here is to But the purpose here is to explain scalping to you. I have already taught you the MTF swing strategy using weekly, daily and 1
[03:52] hour charts. concept. But will do it in 4 hours. And what does the concept of the 4-hour candle
[04:04] say? Now I will explain that to you a little bit. So basically, it often happens that whenever a 4-hour candlestick goes above the candlestick goes above the high or low of the previous candlestick, then the
[04:19] high or low of the previous candlestick, then the next four candlesticks of the same four-hour candlestick go above the high or low of the previous candlestick and fake out and close in this way or close in this way.
[04:34] Meaning, she went up, got it faked out and closed down. Went down, got a fake out and closed up. Whenever such a setup is created, whenever such a setup is created, there are probabilities. Pay attention, there are chances, there is opportunity, there is hope. Do you understand? So
[04:52] are chances, there is opportunity, there is hope. Do you understand? So chances are that it will fall back to chances are that it will fall back to take the low or high of this 4 hour candle. So, just like we did in MTF, we are going to do the same thing with the weekly time frame on the 4-hour
[05:06] chart. So first I will show you an example in which I can explain this strategy to you and after that we will track the data for a few days. If this happens, then how often does it happen? clear? Let go. So first let us
[05:19] understand this strategy a little. So what do I have to do now? Here I opened this gold chart. Pay attention to the gold tokens. I am using a 4 hour chart. Ok? Now I have applied a 4 hour chart. Now if we
[05:34] look at this, since it is the weekend, the chart gets a little spoiled on the weekend. Try that if you are better setups. Although Bitcoin works even on weekends,
[05:50] Gold and Silver tokens do less. Let me also tell you the reason here because trading in the forex pairs of gold and silver or in the international markets stops. Because of this, Gold Silver tokens are traded less here. But from 24th
[06:04] tokens are traded less here. But from 24th July onwards, CME is going to trade Gold Tokens 24 hours a day, seven days a week and right now when I am shooting the video, 24th July has not yet arrived, so after that it will run on weekends as well, then you will be able to use it in a good way, it is possible that
[06:18] when you are watching this video, 24th July is about to come or has already come, okay, so let me take an example from here, let us
[06:30] first I am taking an example, this seems to be a little bit of a reversal setup, so I think it would have gone well. So look here, focus on this. This is a 4 hour chart. Let's suppose you were watching this. So what you see
[06:45] here is that look at a 4 hour candlestick, look at it from above, this is what has formed. After this it was made below. After this it was made below. The special thing about this candlestick is that this candlestick has special thing about this candlestick is that this candlestick has
[07:01] you trying it out? The candlestick went below it and candlestick went below it and formed a wick but where did the closing happen above? Whenever this happens, there is no guarantee that the market will not go up now,
[07:14] that the market will not go up now, but there are chances that the market will at least give a good reaction from here and will at least go till here and it may even go till the previous high which is the previous swing high, so within this our target one will be
[07:30] this and target two will be this. You should remember this. I will explain it now, it will be useful later. What is Target One? This is the 4 hour candlestick. Now this is the range in a 4 hour candlestick. What will you trade in this sir? Yes, scalping happens like this.
[07:46] sir? Yes, scalping happens like this. Scalping Quick Trading Trading within a session is like trading on 1 minute, 5 minutes, 15 minutes. Ok? So this should be your first target and this should be your second expectation. Now here you have to take care of some more things.
[08:01] Now here you have to take care of some more things. If you have done top to down If you have done top to down analysis and according to that your order flow says that the market will fall till here then please do not go long
[08:14] because as I told you, no strategy works every time. No one has a 100% win rate. So there will be stop losses in this also. So if your bias trend is anything like this then do not take trades against the trend. But if you do not have any bias, are not able to understand
[08:29] , are a beginner, want to practice , then this strategy is giving you the perfect hope that you should become bullish here. And what should I do now, sir? Just being bullish and doing nothing. Whatever time frame you like, short 15 minutes, 5 minutes, whatever you like. Like
[08:43] I like 15 minutes, I always say so I pay 15 minutes. Ok? so I pay 15 minutes. Ok? So move to the 15 minute chart. Where should you go So move to the 15 minute chart. Where should you go ? Move to the 15-minute chart. And
[08:55] ? Move to the 15-minute chart. And now just wait and see if the market breaks any high. Someone please break the high speed. So where is the high, my head? Look at this, pay head? Look at this, pay attention to the last low you made
[09:08] here. Well, now many people have received BAMS SMS. I have a playlist on my channel called Advance Price Action Series. If you guys have seen that then it is great. If you haven't seen it, go and see it. Trading in your leisure time will be
[09:22] great. Well, if you get BAMS, SMS, high probability SMS, any trading technique from that, you are getting that setup , trade it. Can't find that setup. So what is the simplest?
[09:37] So what is the simplest? What is the lowest low? Which is our lowest low, the high made just before it. The high formed just before this, which is above this line. Where from? Look at this one. If this seems too small,
[09:52] One of the two must be visible to your eyes. As soon as that high is broken, you should immediately As soon as that high is broken, you should immediately enter the trade. Is it clear? If enter the trade. Now two things can happen. The first thing is that sir the market has already
[10:09] broken this high. Like look here it has broken. The second case could be that the brakes may not have been applied. If you have done it then enter directly here. If you have n't done it then wait. After you do it, enter it. Ok? After this,
[10:25] After you do it, enter it. Ok? After this, you will simply enter here. This is your target one, this is your target two. The stop loss will be this one low. It's just such a simple
[10:41] strategy. Trading is that easy. What's the problem? Trade only one strategy every day. It is difficult to follow all these three rules with discipline. Trading is not difficult. Ok? So what have we done now
[10:55] ? Sir, you said that as soon as we do a high break, we have to see whether the high break has been done ? Look, this was my high and this one has broken. The break is over. It is just simple, as soon as the trading candlestick closes,
[11:09] wherever the price is, we plan our long position here in the next candlestick. plan our long position here in the next candlestick. placed my stop loss here and where is the target high of the first 4 hours? this one's.
[11:23] where is the target high of the first 4 hours? this one's. Now try to ensure that the risk to reward from here to here is at least 1:1. If it is 1.5 then it is at least 1:1. If it is 1.5 then it is better. But 1.1 must be one 1 1.
[11:36] How much is there here? It's coming around two. perfect. So the first target we can do here. This was our first target and high one. What will Simple do at the first target?
[11:52] We will book 60% position at the first target. How much? 60% will book 60% position here. You will place your stop loss at the entry and leave your target here at 40% which is your final target. There
[12:06] are only two targets. There is no other target. There is no third target in this strategy. There is no other target. There is no third target in this strategy. There clear? This is a hit and trial strategy. This is not a trend-catching strategy. There
[12:21] This is not a trend-catching strategy. There is a reversal strategy. The work is done. We did this work. So you just have to wait. and both your targets have been completed. It's that simple. Try scalping with this.
[12:37] Make 30 trades in 30 days. Today I am telling you about this much information. This is a telling you about this much information. This is a comes to me personally and asks me, when we meet, users ask me, when I teach in mentorship, then
[12:53] people ask me, Sir, how to bring discipline? How to bring discipline? So I tell them one thing that you know that almost 90% of the traders fail. This
[13:05] is correct. Ok? Now, 90% of the people fail, Ok? Now, 90% of the people fail, how many people are there in 95% of them? Do you know why 95% of its people fail
[13:19] how many people are there in 95% of them? Do you know why 95% of its people fail ? He never makes even 30 trades in his life. I don't think.
[13:38] if you are not profitable, then tell me honestly with certainty that have you ever tell me honestly with certainty that have you ever in your life done one strategy, any strategy in which you believe, which you have followed for 30 days continuously,
[13:53] if you do one trade in a day, sometimes you have done 30 trades, sometimes you have not done before 30 trades, then accounts get blown in five trades, if you do not do five trades, there is stop loss in four out of five trades. The strategy is bad. B
[14:08] is bad. B You repeated 30 trades on the same setup for 30 days using one strategy. Whether it takes 60 days or 90 days. I am sure you cannot fail in trading. Unless you spoil your position size one day.
[14:23] You cannot fail. This is the biggest reason for failure. We don't even try 30 trades. Try it with this and let me know. Ok? And if you feel that this is absolutely true then comment honestly whether I have done
[14:39] 30 states with a strategy or not and after doing it sir, if I am still in loss then tell me honestly by commenting, then brother, get the havan puja done, get the Mahamrityunjay mantra chanted and go and do Rudra Abhishek somewhere, that is the only solution for Lord Shiva, if there is no other, then
[14:55] show your horoscope, I am telling you literally, otherwise you have not done 30 states, I am saying this by writing it, please comment and I will look into this matter honestly. Come on, how many comments do you leave behind? Ok? So, here's your
[15:08] strategy. Now let me show you a little bit about when you will see this strategy not working. Where to pay attention. Let me tell you some things. Look, first of all understand whether this strategy works or not. Because this will happen to many people.
[15:21] This doesn't happen. If the candle reaches a high and a low in 4 hours, it does not turn back. Let's start looking. The
[15:33] Our setup will not be made in this. So leave it, this is of no use to us. Here it is, So leave it, this is of no use to us. Here it is, Liya went up. Didn't you go? So it was not made here. That's ok. Here you go. Went upstairs. Didn't it work ? Did not go. Twice
[15:47] is fine. Didn't make it twice. The third time we took the low, it went above it once and became 21, okay, after this it went high, it went below it, it became 222, it was
[16:00] formed twice, it was not formed twice, so let's do this, let's keep writing it down a little so that we can do it later, these are the no ones and these are the yes ones, so this these are the no ones and these are the yes ones, so this became two and this also became two, okay,
[16:13] after that it closed below the no, it was formed, just now we saw another yes, after that it went up, see this went down, after this yes, it did not go down, it did not close above, look, it went high and closed below, it went down, yes, it
[16:31] closed below, it did not go above and this is our down, up, down, up, what is it doing brother, what is it doing brother, do something somewhere, look, it closed above but after that it went below, okay, it did not go below, look, it closed below,
[16:47] after that it closed above, yes, now now you will say it has gone long but it has gone above in the next candlestick. Ok? I am showing you my logic. Is the setup there or show you one more important thing. The weekend has just arrived. So how many did we see? 1 2 3
[17:01] arrived. So how many did we see? 1 2 3 4 5 6 7 8 9 Not made three times out of nine. It became six times. Do the math. What win rate is coming. Will your work get done or not? And I have already shown you the rise to reward.
[17:17] When a good target is coming out after taking out both, then now see, I don't know whether the because any strategy can be good for someone and bad for someone. Now let me show you where setups are not made. Ok? Now let's start from here.
[17:33] Now let's start from here. Look, this was our stop loss. What work did we do here? Here I have marked it. Looked at the next candlestick. Sir, look, it is ready. The setup is done. We will plan for the long term.
[17:46] Come to the 15 minute chart. Switched to the 15-minute chart. You have come sir. Where is our lowest low? Pay attention brother, everyone please pay a little attention. Where is our lowest low? this one's. Which is the high above it ? This one is the first one. Now some people
[18:02] will say Sir, this was it. But that's what it is. You do n't watch it with full concentration, do you? If you had looked carefully, you would have known. I had said that the high which is above this low. This one wo n't work. This one will do. Ok? clear? Now look, now we felt that stop
[18:17] loss has been done. Did the market break out? No. There was an entry in the trade. No. So those three which I showed you were not made. Firstly, entry was not made from it. Remove that too. Now tell me, two out of eight did
[18:35] not make it. The target is six. I will take out more and find out and it is not made in one. It will be known in this way only in the target. Entry not found. The target was achieved. That will also happen. But I am trying to explain one thing to you that there is so much difference between reality and this.
[18:49] that there is so much difference between reality and this. Now the fun of knowing where it was achieved and where it was not, is when you guys practice and tell me, go and take homework, take the gold chart and silver chart of the last 101 days, do go and take homework, take the gold chart and silver chart of the last 101 days, do
[19:04] not legal in India. Ok? So you go and create an account on Coin Delta Exchange and see the 30 days, see how many setups are made, try paper trading see how many setups are made, try paper trading and do 30 trades honestly, counting
[19:19] and do 30 trades honestly, counting 30 times each, tell me whether you got the result or not, then you try the candle range strategy on a
[19:31] do tell me by commenting, that's all for today's video, I hope you all enjoyed this strategy. You guys will practice the paper on this and will definitely give me feedback and tell all your friends who are struggling.
[19:44] Now yesterday a comment came on the video of Candle Range Strategy that Sir, this is such a great strategy. I have been trading for three weeks now since the video I made yesterday taught me the first thing and I am getting results. But I will
[19:57] tell my friends when I make money. I know, I know it is normal but knowledge increases by sharing. If I also start thinking that why should I tell this to you people, I am telling it on YouTube only.
[20:10] Then how will things work out or not? So share it with your friends. what details you are getting to see on the Hold V Priyank YouTube channel. Well, I hope I was able to help you guys today and this video will give you a little something extra in your trading life.
[20:24] video will give you a little something extra in your trading life. in the next video. Till then take care of yourself, take care of your family, take care.
⚡ Saved you 0h 20m reading this? Transcribe any YouTube video for free — no signup needed.