

Why Most Day Traders Fail
45sHigh relatability as struggling traders want to know the common mistake of overcomplicating charts, promising a simple solution.
▶ Play Clip"The video delivers a clear, structured day trading plan based on SMC, though it's not the 'only' plan needed; it's a solid framework."
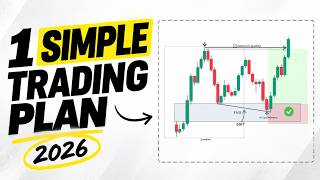
This video presents a comprehensive day trading strategy based on Smart Money Concepts (SMC), focusing on supply and demand zones, fair value gaps, order blocks, and top-down analysis. It aims to simplify trading by combining these core concepts into a clear, actionable plan for intraday traders.
Day trading means opening and closing positions within the same trading day without holding overnight.
Supply and demand zones are areas where large numbers of traders enter, causing aggressive price moves. Strong zones are identified by inefficiency, break of structure, and pushed distance.
A fair value gap occurs when price moves too fast, leaving an imbalance. Price often returns to fill this gap.
A break of structure occurs when price breaks the recent market structure level, indicating trend continuation.
When price breaks below a strong demand zone, it signals a potential reversal. However, CHoCH can be invalidated by liquidity sweeps or unmitigated fair value gaps.
A break below a swing low within a liquidity area is often a liquidity sweep to target stop losses, not a true reversal.
Unmitigated fair value gaps act as magnets; price often retraces to fill them before continuing the trend.
When price mitigates a demand zone, demand takes control; when it mitigates a supply zone, supply takes control.
Order blocks are refined supply/demand zones where significant buying or selling originated, identified as the first candle creating a fair value gap.
Analyze higher time frames (daily/weekly) for trend and key levels, then zoom into lower time frames (4H, 1H) for precise entries.
On USD/JPY, daily and 4H charts were bearish. On 1H, price broke below a bullish order block, confirming supply control. Entry was at a new bearish order block with stop loss above.
Patience is crucial; waiting for high-quality setups is more important than overtrading.
The video emphasizes that successful day trading relies on mastering a few core Smart Money Concepts—supply/demand, fair value gaps, order blocks, and top-down analysis—and applying them with patience and discipline. The key is to trade in the direction of the higher time frame trend and wait for confirmations on lower time frames.
What is day trading?
Opening and closing positions within the same trading day without holding overnight.
00:37
What three factors identify a strong supply or demand zone?
Inefficiency, break of structure, and pushed distance.
01:43
What is a fair value gap?
An imbalance caused by price moving too fast, leaving a gap between candles.
02:14
What does a break of structure indicate?
That the current trend is likely to continue.
02:28
What is a change of character (CHoCH)?
When price breaks below a strong demand zone, signaling a potential reversal.
03:35
What two scenarios can invalidate a change of character?
Liquidity sweeps and unmitigated fair value gaps.
04:16
What is a liquidity sweep?
A break below a swing low to target stop losses before price continues in the original direction.
05:11
What is an order block?
The first candle that creates a fair value gap, representing where significant buying or selling originated.
10:43
What is top-down analysis?
Analyzing higher time frames for trend and key levels, then zooming into lower time frames for precise entries.
11:37
What is the recommended risk-to-reward ratio for partial profits?
1:2.
15:59
Three Factors for Strong Zones
Provides a clear, actionable framework for identifying high-probability supply/demand zones.
01:43Liquidity Sweep vs. Reversal
Helps traders avoid false reversal signals by recognizing when a break is a liquidity grab.
05:11Fair Value Gap as Magnet
Explains why price often retraces to fill gaps before continuing, a key concept for entry timing.
06:06System Operation: Mitigation Controls
Simplifies market dynamics into a binary rule: mitigation of a zone shifts control.
08:52Patience Over Overtrading
Emphasizes discipline as a critical skill for consistent profitability.
16:13[00:01] setup because they try to apply too many trading concepts on the chart. In this video, we'll simplify the concepts and show you a powerful day trading strategy that combines the most important concepts into one clear
[00:15] So, if you have the same issue in your trading, make sure to hit the like button to show your support and watch this video until the end.
[00:37] means we open and close our positions within the same trading day without holding them overnight. To use this strategy effectively, you first need to understand the core principles of smart money concepts.
[00:50] These principles form the foundation of the trading system, and your success depends on applying them correctly on the chart. Before we break down the strategy, let's quickly recap these concepts.
[01:03] Let's start with supply and demand. Supply and demand zones are areas on the chart where large numbers of traders enter the market, causing the price to move away aggressively from that level. These zones often indicate areas where
[01:18] buying or selling interest remains, providing valuable trading opportunities. Normally, we mark the starting point of a strong price move as a supply or demand zone.
[01:30] When the price returns to that area, we expect it to react because for whatever reason, traders were very active there in the past. However, not every supply or demand zone is worth trading.
[01:43] To identify strong zones, we look for three important factors: inefficiency, break of structure, and the distance price moved away from the These factors help us measure the strength of the zone and increase the
[01:58] probability of a successful trade. Inefficiency occurs when the price moves away from an area very quickly, leaving an imbalance between buyers and sellers. This imbalance often appears as a fair value gap between candles.
[02:14] A fair value gap suggests that the price moved too fast and did not spend enough time trading at certain levels. Because of this, price may return to those levels in the future, making the demand that caused this gap an important
[02:28] area to watch. A break of structure occurs when price breaks the recent market structure level to the upside in a bullish scenario. This shows that buyers are still in control and the current trend is likely
[02:41] to continue. The pushed distance refers to how far the price moves away from a zone before returning to it. The further the price moves away, the stronger the rejection is considered to
[02:53] be, which can make the zone more reliable. By combining inefficiency, break of structure, and pushed distance, you can identify stronger supply and demand zones and focus on higher probability
[03:06] trading opportunities. In this example, the latest impulsive movement meets all the criteria for a high-quality demand zone. It has created a fair value gap, broken through the previous market structure,
[03:21] significant distance compared to previous moves. Once the price retraces back to this demand zone, there is a higher probability that it will reject the area and continue moving upward.
[03:35] But what happens if price breaks and closes below this high-quality demand zone? This brings us to the next smart money concept, the change of character. In the previous example, breaking below
[03:48] the demand zone would indicate that buyers have failed to hold the level and sellers have taken control. This signals that the uptrend is over and a potential reversal is underway. When price breaks through a strong level
[04:02] like this, it suggests that the market structure has shifted and momentum is now favoring the sellers. This condition is known as a change of sentiment. However, the change of character is
[04:16] valid except in two common scenarios. In certain market conditions, they can become invalid. This usually happens during imperfect trending conditions where price forms a change of character but continues moving
[04:29] in the same direction. This often confuses traders who believe the trend has ended and that a reversal should follow. Let's break this down step-by-step. In this example, we have a swing low
[04:42] that led to this breakout. A break below this level may appear to be a valid change of character. However, if you look to the left side of important. This level aligns with a significant
[04:56] liquidity area. Many traders previously entered long positions at this level and placed their stop losses just below it. As a result, a large pool of liquidity has formed beneath that swing low.
[05:11] This liquidity becomes an attractive target for smart money. To target these stop losses, they often push prices lower, sweeping the liquidity before driving it back up in the same bullish direction.
[05:24] The key takeaway is that when a major swing low sits within a liquidity area, a break below that level is often just a liquidity sweep rather than a true market reversal. In this situation, we cannot classify
[05:38] character. If price re-enters the range after sweeping the liquidity, it can provide an excellent long opportunity. The reason is simple. The overall trend is bullish.
[05:53] The sell-side liquidity has been taken out, and the next objective becomes the buy-side liquidity. As smart money traders, our goal is to enter after the stop losses have been swept when the real move is likely to
[06:06] Now, that's only one piece of the puzzle. Let's discuss another concept that can invalidate a change of character. Mitigation of fair value gaps. Identifying fair value gaps should be
[06:20] one of the first steps in your chart analysis because these areas often act like magnets for price. In many cases, before continuing its trend, the market retraces to fill these gaps.
[06:33] This is why fair value gaps are important zones to monitor. They tend to be most effective on intraday time frames, such as the intraday time frames, such as the 4-hour, 1-hour, and lower time frames.
[06:45] Now, here's where it gets interesting. Let's go back to the previous example. If you look closely at the left side of the chart, you'll notice an unmitigated fair value gap sitting just below the major swing low.
[06:59] In situations like this, price will often retrace into the fair value gap to fill the imbalance before continuing in its original direction. This pullback does not necessarily indicate a true reversal.
[07:12] Instead, it is simply the market rebalancing itself. The key takeaway is to always check the left side of the chart for unfilled fair value gaps. Doing so will help you distinguish
[07:25] between a move that is simply filling an imbalance and one that reflects a genuine shift in market sentiment. By understanding this difference, you can avoid false signals and stay aligned with the overall market structure.
[07:40] let's move on to the next topic. But before we continue, if you're looking for a trusted prop firm with fast and reliable payouts, then you need to check out Funded Next. Funded Next is one of the pioneer prop
[07:54] firms that offers both futures accounts and CFDs all in one place, which gives traders a lot more flexibility. They provide a wide range of challenge accounts starting from $5,000 all the way up to $200,000.
[08:08] meaning you can start trading without going through a challenge phase. And for the Smart Risk community, you can get an exclusive 7% discount plus a 120% through our link. So, if that's something you're interested in, check
[08:24] out the link in the description. Market direction. Who is in control? Identifying market direction is the first step in analyzing any price chart. The goal is to determine the trend and
[08:39] identify whether buyers or sellers are in control of the market. Trading in the direction of the dominant side increases the probability of success and helps you stay aligned with the overall market momentum.
[08:52] How does the system work? The system operates based on mitigations. When price mitigates a demand zone, demand takes control over supply. Conversely, when price mitigates a
[09:05] supply zone, supply takes control over demand. I know this sounds very simple, but it will all make sense in a moment. Imagine the market is in an uptrend, forming a series of higher highs and
[09:19] higher lows. Every time price breaks structure to the upside and creates an inefficiency, a new strong demand zone is formed. These demand zones remain unmitigated until price revisits them, providing
[09:34] ideal opportunities to trade in the direction of the dominant trend. However, if price breaks below a valid demand zone, it creates a change of character. This signals two important things.
[09:48] First, supply has taken control over demand. Second, a new valid supply zone has been established. From there, price continues moving lower, creating new supply zones until
[10:01] zone. At this point, a battle between supply and demand takes place. Sometimes this leads to consolidation, causing price to range between the supply and demand zones.
[10:16] A break above or below that range will determine which side gains control of Then we will look for trades aligned with the dominant market direction. The next concept we'll explore is order blocks.
[10:31] Order blocks are refined supply and demand zones where significant buying or selling pressure originated. These areas are important because they represent locations where large market participants likely entered their
[10:43] positions and caused price to move aggressively in a particular direction. We identify the first candle that creates a fair value gap as the order This is because the decision behind the strong move likely originated within
[10:58] that area. When price eventually returns to the zone, there is a higher probability that it will react. However, the strength of that reaction depends on whether unfilled orders still
[11:10] remain within the order block. It's important to note that order blocks do not always work. They are not guarantees, but rather potential trading behavior. Like any trading tool, order blocks
[11:25] should be used alongside other concepts and confirmations to increase their probability of success. Finally, let's discuss top-down analysis. This technique involves combining
[11:37] multiple time frames to gain a complete understanding of market conditions. By analyzing the bigger picture on higher time frames and then zooming into lower time frames for more detail, traders can identify higher probability
[11:51] trading opportunities. The process begins on the higher time frames, such as the weekly or daily chart, where we identify the overall chart, where we identify the overall trend, key levels, and market sentiment.
[12:04] This broader perspective helps us understand where the market is most likely headed. Once the bigger picture is clear, we move down to lower time frames, such as the 4-hour or 1-hour chart, to identify
[12:17] precise entry and exit opportunities using the concepts we've covered in this The most important thing to remember is that we do not want to overcomplicate That's why we're only going to use the concepts discussed in this video.
[12:33] Now, let me show you how they come together on a real chart. Here, we have the dollar-yen on the daily time frame. thing we want to mark on the chart is
[12:45] the key supply and demand zones near the current price. At the top, here we have the most recent high, and at the bottom, here we have the most recent low. These levels are important because if we
[12:58] zoom into the lower time frames, we'll see that they have acted as turning points for short-term trends. Therefore, when price reaches these levels again, we can expect a possible reaction.
[13:11] We can also notice something else if we focus on the latest bearish impulsive move. It has created a bearish fair value gap, so we can mark the candle responsible for this imbalance as an order block.
[13:24] This bearish order block becomes a potential area to look for selling opportunities. At the moment, price is trading near this level. However, the daily time frame is not our
[13:36] entry time frame. So, we need to zoom into lower time frames, such as the 4-hour and 1-hour charts, to look for confirmation and a possible short setup. Overall, the higher time frame is bearish, and there is still room for
[13:51] price to move before reaching the next important demand zone. This is all we need from the higher time frame. Identify the overall market sentiment and mark the key levels. Now, let's move to the 4-hour chart.
[14:06] Once again, our goal is simply to identify the market direction and mark the important levels. The market is in a clean downtrend, respecting lower highs and breaking lower lows one after another.
[14:20] mark on the chart. The analysis remains the same as on the daily time frame. Market sentiment is bearish, and we want to look for selling opportunities that align with the dominant trend.
[14:34] However, we still don't have a strong reason to enter directly from the daily order block. So, let's move down to the 1-hour chart and look for a better entry. On the 1-hour chart, things become more
[14:47] Unlike the higher time frames, the short-term direction is bullish. The latest impulsive move has created an imbalance, showing strong demand. We can mark the candle responsible for this imbalance as our order block zone.
[15:03] To refine the area further, we can also include the wick of the next candle. When price reaches this 1-hour order block, we expect a battle between supply and demand. If price breaks and closes below the
[15:17] order block, it suggests that supply has taken control. If demand remains in control, price may continue higher and even break above the daily order block. Let's see what happens next.
[15:30] Price breaks below the 1-hour order block, showing that supply has taken This is a strong indication that the short-term bullish move is over and that price may continue lower in line with the higher time frame trend.
[15:45] So, where do we enter the trade? We wait for price to create a new bearish order block. We then place a sell limit at that order block and position our stop loss above it, giving price enough room to move
[15:59] naturally. You can take partial profits at a 1:2 risk-to-reward ratio and target the key levels ahead for larger profits. Now, here's an important point. Patience is one of the most valuable
[16:13] skills a trader can develop. Waiting for high-quality setups is not It is a discipline that must be mastered. Many traders, especially beginners, fall into the trap of overtrading because
[16:27] they feel the need to always be active in the market. However, successful trading is based on quality, not quantity. So, guys, I hope this video provided value to you.
[16:40] If it did, please go ahead and smash the like button to show your support. And if our channel. See you in the next episode.



⚡ Saved you 0h 16m reading this? Transcribe any YouTube video for free — no signup needed.