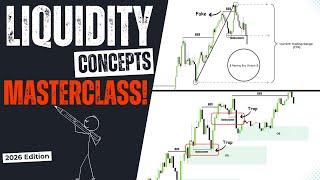

How to Spot a Fake Breakout
55sTraders often misidentify breakouts; this clip reveals a clear Fibonacci rule to avoid false moves.
▶ Play Clip"Delivers advanced liquidity concepts with clear examples, though the sponsor segment slightly dilutes the focus."
This video breaks down four advanced liquidity hacks for traders, explaining how to read liquidity correctly to avoid traps and trade with smart money. It covers trading ranges, internal vs external liquidity, dynamic liquidity, and liquidity sweeps.
Before analyzing liquidity, identify the trading range on a higher time frame (e.g., for 1-min entries, use 15-min). Valid ranges require a confirmed break of structure with a retracement into discount.
A valid BOS needs price to retrace into the 50% level triggering buy orders, then break below the most recent internal swing low (inducement) to confirm the range.
External liquidity sits above swing highs or below swing lows (retail stops). Internal liquidity exists inside the range (FVG, volume imbalances, internal swings). Price targets external liquidity via internal liquidity.
Internal liquidity includes fair value gaps, volume imbalances, liquidity above/below internal swing highs/lows, trend lines, and consolidations within the range.
Dynamic liquidity is the loop between internal and external liquidity. Price rotates from internal targets (FVG, inducement) to external targets (range highs/lows), using internal liquidity as fuel for the move.
If price respects a FVG midpoint and rejects upward, it targets upper external liquidity. If it disrespects (inverse FVG) and rejects downward after retracement, it targets lower external liquidity.
A sweep takes liquidity above a key level then reverses toward the opposite side. High-probability sweeps occur at external levels (range highs/lows) during session opens. Internal sweeps are low probability.
Mastering dynamic liquidity and understanding the interaction between internal and external liquidity allows traders to anticipate market moves and trade in alignment with smart money.
What is the first step before analyzing liquidity?
Identify the trading range on a higher time frame than your entry time frame.
01:02
What makes a break of structure valid?
Price must retrace into the 50% discount level of the impulse leg, then break below the most recent internal swing low (inducement).
02:12
Where is external liquidity typically found?
Above major swing highs and below major swing lows, where retail stop-losses rest.
04:06
Name two forms of internal liquidity.
Fair value gaps and volume imbalances.
05:01
What is dynamic liquidity?
The rotation flow of price between internal liquidity (FVG, inducement) and external liquidity (range highs/lows).
06:09
How does price behave when it respects a fair value gap midpoint?
It shows rejection to the upside, suggesting preparation to move higher toward upper external liquidity.
08:51
What is a liquidity sweep?
Price takes liquidity above or below a key level, then closes back inside that level's range and reverses toward opposite liquidity.
10:59
When do high-probability liquidity sweeps occur?
During high-volume time windows, typically right before or after a major session opens.
12:06
What happens when internal liquidity is absent in a range?
Price moves directly between buy-side and sell-side external liquidity pools until a new inefficiency forms.
10:00
Identify Trading Range on Higher Timeframe
Prevents chasing breakouts and sets the foundation for all liquidity analysis.
01:02External vs Internal Liquidity Distinction
Shifts focus from direction to which liquidity is targeted first, aligning with smart money.
04:06Dynamic Liquidity as the Market Engine
Explains the core rhythm of price movement, enabling traders to anticipate rotations.
06:09Using Fair Value Gaps to Predict Direction
Provides a clear, actionable method to determine whether price will go higher or lower.
08:51Focus on External Liquidity Sweeps
High-probability setups occur at session opens, filtering out low-quality internal sweeps.
10:59[00:02] episode of Smart Risk. Understanding liquidity and knowing how to read it correctly is one of the most important skills any trader must master to survive and stay profitable in the markets. If you can't read liquidity the right way,
[00:14] the market will constantly trap you, no matter how good your entries look. to break down four advanced and [music] essential liquidity hacks that will completely change the way you see price action. These are the exact concepts
[00:29] step ahead of the market instead of getting trapped by it. By the end of this video, you'll understand how liquidity actually works, how to read it in real time, and how to trade with smart money instead of against it. We
[00:43] always appreciate your support, so please give this video a thumbs up and subscribe to our channel if you are new. See you after intro.
[01:02] started. Hack number one, identify the trading range before you analyze anything. The first thing is simple. Before anything else, you need to identify your current trading range. So what do I mean by
[01:15] trading range? A trading range is not just a box or a consolidation. It's the area where price is currently operating and where liquidity is being built. In us the most information about future price direction once the price breaks
[01:30] either side of it. And as long as the price is inside this range, we need to carefully monitor the price action. So, how to identify your current trading The first step is to zoom out at least one or two time frames higher than your
[01:45] entry time frame. For example, if your entry time frame is 1 minute, define your range on the 15-minut time frame. If you trade from the 5-minut, look at the 15minut, 30 minute, or 1 hour time frame. If your entry time frame is 1
[01:59] hour, your trading range should come from the 4 hour or daily time frame. And this is critical. Never define your trading range from your entry time frame. To define a valid trading range, you
[02:12] must locate the last valid and confirmed break of structure impulse leg. For example, in this chart, this break of structure is valid because before the price pushed higher, it retraced into the discount area, tapping below the 50%
[02:26] buy orders. Now, we focus on the impulse expansion leg that caused this valid BOS. Once price later pushes below the most recent internal low at the premium area,
[02:39] which acts as an inducement, it confirms two things at the same time. that the bullish expansion leg is complete, that this swing high now marks the upper boundary of our trading range. And this is how a valid trading range is formed.
[02:54] this single impulse move from this swing low to this swing high as our trading range? Here's the reason. If you draw a Fibonacci tool from the swing low down to this swing high,
[03:07] you'll notice that price never retraced into the 50% level of this impulse. That means none of the discounted buy orders were triggered. Because of that, this move is not a valid BOS. This breakout is fake and this range is not a valid
[03:23] trading range. This retracement is nothing more than a temporary pause while price prepares to complete its real impulse leg. For a trading range to be valid, the price must break below the most recent internal swing low, the
[03:37] inducement, confirming that the bullish expansion is finished. Only then do we rely on. Once your trading range is properly defined, you stop chasing breakouts. You stop buying highs and selling lows. You
[03:52] stop guessing direction. Instead, you wait for confirmation such as liquidity sweeps, inducement, a shift in delivery. And this is where real high probability trading begins. Now that we've identified our trading range, the next
[04:06] hack is understanding where liquidity actually sits inside and outside that Once you understand external and internal liquidity, you stop asking is price bullish or bearish and instead you
[04:19] ask which liquidity is price targeting first. That question alone changes everything. Let's start with external liquidity. External liquidity exists typically find it above major swing highs or below major swing lows, exactly
[04:35] where retail stop- losses are resting. These are the areas smart money uses to manipulate the price. Your trading range high and trading range low are the most important external liquidity levels you need to
[04:47] pay attention to. Why? Because they are the closest external liquidity pools to the current price, and price is far more likely to target one of them first before doing anything else. Keep this in mind. Most market manipulation happens
[05:01] especially around major session highs and lows. You can think of external liquidity as one side of a magnet. But a magnet always needs two poles. The other side is internal liquidity. Internal liquidity exists inside the trading
[05:16] range. This is where most of the real action happens. This is where and positions are built before the real move begins. Internal liquidity usually appears in the form of fair value gaps,
[05:29] volume imbalances, liquidity resting above or below internal swing highs and above or below internal swing highs and lows, trend lines inside the range, consolidations that form within the trading range. In simple terms, internal
[05:42] located inside the current trading range. And here's the key point. Internal liquidity is not meant to be the final target. It's meant to be used. Smart money constantly uses internal
[05:55] liquidity to fuel moves toward external liquidity. And that's exactly why you need a solid understanding of it. The interaction between internal and external liquidity is what drives the market's main algorithm. So if you want
[06:09] to understand how the market really works behind the scenes, you must understand dynamic liquidity. And this brings us to the third and most important hack. But before we continue, if you want to get a funded account
[06:22] quickly, check out Funded Next's new Stellar Instant plan, which does not require a challenge phase. That's right. You get instant access to trading capital from day one. There is no daily draw down limit, no minimum trading
[06:35] days, and you can withdraw profits anytime. The best part, make just 10% and Funded Next doubles your account. They also offer plenty of other plans ranging from $5,000 to $200,000 accounts.
[06:49] And finally, some of the best offers if you are a futures trader. in, check out the link in the description. Internal and external liquidity together form the market's dynamic liquidity.
[07:04] This is the real engine that drives price, pushing it higher, dragging it lower, or faking traders out along the way. Dynamic liquidity explains how liquidity flows through the market. Think of it as a loop. Price is
[07:17] constantly rotating between internal liquidity and external liquidity. It's either moving from a high or a low toward a fair value gap or from a fair value gap toward a high or a low. This rotation is the core rhythm of price
[07:29] movement. Once you understand that rhythm, everything changes. You stop fighting the market and start trading with it. Dynamic liquidity is the force that pulls price forward. And that insight gives you a powerful edge in
[07:41] anticipating direction and timing the next move. Inside a trading range, price usually moves first toward internal liquidity. That internal liquidity can appear as internal highs or lows or as fair value
[07:55] gaps. As price approaches these internal targets, inducement forms. And once internal liquidity is swept or the imbalance inside the fair value gap is outward. At that point, price starts searching
[08:10] for the next pool of external liquidity to expand toward. And when that happens, old liquidity is removed, new liquidity is created, and price becomes drawn toward a fresh external target. That new draw is dynamic liquidity. So, if you're
[08:25] buying or selling inside the range without understanding this process, you're most likely doing one thing, providing liquidity, not taking it. This process repeats over and over on every time frame. Once you understand dynamic
[08:39] liquidity, you stop holding trades too long. You stop targeting invalid highs and lows. You stop forcing bias. Now, here comes the real challenge. You
[08:51] might ask, how do we predict where the price is heading next? Will it move higher to sweep upper external liquidity or drop lower to grab lower external liquidity? To answer that, we need to focus on how price behaves when it
[09:04] enters fair value gaps within the trading range. This is where direction becomes clear. If price enters a fair value gap, respects it and especially respects the midpoint while showing signs of rejection to the upside, it
[09:18] strongly suggests that price is preparing to move higher targeting the upper external liquidity. On the other hand, if price disrespects the fair value gap, meaning it breaks straight through it with no meaningful reaction,
[09:31] that gap flips its role. it becomes what we call an inverse fair value gap. Now acting more like a resistance zone. And if price then retraces back into that inverse gap and respects the midpoint this time showing clear rejection,
[09:47] that's an early and powerful sign that the market is likely to continue lower aiming to sweep the external sellside liquidity resting below the trading range low. Now what happens if we have healthy and
[10:00] efficient price action inside our trading range? meaning there's no internal liquidity left to be addressed. How does price behave in that situation? As we mentioned earlier, price normally rotates between internal and external
[10:15] liquidity. But when internal liquidity is absent, when price action is clean, balanced and efficient, external liquidity becomes the only driver of price movement. In scenarios like this, price begins to move directly between
[10:29] buy side and sellside liquidity. It targets the major highs and lows where stop orders are most likely resting, cycling from one external liquidity pool to another. This back and forth movement continues until something changes, until
[10:44] a new inefficiency forms, a fair value gap appears, or a new inducement develops. At that point, internal liquidity re-enters the equation and the full liquidity chain is restored. Now that you understand dynamic liquidity
[10:59] and how price is driven inside a range, the next important hack we need to cover is the liquidity sweep. A liquidity sweep is all about one thing. Price takes liquidity above or below a key level, then immediately
[11:12] closes back inside that level's range, and from there it drives price toward the opposite side's liquidity. For example, if price sweeps a key buyside liquidity level, we expect price to shift direction almost immediately and
[11:25] move towards sellside liquidity at the opposing key level. This is one of my favorite liquidity models because the market does this every single day and it offers one of the best opportunities to build a clear trading plan and align
[11:38] yourself with institutional money instead of fighting it. There are two main types of liquidity sweeps. The first type is a sweep of key external liquidity levels. These are the highest probability sweeps and the ones
[11:53] we always want to focus on trading. The second type is a sweep of internal liquidity levels. These are much lower probabilities and this is where most traders get trapped by fake moves and inducements.
[12:06] Highquality liquidity sweeps most often occur during high volume time windows, typically right before or right after a major session opens. For example, here open, price makes a fake push to the upside, sweeping the liquidity built
[12:21] above the Asia session high. But immediately after clearing the buyside liquidity, the price reverses sharply in the opposite direction and takes out Asia's low as well. So in this sequence, price sweeps both buy side and sellside
[12:34] liquidity and then continues in its intended direction. price does the exact same thing at the New York session open. price pushes buyside liquidity resting there, and
[12:48] the next key sellside liquidity, which is the London low. From there, the that Smart Money planned from the beginning. Now, we also have liquidity sweeps that occur at internal swing highs or lows
[13:04] inside a trading range. These are not real liquidity sweeps, and most of the time they lead to low probability trades. The reason is simple. The most important liquidity always sits above or below the high and low of the trading
[13:17] range. Because of that, price is far more likely to target external liquidity, not internal swing points. So, our focus should always be on liquidity sweeps at key external levels, not just any internal high or low.
[13:31] can create a highquality trade opportunity. If price sweeps internal liquidity right before tapping into an unmititigated fair value gap on the increases the probability of a sharp move toward the next external liquidity
[13:45] pool, especially when it aligns with the higher time frame trend. This is where internal liquidity acts as fuel, not as the final target. That's it traders. Thanks for watching. I hope you found this video valuable. If
[13:59] you did, hit subscribe and turn on notifications so you never miss an update. Drop a comment below with your thoughts or topics you'd like to see next. Your support means the world to us.



⚡ Saved you 0h 14m reading this? Transcribe any YouTube video for free — no signup needed.