
What is Liquidity in Trading?
45sExplains a core concept simply, appealing to beginners and traders looking for edge.
▶ Play Clip"The title promises every ICT concept in 14 minutes, and the video delivers a comprehensive overview of all major concepts within that timeframe."
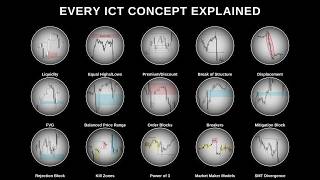
This video provides a comprehensive overview of Inner Circle Trader (ICT) concepts, including liquidity, market structure, displacement, fair value gaps, order blocks, and more. It explains how these concepts help traders identify high-probability setups by understanding institutional order flow and market manipulation.
Buy stops above old lows and sell stops below old highs represent pending orders that price hunts to fill big positions. Old highs are sell side liquidity, old lows are buy side liquidity. This shows where traders get trapped and where the market is reaching.
Liquidity exists at old yearly, monthly, weekly, daily, and session highs and lows. Higher timeframes have more orders built up.
When price trades below an old low but fails to continue lower and closes back above, it indicates trapped shorts or stopped-out longs. The market then targets previous liquidity, like an old daily high.
When a level hasn't been taken out, more orders stack there. Two or more highs or lows at the same level create a flat line of resting liquidity. These become high-probability targets.
Price rotates around an equilibrium point (50% Fibonacci). Using Fibonacci from swing low to swing high, premium is above 50%, discount is below. Price tends to reject from premium and spend little time there.
In a bullish market, look for higher highs and higher lows. A break of structure (closing through an old swing low) signals a trend change. Retracements inside a trend are normal.
Displacement shows institutional intent with fast, one-sided price movement. It indicates an imbalance between buyers and sellers. After displacement, consolidation follows.
A three-candle pattern where price moves so fast it skips levels, leaving an imbalance between candle 1 and candle 3. Price often retraces to fill the gap before continuing.
When a fair value gap is broken instead of respected, it inverts. Old support becomes resistance or vice versa. Failure is the signal to trade the other direction.
When two fair value gaps overlap (one bullish, one bearish), it creates a strong zone. Price tends to react strongly away from these levels.
The last opposing candle before a price swing. They provide a clean stop-loss level. Bullish order block: last down close candle before a bullish swing. Bearish: last up close candle before a bearish swing.
Failed order blocks that get violated and then flip to act as support/resistance. The swing that creates the breaker must take out liquidity first.
Similar to breakers but the previous price swing does not take out liquidity. Traders who were long mitigate losses by exiting or entering short after the block is retested.
Zones drawn from candle wicks where price spiked and rejected. Long tails indicate rejection. Price tends to respect the same wick zone on retest.
High-volume trading sessions: Asia, London, New York. Patterns have different effectiveness depending on the session. Clean patterns during lunch are less reliable.
Accumulation: price coils and builds consolidation. Manipulation: false run on stops to trap breakout traders. Distribution: real move in the opposite direction.
After accumulation and a stop run, a displacement signals the end of the trend. Then distribution begins with markdown phases.
When correlated assets (e.g., ES vs NQ) disagree. One makes a higher high while the other fails. The weaker asset is the one to trade in the direction of the divergence.
Mastering ICT concepts like liquidity, displacement, and order blocks can provide a roadmap of institutional activity, helping traders avoid traps and trade with the smart money. However, consistent application requires practice and experience.
What is buy side liquidity?
Buy stops that sit above old lows, which are pending orders that price hunts to fill big positions.
00:02
What is sell side liquidity?
Sell stops that sit below old highs, representing pending orders that price hunts to fill big positions.
00:02
Where does liquidity exist?
At old yearly, monthly, weekly, daily, and session highs and lows.
00:28
What are equal highs and lows?
Two or more highs or lows that stall at the same level, leaving a flat line of resting liquidity above or below.
01:06
How is premium and discount defined using Fibonacci?
Premium is above 50% (from swing low to swing high), discount is below 50%. Price rotates from discount to premium and vice versa.
01:58
What is displacement?
A fast, one-sided price movement that shows institutional intent and an imbalance between buyers and sellers.
04:22
What is a fair value gap?
A three-candle pattern where price moves so fast it skips levels, leaving an imbalance between the wick of candle 1 and the wick of candle 3.
05:01
What is an inversion fair value gap?
When a fair value gap is broken instead of respected, it inverts, turning old support into resistance or vice versa.
05:55
What is a balanced price range?
When two fair value gaps overlap (one bullish, one bearish), creating a strong zone that price reacts strongly away from.
06:37
What is an order block?
The last opposing candle prior to a price swing. For a bullish order block, it's the last down close candle before a bullish swing.
07:19
What is a breaker block?
A failed order block that gets violated and then flips to act as support or resistance. The swing that creates it must take out liquidity.
08:00
What is a mitigation block?
Similar to a breaker block but the previous price swing does not take out liquidity. Traders mitigate losses by exiting or entering short after retest.
08:51
What is a rejection block?
A zone drawn from candle wicks where price spiked and rejected, often with long tails. Price tends to respect the same wick zone on retest.
09:27
What are the three phases of market structure?
Accumulation (coiling/consolidation), Manipulation (false run on stops), and Distribution (real move in opposite direction).
10:46
What is SMT divergence?
When correlated assets disagree, e.g., one makes a higher high while the other fails. The weaker asset is traded in the direction of the divergence.
12:45
Liquidity Definition
Core concept that explains where pending orders are and how price hunts them.
00:02Premium and Discount
Provides a framework for identifying high-probability entry zones using Fibonacci.
01:58Displacement as Institutional Intent
Key to distinguishing real moves from noise.
04:22Fair Value Gap Pattern
A reliable pullback entry pattern after impulsive moves.
05:01Market Structure Phases
Provides a complete roadmap of market manipulation and delivery.
10:46[00:02] the market. So, buy stops that sit above old lows. They're pending orders that price eventually hunts to fill big positions. So, think about old highs,
[00:14] that's sell side liquidity. Why does this actually matter? Is it provides context. It shows you where traders get trapped, where they decide that they're losses, and where the market's actually reaching to. So, pending take profit
[00:28] orders. Now, where does liquidity actually exist? Well, old yearly highs and lows, old monthly highs and lows, old weekly highs and lows, old daily highs and lows, and old session highs and lows. Obviously, the higher time
[00:41] there's more time for orders to be built up. Now, how do you actually use it? In here. You can see the market traded below it, but failed to continue lower. Once we see the market failing to continue lower and closing back above
[00:54] this old daily low, it's showing us the context that many traders either got trapped in short positions or they were stopped out of their longs. So, when the going to target? It's going to target a previous level of liquidity being this
[01:06] old daily high. Equal highs and lows. Now, in regards to liquidity, when a level hasn't been taken out, it just shows us that more and more orders are being stacked at those specific levels. So, two or more highs or lows that stall
[01:18] at the same level, leaving a flat line of resting liquidity above or below. Why becomes a high probability target where price tends to gravitate towards these levels, and they're easy to spot. So, in this example, you can see that these
[01:31] equal highs are being stacked here. Note how this high does not take out this more liquidity being built up above these old highs. Now, eventually, it for it to actually trade back up to these equal highs. But, over time, you
[01:45] slowly gravitating towards that level and then takes it out. Now, here's our bearish example. We have these old equal lows being put into place, and you can gravitates back to that level. So, over time, there are more and more stop
[01:58] losses or pending orders being put in place below these equal lows. The market that level and then eventually trades down to those equal lows. Premium and moving around an equilibrium point. And then eventually the market becomes
[02:12] to these equilibrium points. So, if we can define a range from a swing low to a market is trading at a premium or at a discount. Now, why does it actually matter? Well, price is always rotating from discount to premium and premium to
[02:25] discount. But, knowing which half you're in right now allows you to keep buying do this, we use the Fibonacci retracement tool. So, if you want to correctly define premium and discount, you have to find visible swings in the
[02:37] market. So, in this case, we're anchoring our Fibonacci to this high and to this low. You can see after we make this swing point, how many times price trades up to a premium and then rejects very quickly. You can see how much time
[02:49] it actually spends above premium. It's not very long. Whereas, if you're trying to sell it at a discount, right below 50%, you can see how much time it actually spends before it actually breaks down. So, positioning yourself,
[03:01] if you're bearish, above these premium levels will get you the best fill prices and the highest probability trades. Now, for our bullish example, we can see that we have this old swing high here and the market trades back to a discount prior
[03:14] to running higher. Now, I want to keep in mind that as this market is creating going to change. Because initially, we did have this swing low to this swing traded back down to a discount here and then created another swing point from
[03:27] back down to a discount, and then eventually traded higher. Break of you determine which side of the trend you're actually trading on. So, in a bullish market, you want to see higher highs and higher lows. In a bearish
[03:40] lower lows. And in our case, we're looking for closures through these you confirmation that the trend is going to continue. And as As as the structure stay with it. There are going to be retracements inside of a trend where we
[03:55] range before it continues higher. Now, let's look at two examples right here. We have this old swing low, and note how after we close through this old swing this liquidity. Well, let's say the market is extremely oversold and we have
[04:09] this old swing high here. Once we close through it, that's our market structure then wants to trade higher. And then one more example up here, we have this old low, that's our market structure shift and you can see that the market then
[04:22] trades lower. Displacement. Now, this is really institutional intent. They're show you that there's an imbalance between buyers and sellers. And it proves intent. Being able to spot displacement will help you separate a
[04:34] real move from a slow grind. Now, when we're talking about one-sided delivery, we can see here that in all of these red circles, the market moved very quickly we get displacement, we get consolidation. After each displacement
[04:47] leg, there's more consolidation. And I want you to know how many candles it this ground. All right, we have two bearish candles in here, but how many up to this price level. So, all displacement does is tell you if bulls
[05:01] Fair value gap. So, this concept actually shows you an imbalance in the marketplace. It's a three candle pattern where price moves so fast that it skips levels leaving an imbalance between candle one and candle three. Price often
[05:15] prior to continuing in the same direction. It gives you a level to enter on the pullback instead of chasing the displacement. So, here we have a bearish fair value gap. Note how we have candle one, candle two, and candle three. And
[05:28] note how the wick of candle one and the wick of candle three leaves a large gap in price. That's our fair value gap. And once we trade back into that fair value looking for to rebalance this fair value gap and then we're going to target
[05:41] our bullish example. So, we have a create another bullish fair value gap here. We have candle one, note how it one and the wick of candle three. Once we retrace to that level and fill in
[05:55] the upside targeting this liquidity. Inversion fair value gaps. Not every fair value gap is going to be a successful trade. But a gap that flips, the fair value gap and instead of respecting it, the gap inverts. Now, old
[06:10] support becomes resistance or old resistance becomes support. Failure is the signal. So, if you have a fair value gap and it trades through that level, trade in the other direction. So, here we can see a bearish fair value gap here
[06:23] between candles one, two, and three. Note how we close through that level, structure, retests this inverted fair value gap, and then continues higher. gap, note how we close through that level, retrace and respect it twice
[06:37] before trading lower. Balanced price range. This is when two fair value gaps fair value gap overlapping with a bearish fair value gap or vice versa. imbalance in both directions. Now, why it matters is because it's a strong zone
[06:51] when they do appear, they tend to react very strongly away from those levels. bearish fair value gap and then we have a bullish fair value gap that appears shortly after that's created. The market then trades back to that balanced price
[07:04] really higher. The market then retraces back to this balanced price range and have another balanced price range, so we have this bullish fair value gap gap. Note how we get this very strong rejection and then we get a nice
[07:19] price range and then the market quickly moves lower. Order blocks. Order blocks are the last opposing candle prior to a price swing. These candles give you a clean place to put your stop loss with defined risk, anticipating that the
[07:32] bullish example, we have this down close candle, right? So, we have this bearish swing. Note how the market retraces to this level and reloads on orders prior to trading higher. And your stop loss would go below the low of this order
[07:46] bearish order block, so we have this last up close candle prior to a bearish here. On the retracement, they're reloading shorts, and if you have your stop loss above the order block high, you'd be protected. And we can see the
[08:00] order block. Breaker blocks. Now, these are just failed order blocks. So, you might have an order block that gets violated and then price flips to respect it other side. So, another example of support becoming resistance or the
[08:13] reverse. The failure is the signal, just like inverted fair value gaps. Now, the one caveat to breaker blocks is the swing that creates the breaker needs to take out liquidity. So, we have this bullish order block here, right? So, we
[08:26] have this down close candle prior to a bullish price swing. It takes out a it. And we can see that this swing high is a raid on liquidity, and then once we break through this order block, it becomes resistance. Now, in this bullish
[08:39] example, we have this up close candle, which is our bearish order block, prior to running out liquidity. Once it closes back through this order block, it acts as support, [music] and then the market continues higher. Again, an important
[08:51] caveat to breakers is that the order block prior to being broken needs to take out liquidity. So, we have this order block here, it takes out sell side liquidity, breaks through it, and then continues. Mitigation blocks. Mitigation
[09:03] blocks are very similar to breakers, but the previous price swing does not take out liquidity. Now, in this bullish example of a mitigation block, we can see that we have this bearish order block, but the price swing does not take
[09:15] out this liquidity before trading higher. In this example, we have this swing, right? We have this bullish order block, but the price swing does not take out the previous swing high. It then breaks through that level, so any trader
[09:27] that was long is now trying to mitigate their loss by exiting or entering short after this mitigation block is retested, and then the market trades lower. Rejection blocks. Now, these candles are built from the wicks. So, a zone drawn
[09:39] off candle wicks rather than bodies where price spiked and rejected hard. for. We're looking for candles that have long tails. Now, price tends to respect that same wick zone. So, when it taps back into it and rejects a second time,
[09:53] have a bullish rejection block. So, we can see that this is a very long wick here, and know how the market traded back into that level and respected this wick. Now, here's a bearish rejection block. Know how this candle has a very
[10:05] long wick to the upside. The market trades into that wick, but fails to collapses. Kill zones. These are the of the volume is coming in. So, we have Asia, London, and New York. Why this is
[10:18] important is because your time filter actually matters. If you're trading the same effectiveness if you trade it during Asia compared to New York. And if you see a clean pattern that occurs at lunch, it's just not the same trade as
[10:31] can see the three different trading windows. We have Asia, London, and then in in New York and what the market is actually doing. So, during Asia and but during New York is when it actually
[10:46] takes out this previous daily high, and then we get a very large reaction from has three different phases. We have accumulation, manipulation, and when price coils and builds a consolidation. Positions are getting
[11:01] loaded quietly before anything actually appears to happen. Manipulation is the trap. So, we might get a false run on stops going the wrong way that traps breakout traders. And then distribution is the real move. So, the real delivery
[11:13] finally arrives in the opposite direction of the trap. Now, in this example, we could clearly see that the market is stuck sideways in this bar coding consolidation pattern. And then we get a run lower to try and trap
[11:25] market, and we trade outside of the range, and then the market continues distribution phase. So, you have to think about all the traders that are participating inside of this consolidation area. They might have buy
[11:38] below the lows. And what they're trying to do is catch a bunch of traders offside as liquidity as the market trades lower before sending it higher. give you a full roadmap of what the market is actually doing in each phase.
[11:53] Are we accumulating? Are we manipulating? Or are we distributing? sell side of the curve. Now, the termination point, we're always going to see a stop run into a reversal. And then we're going to deliver the other side of
[12:05] the curve. Now, why it matters is once you can spot which stage you're in, the fake out stop fooling you and you trade with the delivery. So, here we can see higher. So, we have all of these accumulation phases. We have these
[12:18] accumulation phase. We have a markup, accumulation into a stop run. And then we get a displacement that's showing us the smart money reversal. Right? So, the smart money reversal is telling us, "Hey, this uptrend is finally over. We
[12:31] start distributing." Now, we have a redistribution phase, a markdown, a redistribution phase, a markdown, a redistribution phase, a markdown. Then we have more sideways price action and another final markdown. SMT divergence.
[12:45] SMT divergence is when correlated assets disagree with each other. So, in this case, we might use ES versus NQ or euro versus the pound. One makes a higher high while the other fails to. And the mismatch is the tell. When you have two
[12:59] with each other, it's giving you the indication of which market is stronger markets, we want to make sure that we're actually measuring the right time against the highs or lows that it's creating. So, in this example, I want to
[13:13] make sure that this candle high aligns with this candle high. Now, this happened, I believe, on July 1st around 9:00 a.m. So, we have this candle high 1st at 9:00 a.m. And then we have another candle high over here that's
[13:26] printed around 11:00 a.m. on July 2nd. Note how Nasdaq created a lower high compared to ES. ES created a higher high. So, if you're going to use SMT divergence, and let's say if you're bearish on both the markets, which asset
[13:41] is actually weaker compared to each other? In this case, it's the Nasdaq because it failed to create a higher high. So, if you're trading SMT divergence, you want to trade the weaker asset if you're bearish. Now, look,
[13:53] knowing all these concepts and trading them consistently are two completely different things. It took me almost 14 years and thousands of hours before this have to do it alone. That's why I built Trading Apprentice. It's my program
[14:05] where I personally walk through hundreds of traders each and every week trading experience that helped me get a two and a half million-dollar payout at Apex. trading that you're in. I have guys that are just getting to their first payouts
[14:18] consistently, and others that are making $50,000 payouts in just a couple of I don't work with the just anyone. If you're interested, check out the link in for watching, and I'll see you guys in the next one.
⚡ Saved you 0h 14m reading this? Transcribe any YouTube video for free — no signup needed.