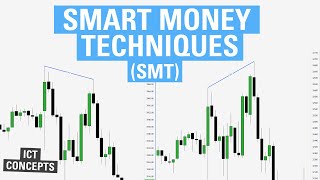

What is SMT Divergence?
40sClearly explains a key trading concept with a simple example, appealing to traders seeking edge.
▶ Play Clip"Title accurately describes the content: a clear explanation of SMT divergence within ICT concepts."
This video explains the concept of Smart Money Technique (SMT) divergence, a key ICT (Inner Circle Trader) concept used to identify potential reversals by comparing the price structures of correlated assets like the S&P 500 (ES), Dow Jones (YM), and NASDAQ (NQ). The presenter defines bullish and bearish SMT, provides multiple examples of how to spot divergences, and demonstrates how to use SMT as a confluence for lower time frame entries.
SMT (Smart Money Technique) is based on the idea that correlated assets (e.g., ES, YM, NQ) generally have the same structure. When one asset makes a lower low, the others should too. SMT occurs when there is a divergence: one asset makes a lower low while another makes a higher low (bullish) or one makes a lower high while another makes a higher high (bearish).
A bullish SMT occurs at the lows. In the example, the S&P makes a lower low while the Dow makes a higher low, indicating a possible bullish reversal.
A bearish SMT occurs at the highs. The S&P makes a lower high while the Dow makes a higher high, indicating a possible bearish reversal.
The presenter shows a chart with a low at 2 AM. The S&P breaks the low, but the NASDAQ does not, creating an SMT that suggests an upside move.
A blank chart is shown for viewers to practice identifying SMTs. The presenter then highlights a high where the S&P takes the high but the NASDAQ does not, indicating a possible reversal.
SMT can also occur within a fair value gap (FVG). After an aggressive move down, the S&P enters an FVG but the NASDAQ does not, creating an SMT.
The presenter uses SMT as a confluence to an existing model. When an SMT forms, they look for a lower time frame entry model (e.g., 2-minute chart) to enter the trade.
On a 2-minute chart of the S&P, the presenter identifies a deviation from a range, retest, and confirmation. They also mark a 'city' (likely a typo for 'ICT' or 'SMT') or a box setup as an entry area.
The presenter uses NASDAQ hitting price targets as a target for ES. When NASDAQ takes lows and creates an SMT, it indicates a possible reversal to the upside, which can be used as a target for ES.
Using a 1-minute chart of the S&P, the presenter shows a break of structure, a fair value gap, and an order block as possible entries. The SMT on the 15-minute frame is used to frame the trade.
SMT divergence is a powerful tool for identifying potential reversals by comparing price structures of correlated assets. It should be used as a confluence with lower time frame entry models for effective trading.
What does SMT stand for?
Smart Money Technique.
00:08
What is the basic premise of SMT?
Correlated assets generally have the same structure; when they diverge, it indicates a potential reversal.
00:08
What is a bullish SMT?
At the lows, one asset makes a lower low while another makes a higher low, indicating a possible bullish reversal.
00:49
What is a bearish SMT?
At the highs, one asset makes a lower high while another makes a higher high, indicating a possible bearish reversal.
01:05
How does the presenter use SMT in trading?
As a confluence to an existing model, then looking for a lower time frame entry.
04:50
What lower time frame entry model is mentioned?
A deviation from a range, retesting that deviation with confirmation, or a box setup.
05:21
How are price targets set using SMT?
By using the other asset hitting price targets as the target for the traded asset.
06:17
Core SMT Definition
Establishes the foundational concept that correlated assets should move together, and divergence signals reversals.
00:08Bullish SMT Example
Provides a clear visual example of a bullish divergence at lows.
00:49Bearish SMT Example
Provides a clear visual example of a bearish divergence at highs.
01:05SMT Within Fair Value Gaps
Shows a specific context where SMT can occur, adding depth to the concept.
04:10SMT as Confluence
Explains practical application: SMT is not a standalone signal but a confluence factor.
04:50[00:08] going to be over smart money techniques or smt or related assets generally have the same structure for example when es is making it lower low ymr and Q should be making a lower low as well when it's making a lower high lower high as well
[00:23] and so on what happens when you get an smt is when you get a Divergence here so instead of making a lower low right here one of the assets makes a higher low
[00:35] like that this is where your smt would be so you have a lower load to a lower low but a lower low to a higher low so I'm working that out it would look something like that and this is an indication that there may be a reversal
[00:49] the example I just showed would be a bullish smt since the smt is occurring at the lows and if indicating a possible reversal that would be a bullish reversal now for a bearish smt this smt would
[01:05] occur at the highs because if it indicates a possible reversal price would be moving down so looking at this example here you can see we put in a higher high on the S P but we also put in a higher high on the Dow now
[01:22] in a higher high on the Dow now we go in we put in a lowered low on the we go in we put in a lowered low on the s p and we also put in a lower low on the dowel now here is where we get our Divergence as you notice
[01:35] Divergence as you notice s p puts in a lower high while the bowel puts in a higher high this is our Divergence here as you see the structure Divergence here as you see the structure diverge right SMP making a lower high so
[01:50] diverge right SMP making a lower high so not taking out this high and DOW taking out this high so removing all the structure let's break this down pretty simply we have a certain High We are watching
[02:06] one asset does break it that is our structure that aligns to give us our smt so a couple more examples of identifying an smt before we hop into how I actually
[02:19] right here and if you notice we have this low put in here so we're watching this 2 Am low as well as the 2AM low here now if you notice
[02:34] NASDAQ is not breaking the slow while s p is taking this low so if NASDAQ is to not break this low then we have an smt which could indicate
[02:46] that we want an upside move so as we played this out for this expansion or this move upwards the last few examples here I have a
[03:02] blank chart if you want to take a minute and look at the lows and highs see if you see any possible smt feel free to do so before I begin and the high we'll be looking at is right here so if you notice
[03:18] SMP takes this high NASDAQ doesn't this indicates a possible reversal in this area if it fits the other confluences so letting this play other confluences so letting this play out
[03:36] other high and low that we are reaching on one index versus the other that may indicate a possible reversal well here's our obvious low here's our obvious low so we have another smt
[03:57] something like this so if we let this continue to play out you can see we go and we hit our terminus the last smt I want to talk about are those within a fair value Gap so if you
[04:10] notice we have this smt at the highs from our previous example and we get an aggressive move down we have a fair value Gap right here and right here so if I draw those out you can see the fair value gaps pretty clearly so as we
[04:24] value gaps pretty clearly so as we continue to play out price here fair value Gap so the s p came up into this fair value Gap all NASDAQ does not
[04:37] so if we let this play out a few more candles then put in that smt from the previous example now that we understand what smts
[04:50] look like and how to identify them how do I actually utilize smts in my trading do I actually utilize smts in my trading I personally use smts as a Confluence to an already existing model so for example when an smt forms up here I will look
[05:04] for a lower time frame entry model using that as a Confluence so before we get into this example I just want to show you right here on NASDAQ and just remember at 8 35 NASDAQ takes these lows or creates that smt at the lows
[05:21] we're going through this with the benefit of hindsight but that will come into effect later on choosing price targets so hopping into the s p here and going down to a lower time frame here we have a two minute chart a very
[05:36] early entry would be this deviation from the range retesting that deviation but waiting for some confirmation we will let this play out and we get an aggressive move down if you notice we have a city right here or
[05:50] a VPR so marking out this right here we have an area of Interest or if we Mark out the box setup for those of you that have watched that video that would be the entry as well
[06:04] so somewhere in the middle of the city or start of it let's go with the start of it with our stop at the highs where do we target well I want to be targeting some lows so
[06:17] ideally those so now let's watch this play out we come back up this would be the Box setup entry so if we wanted to see that
[06:33] setup entry so if we wanted to see that it would look something like this now if you remember what I wanted to say was 8 35 NASDAQ took those lows right so right in here so we will watch until then
[06:49] down here but if you notice this is when NASDAQ takes these lows down here which creates an smt this indicates a possible reversal to the upside and so sometimes I will use
[07:02] NASDAQ hitting price targets as my price target for ES and X being the position target for ES and X being the position in here trade when an smt is presented that is completely dependent on the lower time
[07:18] frames and which one looks cleaner to me in this case s p looks cleaner to me however if I was getting later into this move down NASDAQ looks a lot cleaner here on the move back up I would personally look to trade NASDAQ as it
[07:33] has low resistance liquidity above but that is for another video for our final example here we will go back to the price action we were looking at at the very beginning of this video right here with this smt between the s p and DOW so
[07:48] going into our lower time frames this case the one minute what do we have we're just going to focus on the S P here so hop into that screen and we are looking for a lower time frame entry model for letting this play
[08:03] frame entry model for letting this play out we break structure here and create a fair value Gap here this would be a possible first entry however if we let it play out what do we have well we have an order
[08:19] block right here and that could be another entry not expecting it to reach another entry not expecting it to reach back up into here and then we can Target back up into here and then we can Target lows or wherever we are looking
[08:40] that would be an example of how taking this smt on the 15 minute and frame a trade I hope you enjoyed this video if you did
[08:52] please consider subscribing and liking does help me out and I hope you have a does help me out and I hope you have a great rest of your day see ya
⚡ Saved you 0h 09m reading this? Transcribe any YouTube video for free — no signup needed.