
What is a PD Array? ICT Explained
43sFundamental concept of premium and discount zones explained clearly, perfect for beginners.
▶ Play Clip"Delivers a solid overview of major ICT PD arrays with clear examples, living up to its promise of a comprehensive 20-minute explanation."
This video provides a comprehensive overview of ICT (Inner Circle Trader) PD arrays, explaining premium and discount zones and key tools like liquidity, order blocks, fair value gaps, and more. It teaches traders how to identify high-probability entry and exit points using these concepts.
ICT PD array stands for premium and discount. In a bullish range, above 50% is premium (sell zone), below is discount (buy zone).
50% of a range is the equilibrium. Above it is premium (sell), below is discount (buy).
Price tends to gravitate towards PD arrays, starting with liquidity.
Liquidity (highs and lows) is the market's fuel. Price sweeps liquidity to gather orders before reversing.
Price often breaks above resistance (taking out stops) and then reverses. This is a false breakout driven by liquidity.
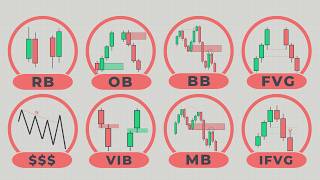
A rejection block consists of two consecutive candles with big wicks, indicating aggressive rejection. Price often returns to the 50% level of the block.
An order block is the last candle before a displacement in the opposite direction. Bearish order block: last bullish candle before bearish move. Bullish order block: last bearish candle before bullish move.
A breaker block occurs when an order block is disrespected (candle closure below/above) and then acts in the opposite direction, confirming a market structure shift.
A fair value gap is a three-candle pattern where the high of the first and low of the third do not overlap (bullish), or vice versa. Price returns to fill the gap.
When a fair value gap is disrespected, it becomes an inverse fair value gap, reversing polarity.
Similar to breaker blocks but with a failure swing (lower high/lower low) instead of a liquidity sweep. A disliked order block becomes a mitigation block.
A two-candle pattern where there is a gap between the closing price of one candle and the opening price of the next. More common in indices than forex.
Understanding these PD arrays allows traders to identify key levels and anticipate price movements. Mastering them requires practice and combining with other ICT concepts.
What is a PD array in ICT concepts?
An arrangement of ICT tools or levels in premium and discount zones.
00:02
What is the core fuel of the market according to ICT?
Liquidity, specifically highs and lows.
01:12
How is a rejection block defined?
Two consecutive candles with big wicks, indicating aggressive rejection from a level.
03:30
What is an order block?
The last candle before a displacement in the opposite direction. For a bearish move, it's the last bullish candle; for a bullish move, it's the last bearish candle.
06:38
What does a breaker block represent?
A failed order block that has been disrespected, confirming a market structure shift.
09:17
How is a fair value gap formed?
A three-candle pattern where the high of the first candle does not overlap with the low of the third candle (bullish gap), or vice versa (bearish gap).
12:17
What is an inverse fair value gap?
A fair value gap that has been disrespected by a candle closure, switching its polarity.
15:01
What is the difference between a breaker block and a mitigation block?
A breaker block involves a liquidity sweep (higher high/lower low), while a mitigation block involves a failure swing (lower high/higher low).
17:05
How is a volume imbalance different from a fair value gap?
Volume imbalance is a two-candle pattern based on gaps between closing and opening prices, whereas fair value gap is a three-candle pattern based on wicks.
19:10
Where does volume imbalance occur most frequently?
In indices more than forex.
20:29
PD Arrays as Magnets
Explains that price naturally gravitates toward these levels, making them reliable for trade planning.
00:57Liquidity Sweeps Drive Reversals
Reveals the mechanism behind false breakouts, a common market phenomenon.
01:38Order Block Definition
Provides a clear, actionable definition of the most popular PD array.
06:53Breaker Block Confirms Shift
Shows how a failed order block can confirm a change in market direction.
09:44FVG as Imbalance
Explains the rationale behind price returning to fill inefficiencies.
13:26[00:02] ICT PD array in details with examples understand what is a PD array and what is the PDR metric so in ICT Concepts PD stands for premium and discount and what
[00:16] does premium discount means in any range for example this bullish range from this low to this High that's a bullish range now 50% of this range if we take a gam box or Fibonacci retracement 50% which is in the middle that's the equilibrium
[00:31] of the range above it in a bullish scenario it's premium and we only look for sales above the 50% and below it it's a discount area and we only look for Buys in the discount in this bullish range for example so that's what a PD
[00:45] array is it's a premium and discount now what is a PD aray metrics it's an what is a PD aray metrics it's an arrangement of ICT tools or levels in premium and discount zone so there are tools here or zones to look for Sals and
[00:57] there are zones also here in an order to look for buys and those zones are used to enter trades as well as find buyas or Direction and they can act as magnet for price so price will usually go to those PD arrays starting with the first one
[01:12] which is highs and lows or in other words liquidity so simply this is the core of the market this is where the market will always go in order to get some fuel that's the fuel of the market so liquidity or highs and lows is the
[01:26] first PD that we have and in order to understand this we we're going to look at this in a support and resistance point of view okay so we have a resistance level a lot of people will think that price needs not to go above
[01:38] this level and then respect it the same as support but the reality of it is that Above This support level which is the swing high or multiple swing highs we have a lot of liquidity in other words we have a lot of orders so price will
[01:51] usually go above this sweep in other Wars and then go down that's a false breakout and you see this happen a lot why because we need to take some liquidity so liquidity can be highs and lows just any high and any low now
[02:05] and low probability ones that's another subject we also have equal highs and lows which we have high and another high at the same level which gets taken later here that's a false breakout same thing with that trend line we can use
[02:19] liquidity to enter trades immediately to Target and then to find a bias based on those highs and lows you can literally have a full trading plan based on just highs and lows when it comes to highs and lows or liquidity in general if we
[02:33] zoom in on the current price action of euro dollar we can see that most of the time when price take liquidity level in this case a high it reverses because it took liquidity from here while other people are thinking that this should be
[02:46] level but what's going to happen is price taking that given a false breakout and then reversing the same thing happening again in this case we see taking that liquidity level reversing and we can see that that also on the
[03:00] bullish side we can see that when price takes this low it goes up when it takes this low it goes up same thing so this is an example of highs and lows sometime we can have you know equal highs or relative equal highs or lows in this
[03:15] case we have this low as well as this low and you see that they're almost equal and what happened is price taken both here both lows taken and then the here when it comes to the bearish side taking this liquidity reverse in lower
[03:30] into the second PD array which is a rejection block and what is a rejection block so let's assume that we had for example a resistance level or support level or supply and demand whatever and we have for example a supply area where
[03:44] price reacted from aggressively creating big weeks in price action so price was going up creating a big Weck which means that big rejection and then another wig so in two candles we have big wigs big wigs are rejection blocks and we can use
[03:59] them when price goes up to the big wigs here which is simply from the highest here which is simply from the highest week to the body of both candles here that's a rejection block price will usually come back to this rejection
[04:13] block and then reject it from it again and why this happened because the body of the candle sometime can also act as liquidity there are some people who put their stop losses above the candle body instead of the high and we can see some
[04:27] liquidity also being inside of the week and and sometime because of spread price and and sometime because of spread price doesn't need to run and sweep the high people would get stopped out again because either they putting their stop
[04:41] loss at break even or it just taken out because of spread so big weeks are rejection block and they can be used as entry 50% of the rejection block is very crucial so you see from this point to the body that's our rediction block 50%
[04:56] of it is very crucial press can come to 50% and react aggressively higher time reality of the rejection block so higher time frame rejection block can equal to
[05:08] sometime you go to the lower time frame lower time frame order block here it's an order block instead of a rejection block that's why sometime it works perfectly however remember that it's
[05:21] very risky to enter a rejection block so I really suggest using other Peri arrays especially if you are a beginner because sometime press will just disres this and Target the high in state now as we said with rejection blocks there are big wigs
[05:34] that got rejected from another level so what we can see here is this big wig for example and it's not going to be every time so sometime when it's not valid that's why I don't suggest rejection block for beginners sometime per it can
[05:46] actually go above the high and take it instead of considering that PD aray as a rejection block it can be also a high but what we can see here is that a big wick that was rejected from a fair Valley Gap and what happened here is
[06:00] price coming to this rejection block and not taking the high but only coming not taking the high but only coming almost to 50% uh slightly above and then rejection the same thing happening for example here we get this big wick and
[06:12] same thing happening here we got those big Wicks actually one big and one small and the same thing also Happening Here with this big wick and price got rejected from so when we had big wig that got reacted from another level and
[06:26] it's already way up price will come only to that rejection block and not take the low now you got to be careful with this again because it can be a liquidity swiming State order block this is the most popular PD array that we have in
[06:39] the ICT Concepts now what is aut block is the change in the direction or in other words the change inst delivery so think about price going up and when we change the direction aut block would be somewhere in here now what is a bearish
[06:53] order Block in this case that's a bearish order block and usually it's a bullish candle so it's the last bullish candle before the bearish move we candle before the bearish move we identify a displacement and a very
[07:05] aggressive bearish move we look for the last bullish move and that's going to be our order block that's in general there are some specification that we can apply in general that's when the order block is bullish order block on the other hand
[07:20] and it's going to be what the last bearish candle before the bullish move so this one now is an order block and price can come back to and then push High higher same thing here price will go up to the bearish aut block and then
[07:33] push lower I have some videos to find the highest probability aut block so you can watch them but in general that's what an order block is now as we say order block is the change in Direction so if we can see that we are for example
[07:46] uh going lower here and then we switch bullish and there was a big displacement that means because it's a bullish move then the last bearish candle now this can be an order look but let's take another example also you can see that we
[07:59] are going lower and then we switch to bullish aggressively now this is bearish candle before the big bullish move then that means what we zoom in here that's a bullish order block and you can see after price going up it comes back to
[08:13] and then it goes up and this also can be an order block now I'm talking about order blocks in general sometime I would require an order block to have a fair value Gap with it another example of order block is this one because we had a
[08:26] bearish move to the WR side and that's the last bullish candle another example the last bullish candle another example also can be this one here so you see how we are going up here but before that we had a bearish move which is this order
[08:39] block right here so the last bearish candle in this case is and I can take the body you can see literally price reacting of that level now same thing reacting of that level now same thing can be right here that's also an aut
[08:51] block here now I have some requirements for order blocks but just for practicing that can be also an order block here so it's always the last bearish candle before a bullish move or the last bullish candle before a bearish move
[09:04] another example that's very nice as you see price coming lower going up and then aggressively going lower this is last bullish candle before the bearish move and you see price exactly reacting of that level a breaker block one of my
[09:18] best P arrays that I trade with now what is a breaker block let's first look at this right here this diagram when we have a supply zone for example disrespected what does it turn to to a Dem demand zone right and same thing
[09:31] demand disrespected it's equaling to supply same thing when it comes to support and resistance a support dis perspective it turns to a resistance and the same thing resistance dis perspective we got support now let's
[09:44] take the same about order blocks and breaker blocks a breaker block that failed and was disrespected it turns to a breaker block and it does the opposite so if it was a bullish order block then it becomes a bearish breaker block so
[09:57] breaker block is a fail order block and a lot of people actually complicated but Market suction shift you see this thing here Market suction shift point is most of the time a breakup block so failed order block you see how we had price
[10:12] going up coming lower going up and usually it's going to be associated with ses rather than break of structure so here we see no displacement Above This High which tell me that this order block here will mostly be disrespected and
[10:27] violated what do we Define disrespected it's going to be a candle closure below the order block so you see how we close below and then displacement below we come back this was a bearish candle before the bullish move which is a
[10:41] bullish utl it was disrespected and now it's a bearish breaker block price comes back to and then pushes lower so a failed bearish order block is a bullish breaker block a failed bullish order block is a bearish breaker block the
[10:54] good thing with a breaker block is that it confirms to you a market Su shift so you see this point here that's where a market SE shift is most of the time and that's where price comes to and started going lower so most of the time you're
[11:06] actually trading with a bias and with the real Direction now an example of a breaker block what we got to remember that in order to identify a valid an order block is if we go and look at this price action on the hourly chart on
[11:21] gold for example we can see here that we had few order blocks one of the order blocks that we have is this last bearish candle then price go close up and then disrespecting that order block on the buy a candle closure to the Lower Side
[11:34] now when I take this because now we have this order block that was bullish now and you see price respecting that bearish breaker block here now same thing is also here you can see that we had for example this Auto bearish one we
[11:50] disrespected buy candle closure here and then we comes back to it might not be the highest probability one but it's still valid and same thing here in in are bullish but the creation of a breakout block then disrespecting that
[12:04] one it turns to be on the other side and state so you see how we're going up from here that was disrespected price comes back to to push higher same thing here maybe an order block here and you see price comes back to it fair value Gap
[12:17] the second most popular perod array after aut block so this is also known as imbalance now why do we call it imbalance we're going to know and why is so what is a fair value Gap it's a three candle pattern representing rabid buying
[12:33] or selling pressure and price return to the Gap most of the time so you see it's a three candle pattern so we only look for this when we have three candles and it is the gap or the space between the first candles week to the third candles
[12:47] week so from here to here that's a bullish Fair Valley gap on the other hand a bearish fair Valley Gap would be this first candle the low of it and then the third candle the high of it this Zone here is your bearish fair value Gap
[13:00] and this one will be pushing price lower and most of the time again price will retrace to this why is that because this is an imbalance this is where we had a rapid up move that a lot of people trying to buy here and there was an
[13:14] efficiency here uh which means that a lot of people were trying to buy and they were not able to because there was only buying pressure here that a lot of the buying orders were not filled so what's going to happen is price will
[13:26] come back to this area to fill some of the orders and then it's going to go up and it's a fair value Gap because it's a fair value compared to buying here that's a basic understanding now not
[13:39] probability one and it means that it's going to hold that's why I do have a lot of different Advanced videos showing you which one is valid and which one is not an example of a fair value Gap and it's very easy to identify a fair value Gap
[13:52] that fair value gaps are always going to be associated with displacement and we also need to remember that it's a three candle pattern so we're going to identify it using three candles what we can see here for example anywhere in the
[14:05] that there was actually a big going to have a fair value Gap now we have three candles one here second here and then third here so you see inside of those three candles so in the candle
[14:20] that is in the middle what I'm trying to see is if the high of the first candle does not overlap with the low of the third candle then that becomes a fair value Gap so from this low to this High that's going to be a fair value Gap and
[14:34] you can see price comes here and reacted off now same thing we can see that oh actually this is a big displacement there's big move in the price action Gap and how do we make sure that we have it I'm going to look at the first candle
[14:48] candle high and we're going to see that they do not overlap that means we have a fair value Gap here and same thing here as well as here between and any three candles we can find this pattern and
[15:01] you to identify those so you can just go to the indicators Tab and type Fair valy options inverse fair value Gap now the same logic that we took with support and resistance supply and demand as well as
[15:15] order block and breaker block the same thing applies here so we have a fair value Gap that is bullish for example a candle closure below that fair value Gap means that we have disrespect and violation of that fair value gap which
[15:29] is going to equal to what that fair value Gap being inverse now which mean for example we had a supply Zone disrespected now it becomes a demand Zone that's the same logic here so bullish fair value Gap disrespected is
[15:43] going to equal to bearish invest fair value Gap bearish fair value Gap dis perspective is going to make a bullish fair value Gap so you see this one here this bullish for Val Gap candle closure below that activate this now as a
[15:57] bearish inverse for Val Gap and price will comes back to and then go lower you actually inside of the F value Gap and then pushing lower so the same logic as order block and breaker block applies here now the same thing with order block
[16:11] opposite of each other the same thing here when we have a fair value Gap the inverse fair value Gap when it gets disrespected so for example if we can
[16:23] zoom in here we can see that we have a fair value Gap but what happened is Gap first but what happened after is price disrespecting that fair value Gap now this fair value Gap was bullish when disrespected it acts as a bearish
[16:38] inverse fair value G and you can see price came back to it this fair value for example was not closed below here you see we did not close below it so it is still valid however if we just go here to the right we can see that price
[16:51] was going lower we had a fair value Gap here that is bearish but what happened after is price closed above so you see this candle here closed above it and what happened after is price coming exactly to that inverse bullish fair
[17:05] value Gap in this case just right here reacted of it and go higher mitigation block now let's remember what was happening with the breakout block it was price sweeping liquidity and then disrespecting the order block so we had
[17:19] a liquidity sweep or simply a higher high here in this situation mitigation block is the same thing as a breaker block but instead of having a liquidity sweep or a higher high here which price goes up so we had a higher high in this
[17:35] case we have a lower high or in other words failure swing so price failed to take the previous high and then sometime because of an smt and if you have no idea about what smt is I do have a lot of videos so simply price will not take
[17:49] this high and then disrespect this order block now this becomes a mitigation block and the same thing disrespect is equal to a candle closure now what do we see here in this price action an example of a mitigation block is this move here
[18:02] of a mitigation block is this move here you see price going lower higher taking this low going higher and creating a failure swing here so you see low higher low so failure swing then here is an order block that we have what happened
[18:16] order block that we have what happened here press coming it to once twice and then three times four times so a lot of touches but still price respecting that mitigation block now same thing here also you can see creating this low
[18:28] failure swing here this mitigation block here holding price higher and the same thing between this low and this it's a failure swing we have this price comes back to it and then go higher and in this move you see how we were going
[18:42] this move you see how we were going lower then higher creating higher high and then pushing lower this is now is a breaker block but when looking at the other one the other move this is to the upside failure swing going lower that
[18:56] means we have a mitigation block here so that's a breaker block and this is a mitigation block that's the difference between the two volume imbalance a very very simple trading concept and a very simple PD but really significant and
[19:10] you'll see that price a lot of time comes to those volume imbalance because they act as magnet for price so you will see most of the time price will come back to those zones the volume imbalances and it's going to react and
[19:23] it's going to give you precise entries but let's discuss what is a volume imbalance so when we're talking about value gaps it was a three candle patterns and we were dealing with weeks or you know low of the candle and high
[19:36] of the candles in this case in a volume imbalance we're looking for a a two candle pattern and instead of Wicks we're dealing with bodies or opening prices and closing prices so in this case you see we had this beish candle
[19:51] closes here that's the body of the candle and this one opens here but instead of opening at the same level which is supposed to happen right because we have a candle like this we have a candle like this the closing of
[20:04] the first candle should equal to the opening of the next candle but in this case we have closing here and opening here there was a gap between the closing and opening of two candles that's what a volume imbalance is and again price will
[20:17] come here we could have looked for an entry on the lower time frame to push lower same thing here a bullish volume IM balance it's the gap between two candles body so you see this body here and this body price will come back to
[20:29] after some time in the right time and then it's going to push higher and this happened more in indices more than for exps what we can see here is price closed here for this week and next week open here there is a gap between the
[20:42] closing price of this candle and the opening of this candle zoom in and you can see that price immediately on the next week comes back to this volume imbalance fill it and go higher and same thing we can see here for example there
[20:56] is this volume imbalance from here to here and price comes back to start pushing higher now there is also one that is here you see from this closing price to this opening price there was a big big volume imbalance and what happen
[21:12] is immediately next week price comes back and fill you know big part of it and then pushes higher and then after a few weeks fill it fully and then also react from it here so see it's a very major level and also price is coming
[21:27] major level and also price is coming back to it now but
⚡ Saved you 0h 21m reading this? Transcribe any YouTube video for free — no signup needed.