

Why You Hesitate on Entries
45sDirectly addresses a common pain point for traders (hesitation) and promises a solution, making it highly relatable and clickable.
▶ Play Clip"Delivers exactly what the title promises — a detailed breakdown of entry models, though the 'sniper' aspect is only a brief advanced teaser."
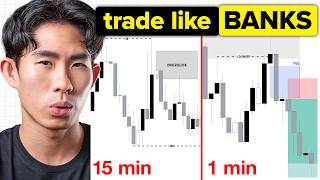
This lesson from the Market Mechanics Mentorship series focuses on two entry models: the Market Shift and the Flip Zone. It emphasizes that understanding market concepts is not enough; traders need a repeatable execution model to enter trades with confidence. The lesson provides a systematic framework for identifying these entry models in the right context, with chart examples and practical tips.
Traders hesitate because they lack a clear entry model, leading to second-guessing and missed opportunities.
Entry models are not random patterns; they must be paired with higher time frame bias, correct location, session, and liquidity conditions.
An entry model is a repeatable sequence of price action that answers what happens first, what confirms, where to enter, and where invalidation is.
The flip entry model involves a failed reaction from a supply/demand zone, indicating a shift in order flow and sentiment.
The market shift entry model requires a shift in internal structure from bearish to bullish, confirming the pullback is over.
Only drop to lower time frames (e.g., 5-minute) when price mitigates a medium-term point of interest (e.g., 15-minute demand zone).
A false breakout occurs when price breaks structure but reverses due to insufficient liquidity, often a smart money manipulation.
Context matters more than the entry confirmation; a clean entry model in the wrong location is a bad trade.
After a market shift, wait for a pullback to the demand zone that created the shift before entering.
For precise entries, use the 1-minute time frame to spot fractal market shifts and place tight stop losses.
What is an entry model?
A repeatable sequence of price action you wait for before entering a trade.
03:24
What are the two main entry models discussed?
Market shift entry model and flip zone entry model.
00:43
What is a flip zone?
It's a zone that caused the opposing zone to fail, indicating buyers overwhelmed sellers.
09:10
What is a market shift?
A shift in market structure from bearish to bullish, confirming the pullback is over.
06:08
What is the first step in the systematic framework for entry?
Wait for price to mitigate a medium-term point of interest, then drop to a lower time frame to look for the entry model.
06:50
Why should you wait for a liquidity sweep before a market shift?
To sweep as much liquidity as possible to fuel the move.
11:22
What is a false breakout in the context of the market shift entry model?
A false breakout occurs when price breaks structure but then reverses, indicating insufficient buyers to sustain the move.
12:40
What is the recommended stop loss and take profit placement?
Place a stop loss below the zone or the entry candle, and set a take profit at 2R.
29:43
What is the mechanical rule when a flip zone and extreme zone coincide?
If a flip zone and an extreme zone are at the same area, enter at the extreme zone.
22:13
What is the purpose of these entry models?
To avoid entering too early and to wait for the market to reveal more information.
15:11
Context Over Pattern
Emphasizes that entry models are meaningless without the right higher time frame bias, location, and liquidity conditions.
01:28Market Shift Definition
Provides a clear, actionable definition of a market shift as a shift in internal structure from bearish to bullish.
06:08Flip Zone Explained
Explains the flip zone as a failed reaction, indicating a shift in order flow and sentiment.
09:10Context Matters More
Reinforces that a clean entry model in the wrong location is a bad trade, highlighting the importance of holistic analysis.
15:50Mechanical Rule for Zones
Provides a specific rule to choose the extreme zone over the flip zone when both are present, offering a clear decision-making guideline.
22:13[00:02] hesitate is because they do not have a clear entry model. They see a setup second-guessing themselves. They're still doubting themselves. They're still hesitating, not sure whether they should actually enter for the trade or not. Was
[00:17] that the liquidity sweep? Was that the market shift? Is this actually the real entry or am I too early or am I too late? And that is exactly what this lesson is going to solve. Right, so welcome to this lesson of the Market
[00:31] Mechanics Mentorship series. So far, we have talked about order flow, liquidity concepts, supply and demand zones, all of these good old Market Mechanics concepts. But at the end of the day, understanding the concepts is not
[00:43] enough. You still need to know how to actually enter for the trade. With confidence. With conviction. So in this lesson, I'm going to break down two of my main entry models, which is the market shift entry model and the
[01:00] flip zone entry model. Because the goal is not to understand the market intellectually. The goal is to know what you are waiting for when it is finally time to execute. At the end of the day, it's not about
[01:14] just understanding the theory. It's about having a repeatable model for execution. Having something that you can look out for the trade so that you can get consistent results.
[01:28] Now, before I break down these different entry models for you guys to see, you must understand that these entry models, they are not just random chart patterns that you have to memorize on the chart. These entry models only make sense when
[01:42] they appear in the right context. This means that you need to pair them with the right higher time frame bias. And they need to be located at the right point of interest.
[01:54] And it needs to happen at the right session with the right liquidity conditions and the right story behind the setup. The model itself is just the entry trigger. It's just the entry
[02:06] confirmation. It's just the pattern that you are looking out for before you enter for the trade. But it is not the reason for the trade. build a higher time frame bias, you develop a daily bias, you determine
[02:20] develop a daily bias, you determine who's in control of price, and then once then you look for this confirmation itself. All right. So, yeah, once again, this is the set of time frames that you should
[02:32] be following based on your trading style. If you're swing trader, this is following. Day trader, scalper. All right. So, pick the trading style that you are specializing in and focus on that set of time frames.
[02:45] left-hand side, what we have is the higher time frame or the medium time frame. What we want to see on those time frame itself. And then on the right-hand side, this is the patterns that we want to see
[02:57] happen on the lower time frame. So, once again, these are the confirmation, these are the confluences that we need before we press the buy and sell button. All right. So, all this is is just the
[03:10] confirmation, which means that we need to see this happen first, then we can go this. Now, what is an entry model, right? model? An entry model is a repeatable sequence
[03:24] An entry model is a repeatable sequence of price action you wait for before entering for a trade. So, it should help you answer what needs to happen first, what confirms the setup, where the entry comes in, and
[03:37] where the invalidation is. Which means if this happens, then this trade idea is if this happens, then this trade idea is no longer valid. what we have on right here, right? These are the two
[03:52] sort of like patterns that ideally you want to look out for. All right, so let's start with the first one, right, which is the flip entry model. So, but before I dive into the entry model itself, let me just explain what
[04:04] we have over here. So, over here price went up, pulls back, goes up, pulls back, and then goes up and breaks structure. So, when this control of price, and then this is where we can map this as a swing low and a
[04:17] range in which we want to be focusing on. And in a up uptrend just like this, we want to trade with the trend, which And ideally we want to look for longs at some form of demand zone, right? At some
[04:30] form of demand zone where we have a new higher low to be formed, and we want to want to trade the continuation to the upside just like this. So, this is what we are trying to see. Okay, so this is our trade bias. Our
[04:44] trade bias is telling us that, all right, we got price bullish right now. I to look for longs once price comes down to this demand zone that led to this break of structure right here. And ideally I also want to see some form
[04:58] of liquidity sweep, right? Because like I said, the market needs the fuel in significantly. So, we need that liquidity. left-hand side right here, price went up, pulls back, and then goes up, right?
[05:12] So, it created like this minor internal higher low right here, and below every liquidity. There is going to be available liquidity. So, ideally we want to see price comes down, mitigate this demand zone, sweep that liquidity,
[05:27] create a V-shape reaction, and then at this point in time, right, the minute price touches the zone, this is the patterns that we want to see. Either one of these two patterns right here. Okay, so let's delve
[05:41] deeper into each one. So, the first entry model is the flip entry model. So, if you guys have recalled how to map out your flip zone, it's pretty much the same thing right here. So, you can see in the lower time
[05:53] action right here, this leg right here, what you will see is that lower time creating lower highs, lower lows just to facilitate the pullback. So, in this case, what we want to see in order for price to give us confirmation
[06:08] the upside is that we want to see signs that this pullback is over, the internal structure has shifted from bearish to bullish. form of market shift. That's the
[06:22] for each one of these entry models itself, and that is the market shift. structure has shifted from bearish to bullish, and the pullback is over, and right now the continuation is going to happen.
[06:36] ideally, we want to see the market shift happen in the market itself. So, in this entry model, first thing for us of interest, all right? So, the minute price mitigate the point of
[06:50] down to the lower time frame. Okay, which means that if price is in the middle of nowhere just like this, you do not jump down to the lower time frame. you want to be seeing on either the 4-hour or the 15-minute time frame.
[07:06] And then once price touches your 15-minute demand zone, then you jump down to the 5-minute time frame to look for this particular pattern, to look for this entry confluence, entry confirmation, entry model.
[07:20] Okay, so this is very important, right? Because a lot of you guys are jumping into the lower time frame prematurely, right? You should be only jumping down once price touches your demand zone that is on the 15-minute
[07:34] time frame if you are day trading. Okay? So, ideally, I want to see price So, ideally, I want to see price pullback to my medium time frame point of interest, the 15-minute demand zone, and when it does, I jump down to the
[07:47] 5-minute to look for either one of these confirmation itself. Okay, so let's go back to the entry model. So, this black box that you can medium-term point of interest here. So, you can see the minute price
[07:59] mitigate it, boom, jump down 5-minute, look for this pattern. If the pattern appears in the market, you enter the trade with confidence, with conviction. If the pattern does not appear, then you stay out the market as simple as that.
[08:11] ideally the next thing I want to see is price create a market shift just to confirm to me that the structure is indeed shifting bullish, right? But, in this case, what is price going to use in order to
[08:25] create that market shift? Liquidity. It needs that available liquidity. So, ideally we want to see that sweep the low that was formed right here. Ideally,
[08:37] that we have over here. Okay, so that has to be swept. And if that gets swept, then now we got the fuel that price need to get the market shift to the upside, to, you know, take back control of price from the sellers.
[08:57] price mitigate a demand zone, 15-minute demand zone, and then it led to a market shift. But, before it led to a market shift, it gave us a flip zone. Okay, so is pretty much a zone that caused the opposing zone to fail. So, in this case,
[09:10] price went up, react from this supply zone. If this supply zone were to do its down, take out the last low, creating a new lower low, lower high, just continuing its bearish dynamic, which means that there's a chance for price to
[09:23] just continue bearish. And if price continue bearish and take out this low, entire trend has just reversed from bullish to bearish. holding, then there's still a chance that price will shift bullish.
[09:38] All right, so that's what would happen if this supply zone were to do its job, Because when price actually reacted from this supply zone, it created a failed reaction right here. Which is just a fancy way of saying
[09:51] that, you know, there was insufficient sell orders in down. As a result, the demand has exceeded the supply, the buyers have overwhelmed the sellers, and right now we are pushing to the upside, leaving us
[10:05] a failed reaction, which means that we can mark this entire thing right here as the flip zone. So, now, what does this tell us? This tell us that there was so many buyers in the market
[10:17] that they pretty much kicked all the sellers off the market. How do we know right? Which tell us that there's a shift in structure, shift in order flow, shift in market sentiment. And not only we do we have a market
[10:31] shift, we also have a flip zone, which tell us that there's just insufficient down. So, we pretty much got all the that the buyers have took back control of price.
[10:44] And now, all we do is that we wait for price to pull back to the flip zone right here, and then we make our entry. We enter for our long position the minute price mitigate the flip zone, and then we look to trade the move to the
[10:56] then we look to trade the move to the upside. As simple as that. Okay, as simple as that. That's the flip entry model itself.
[11:08] very classic, it's pretty much my bread and butter entry model, you know, it appears quite commonly in the market itself, and it's quite reliable if you use it with the right context. Okay, so, here's a tip. For this market shift
[11:22] you want to make sure that you wait for price to sweep as much liquidity as humanly possible. All right, so, same thing right here. to see whether you have swept any
[11:35] here. If we swept that liquidity, then nice, it got a fuel that it need to actually move to the upside. All right. So, in this case, price mitigate the 15-minute demand zone, got the liquidity, creating a V-shape reaction
[11:48] telling us that the buyers has took back control of price, buyers have, you know, gain regain control of the market, and then right now we are potentially going minute we got this market shift right here, what I can potentially happen is
[12:00] that we are just going to be doing nothing until price pull back to the demand zone that created that market shift. This is your lower time frame demand zone, right? So, this second black box that you can see right here.
[12:12] This is your 5-minute demand zone, right? So, on the 5-minute time frame, to make sure that you have mapped out a demand zone that created the market And then just wait for price to pull back, react from this demand zone, and
[12:26] then you look for entries to trade it to the upside. As simple as that. entry model. Now, one thing you have to understand is potentially
[12:40] be a false breakout. What I basically mean by that is that sometimes price can come down here, mitigate this demand zone over here, out the last lower high. Okay? So, when this actually happen, we
[12:54] actually got a market shift. But, instead of continuing going up just like this, as a result, price continued going down, taking out this low here.
[13:06] When this happens, what this is essentially telling us is that there was not enough buyers in the market to sustain this move to the upside. In fact, this move to the upside is just
[13:20] sort of like a manipulated move that was created by smart money, by the big banks, by the institutions for price to go up there, grab the available liquidity that was above the lower high, trigger all the stop losses
[13:32] of retail traders who entered for a short position or any other stop orders. liquidity for price to continue going down even further. And perhaps even come down here, grab the available liquidity below this swing
[13:48] low right here before causing price to reverse to the upside. All right, so this is a tip Well, rather want to give to you guys. When you guys are using this entry model, this is the
[14:02] situations that you will see sometimes. Sometimes there's just insufficient liquidity for price to move up just like this. As a result, you need to create more liquidity, grab more liquidity before the real move can actually
[14:15] And if that's the case, what you want to do is to wait for price to create that market shift entry model again. Right, so in this case, when price comes down, break of structure, and this is also
[14:29] So the minute price create a V-shape reaction just like this, taking out the last strong lower high, this is where you got a market shift, and same thing this lower time frame demand zone, and then look for your entry and trade it to
[14:43] then look for your entry and trade it to the upside. All right. So those are the entry models itself. One entry model is more centered around like the fair reaction, you know, like
[14:57] pretty much the shift in sentiment, the shift in order flow. The other entry model is more centered around like the shift in structure. Okay? So both of these entry models, they are designed to stop you from entering too early and to
[15:11] help you wait for the market to reveal more information before you commit. lot of traders tend to make. They see price buy. They don't wait for liquidity sweep.
[15:23] They don't wait for structure shift. They don't wait for fair reaction. They just automatically assume that price is just going to magically go up just because they entered for the big not really big, but like they just
[15:36] position. They think that they are smart money. When in reality, no, that's not the case. All right. So, once again, I can't emphasize this enough, but the context matters so much more than the entry confirmation itself.
[15:50] A clean-looking entry model means nothing if it's forming in the wrong location, in the wrong part of the range, the premium and discount range, or against the higher time frame story.
[16:02] bad trade. Okay. So, it doesn't matter whether you right? You got all the stars in the this trade. But if it's paired with the wrong context,
[16:16] located at the wrong location, taken at the within the wrong timing, it's going to fail. All right. So, context matters as much as the entry model itself. of the many proven entry models that we actually teach inside my mentorship
[16:31] program, 1% Club. Right? So, if you're interested to find more find out more of weapons in the arsenal, you can check out my mentorship program, link in the With that being said, let's go on to the chart and just try to apply these entry
[16:45] going to show you what the entry model looks like on the chart just so that you can like get used to seeing it because it's not as simple as, you know, these Sometimes it just doesn't look like this. Sometimes price can consolidate a
[17:00] little bit and then start shifting bullish. And if that's the case, if you don't understand what the pattern looks like on the chart, you are just going to get lost, confused, and you are just not going to be able to spot it.
[17:19] what do we have? We got price comes down, okay, clear as day, very bearish. How do we know it's bearish? Because price is creating your lower highs and lower lows, lower highs, lower lows. So, in this case, this is the swing high
[17:32] So, right now, our expectation is that if price were to remain bearish, what to maybe come up to this supply zone, the last supply zone at this last lower high right here, react
[17:46] for me and just continue going down. But, in this example right here, what we had was that price was actually pulling back. minute this candlestick was formed over here.
[18:00] All right, let me just show you guys right here. is doing its job. Price come up here to the 50% of this supply zone, some sell orders step into the market causing price to push to the downside.
[18:13] whether it's going to finish its job is another thing. All right, let's just continue to see. Remember, if the sellers were to happen is that price need to continue coming down here taking out this
[18:27] previous weak low, creating a new strong doesn't happen, then that's the first sign that tell us that the market is It's just the first sign, it's not a it's not a definite sign. All right, so
[18:41] later price went up, slowly coming up just like this. You can see. And we have this, this is your failed reaction, buyers has overpowered supply.
[18:53] buyers has overpowered supply. But, we cannot confirm for sure yet. All right, so in this example, you cannot assume that, going to enter for a buy right here." Why not?
[19:05] not enter for a long position right here? confirmation that the structure is indeed shifting bullish. You haven't gotten a market shift. So, what can still potentially happen is
[19:17] that price can pull back to the supply zone, goes down, create a field reaction, maybe it's just coming up here to sweep the liquidity above this high, and then just continue crashing down. All right? Nothing is set in stone yet,
[19:31] since price is still within this range. It has not taken out this low, has not taken out this high, has not taken out the strong high, has not taken out the weak low. Nothing is set in stone yet. So, if price were to continue going
[19:43] that it's bearish. If price were to continue going up, take out this strong All right? So, this part of the time you shouldn't be doing anything. You should just be staying calm, being very patient, and just waiting to see what
[19:57] happens next. All right? Just observe. The minute price come up there and it where it close above the last lower high, this is where you pretty much got your confirmation that price is indeed shifting bullish. Because this is where
[20:10] Okay? The structure has essentially shifted from bearish to bullish. Now we can expect a new high low to be formed somewhere around here and just continue to capture. We are trying to capture this high low.
[20:24] So, the minute this happens, this is where you can draw two zones. All right? go back in time a little bit. Right here, let me just erase those zones and So, in this case, this is the market shift.
[20:37] extreme. All right? So, this is the extreme swing low, and then this is like the new swing high. So, this is where you can draw the extreme demand zone, which is entire range right here. If you are using the range method, if you are
[20:50] using the pivot method, you'll be this candlestick right here, this pivot your extreme demand zone. So, going back to the entry model, if we were to enter at the extreme demand zone, which entry model is it? Well,
[21:04] model, which states that you need to be entering upon the mitigation of a lower time frame point of interest that All right, so that's the extreme demand zone.
[21:17] went up, created a fair reaction right here and case, there is a fair reaction over here, so we can draw this entire range right here as our flip zone. Okay, so this is our flip
[21:31] If you were to refine it to the pivot candle, you'll be somewhere around here. All right, so now we got your flip zone right here and then we also got your So, let's continue to observe what happens next.
[21:46] zone. If you are using this particular entry model itself, this is where you the mitigation of this flip zone itself. Boom, enter for a buy order right here zone and then you will be able to capture this very nice move to the
[22:00] capture this very nice move to the upside before price continue coming down to the extreme zone. Right, extreme zone mitigate extreme zone and then push to the upside. Now, here's a mechanical rule that I
[22:13] have in my system. If something like this occurs, I always enter on the extreme zone rather than the flip zone. Why? Because in this case, if a flip zone is being formed right here, chances
[22:27] liquidity being built up below this fair reaction right here. reaction right here. So, ideally I want to see that get swept and also mitigate this extreme demand zone and then I make my entry from here.
[22:40] that I have in my system. You can test it out, right? Usually what I've seen is that if there's a flip zone and an extreme zone just like this, zone. Not always, depends on the market
[22:55] condition, depends on the amount of fuel the market gets at the flip zone, but yeah, this is just a simple mechanical rule that I have in my system. Right? that's that. Now, I just wanted to show you this example just to show you guys
[23:08] what the entry model looks like in the market itself. Right? This is what you should expect to see. As long as you follow the systematic framework, you should be fine. Right? The systematic framework is, you know what? You got to
[23:21] got to wait for the flip reaction. Then you get a flip entry model. Obviously, after the point of interest mitigation and also the liquidity sweep. And then you got to wait for the market shift, wait for price to pull back to a point
[23:34] of interest that created the market shift, then you look for your entry. All right. So, with that being said, let's look at some more examples. Before I do, let me just fuel with this green tea.
[23:51] is the fuel for the soul. Oh my god, that's deep, man. Oh, oh my god, that's so good, man. Life is good, bro. Life is good, man. Life is good when you're enjoying this Korean green tea that tastes immaculate.
[24:07] >> okay, cool. Now, let's take a look at this example right here next. So, now we are looking at NQ. All right? Once again, market mechanics concept is universal. It works across every single market, every single asset class. It
[24:23] works for futures, works for indices, stocks, commodities, crypto, whatever you are trading that has a chart, it works. All right? Anything and So, let's take a look at this example here. All right? Let's, you know, go up
[24:36] to our medium time frame. All right? So, in this case, medium time frame, I'm going to be looking at it from the lens of like a day trader just like this. All right? So, this is how I'm going to be operating.
[24:48] I'm going to look at the chart of No, maybe should I day trade? Yeah, just to keep things simple. All right? So, higher time frame, medium time this. So, as a day trader, my higher time
[25:02] frame is the 15-minute, and my lower time frame is the 5-minute. So, to keep things simple, I'm going to be using the 15-minute time this example. 15-minute as my medium time frame, 5-minute as my lower time
[25:17] established the fact that price is bullish. How do we know that? Price went up, pulls back, goes up, right? It's getting higher highs, higher lows. And imbalance, a lot of buying momentum, a lot of buying pressure.
[25:31] this entire zone up as your demand zone, right? This entire pivot right here. So, you can also mark this as your swing low and your swing high. we have done our analysis, we have done our research, we have done our
[25:45] preparation. What's the next step? The next step is that we develop our trade idea, which means that we want to look for longs. And ideally, we want to here. Right? Once again, you can even go one
[25:59] premium discount, but there's kind of no use in this case within the premium pricing, right? So, it's very obvious that you need to wait I think it's like the only demand here,
[26:13] anyways. Yeah, so this is like the only demand here. There's another very subtle this is such a small little demand, I wouldn't even consider it. mark up this as like a inducement, right? That's
[26:29] low right here. Right? So, the next step is to develop a trade idea, and we know that we should be looking for long positions at this demand zone right here. But right now, price is over here. So,
[26:42] do we do anything? No, we don't do anything, right? We just wait here, play with our fingers, you know, do what you need to do, just chill until price comes down to our zone. Boom, you can see the minute price
[26:55] touches the zone just like this, right? It touches it. Boom, this is your time frame to look for your entry confluence, to look for your entry confirmation. So, I jump down to the 5-minute time frame
[27:07] confirmation. All right, so once again, price mitigate the point of interest. Right? The minute price mitigate the point of interest, jump down to the lower time frame. That's the first step.
[27:21] price sweep some form of liquidity that during the continuation phase. So, in this case, when price is going up, it pulls back, goes up, pulls back, and then goes up, it give us a lower high, I
[27:34] which means which means there's available liquidity being built up below So, ideally, I want to see that low get swept as well. Right? So, in this case, here. Price came down, sweeping the low below this sweeping the liquidity below
[27:50] creates like a very long wick just like this, and then starts pushing up, right? reaction anytime right now. And in this case, all right? This is where you'll really be able to see that the internal structure is
[28:04] bearish right now. Okay? So, internal structure bearish right here. So, for us to know that the trend is going to shift to bullish, we want to see price take out the last lower high. All right, so where's the last lower high? The last
[28:17] here. Okay, this is the last lower high. We want to see price take that high up. Okay, so in this case, if I want to, you this might be for the scalpers out there. I would jump down to the 1-minute
[28:32] And if I jump down to the 1-minute time frame, this is where things get a lot this is actually the last break of structure. This is also the last break of structure, which means that this right here it's actually the last lower
[28:46] lower high, then this is where we got our market shift. Okay? This is where we got our market shift right here. we just going to stay at a 5-minute time frame for now just to show you the price
[29:01] market shift over here, this is where you want to go and identify the lower time frame demand zone that created this market shift. All the way down here and then started going up creating a V-shape reaction after
[29:14] sweeping the liquidity that we have on the left-hand side right here. So, this zone. All right? Which means that after this market shift, we don't want to enter for the position yet. We want to wait for
[29:27] zone right here. So, we wait. We wait. The minute price you can execute either a manual buy order, or you can place like a limit or here. And then once price step into that area, you get tapped into the trade by
[29:43] your broker. Okay? So, in terms of the stop loss, my idea is always place a stop loss at a price point which invalidate the trade can either place it below this lower time frame demand zone if you're
[29:56] conservative, or if you're aggressive, you might want to even place it below this candlestick that you actually enter the trade from. to test this out. And then for take profit, to keep it simple and mechanical
[30:10] it at 2R. All right? So, sure sure enough, here our fast price just go up there and smash our TP. All right? As simple as All right? So, now, that's pretty much how you use the
[30:23] market shift entry model. It's quite straightforward. You're just waiting for for price to pull back to this demand Now, let's talk about the other entry model, which is the flip entry model.
[30:36] time frame, you will see that there was actually a flip entry model. All right? All right, so when I jump down to the time frame, now I see a few different things. I see that when price was creating this V-shape reaction right
[30:50] here and creating this market shift, there was actually a failed reaction there was actually a failed reaction right here. once again, what happened over over here is that price went up, pulls back
[31:03] is that price went up, pulls back mitigating this supply over here. here, and we have we got a failed reaction before price goes up, which
[31:15] means that this entire range right here becomes our flip zone. All right, if you want to even more precise, you can map out this flip zone. So, when price have
[31:28] mitigated this 15-minute demand zone right here, you jump down to the lower 1-minute, and then this is where you search for entry model. And I do like I swept. This liquidity gets swept right here, we create a V-shape reaction, this
[31:43] buying intent, right? Price is indeed shifting bullish, and it's further backed up by this market shift right here, which tells us that buyers has indeed took back control of price. So, yeah, in this case, like let's just go
[31:56] back a little bit over here, price come out there creating this market shift So, this tells us that the structure is indeed shifting from bearish to bullish. And now, we pretty much got all our criteria, right? We got the liquidity
[32:11] sweep, we got price mitigating this point of interest, we got the failed zone being formed right here, we got our market shift, and now we just do nothing until price pull back to this flip zone itself.
[32:24] As simple as that. All right, so you do nothing, do nothing, all right? stop order right here, instead of entering manually, you place it at the edge of the zone, and then you just do nothing until price
[32:36] comes down here and tap you into the trade. Right, so at this point of time you are tapping into the trade and let's observe what happens next. Okay, so once either place your stop loss below the zone itself, right? Below the flip zone
[32:49] just like this or below the candlestick in which you enter the trade from. Right, and then just set a TP at 2R and you can see you will smash it just very fast just like this. Okay, and then price just continue
[33:02] just absolutely skyrocket. So, that is an example of the flip entry model and also the market shift entry model applied on Nasdaq.
[33:14] Right? I hope you guys have gotten like kind of used to like just identifying these patterns. If not, don't worry. Now let's take a look at a bearish example. Right, we have looked at a bunch of bullish examples. Now let's try to take
[33:26] a look at a bearish example. Okay, so in this case itself, right? This is price on the 15-minute time frame over here.
[33:38] an interesting one. Right, so let's just go back in time a little bit right here. Okay, so right now
[33:50] zoom in at the most recent price action you will see that we are actually bullish right here. Price goes up, pulls back, goes up. We are actually bullish. right here. All right, so right now our expectation
[34:03] bullish. So, if price comes down, mitigates this demand zone right here, you know, this is where perhaps price is going to shift bullish, right here. But in this case, price goes up all the
[34:17] creating your failed reaction, right? Which pretty much does that, you know bullish yet. But we cannot confirm until price take comes down, take out this low right here, giving us a market shift.
[34:31] just like this, which confirmed to you bearish, this is where we know for a fact that swing high, swing low. Right now, where can we
[34:44] expect price to pull back to? Well, in this case, you always draw from the extreme, right? This is the extreme supply zone right here. And is this just an ordinary supply zone? No, it's not because price went up there, pulls back,
[34:56] creating a swing high, generating available liquidity above those highs. high, and then started coming down right here. So, this right here is actually a liquidity sweep, right? So, this is a supply zone that swept liquidity itself.
[35:11] And then later on price comes down, pulls back, goes down, right? You can even map this up as an additional supply zone right here. this demand zone, failed to do its job, creating a fake reaction before going
[35:24] down, which means that this right here is our flip zone. is our flip zone. Okay? This right here is our flip zone. does next, right? Price comes up, mitigate the flip zone, and then go.
[35:38] Okay, so once again, this is just a variation of what the flip zone entry model looks like in a bearish scenario. But I want you guys to pay attention to what happened right here. Okay, so over here, when price mitigate
[35:51] if you go down to the lower time frame, this is where you should be able to see some form of entry model itself. All right? see what happens. Price comes down and then just start
[36:05] crashing down like crazy. Okay. 5-minute time frame, right? So, let's say once again, we're approaching this means that the 15-minute time frame is our medium time frame, and the 5-minute
[36:21] or the 1-minute is our lower time frame. So, over here, 15-minute time frame has confirmed to us that price has shifted bearish. So, we should only be looking shorts? We are looking for shorts either at this flip zone or this supply zone
[36:34] right here. As simple as that. So, once price step into this point of interest here, then I would jump down to the lower time frame, which is the 5-minute time frame to look for my entry model. So, if price is still right here, I'm
[36:47] anything. I'm not doing anything. Boom. Touches this zone, go down to the lower time frame, the 5-minute time frame. And this is where I'm searching for the this flip zone, it's not just an ordinary flip zone. It's a flip zone
[37:00] that sub liquidity. Because price went up, pulls back, goes up, sub liquidity, and then goes down. So, pay attention to the tiny little details, right? The tiny scheme of things. So, in this case, price pull back to
[37:13] this flip zone that sub liquidity. Mitigates it, touches it. Cool. Now, I'm interested. Now, I'm seeing where is the market shift going to happen. Right? Price goes up, pulls back, goes up. Right? This is the last high low,
[37:25] only happen if price take out this low here. continue coming down, creating this market shift. And right now, the minute price create this market shift, our expectation is that price is potentially
[37:39] going to pull back to this supply zone that created this market shift. market shift entry model, right? Where we look for shorts, the minute price all the way down here. But observe what happens next.
[37:53] Price comes all the way down here. There was no pull back whatsoever. So, in this case, what do you do? Well, you don't do anything. this is where
[38:06] if you want to be very strict, very mechanical with your trading system, you have to be okay with letting these trades go sometime. Because sometimes there's just so much liquidity in the market at a specific
[38:18] it does not create that pull back to grab more liquidity. market shift, it's going to pull back to this supply zone, fill up the remaining sell orders, and then continue dumping. But there was already enough liquidity
[38:32] right here. Right? That's why price actually came down. something that we actually teach our students inside the 1% Club, which is itself. This is a little bit more advanced.
[38:45] that you're not using this entry model in every market condition. You're only using it in high probability scenarios where you enter for a sell position the point of interest. But yeah, I'm not going to delve too
[38:58] deep into that. Right? Not going to confuse you. For now, to be strict and mechanical with your trading system, remember, you want to see a price pull look for entry. All right? So let's jump down to the 1-minute time
[39:12] To see whether we can actually have any entry over here. Okay. So this is where it gets a little bit nuanced, right? A little bit If you guys are watching this right now, chances are you might be interested in
[39:26] this advanced sort of concepts. So I'm going to show you like how to really get like those precise entries. So in this case over here, we actually did get a market shift, but it was at a very subtle level. It was at a fractal level.
[39:40] frame, then you can see the market shift. So in this case, price goes up, pulls back creating this bearish candle, and then goes up. Right? So this right here is the last fractal high. Right?
[39:52] The last fractal low. So if price take out this last fractal low, then this is where we got our fractal market shift. Once again, I don't I inside this series because this is just an advanced concept that we teach inside
[40:05] the 1% Club, the mentorship program. But yeah, this is the fractal market shift, which means that this is our extreme supply zone that led to the fractal market shift, and then this is our flip zone, that led to the fractal
[40:18] market shift itself. And again, see what happens that after this flip zone, there was not enough liquidity, right? As a result, price came down, you can see it just did not continue going down even further. As a
[40:31] here to this extreme supply zone, and then go down. And notice what happened before it went down. It swept some liquidity from the fair reaction right reaction, this is the flip zone. It swept the liquidity from the flip zone
[40:45] itself, and then continue going down. This is why I have a mechanical rule that says that if I have a extreme zone and a flip zone at the same area, I do the I only want to enter for a short position at the extreme zone itself.
[40:57] the trade. The minute price mitigate the sweep zone, the extreme zone, extreme supply zone, swept the liquidity from the fair reaction, place the stop loss above this zone itself, or even above the candlestick. You can see this is
[41:10] where things get really like precise, right? If you place it above the candlestick, you are getting like two pip stop loss. Place it above the zone, This is how people get straight to those sniper-like entries itself.
[41:23] funded over and over again, and just get so much payouts, you know, make anywhere so much payouts, you know, make anywhere from 5K to 10K to 20K to 30K to 50K a month using these sniper-like entries right here. They place the stop loss
[41:35] right here. They place the stop loss above this zone itself, and the target can target all the way down here. And you will see the trade still play out perfectly, right? It pretty much play out just just going out very smoothly,
[41:47] sniper-like position. sniper entries, which is a lot more advanced. I don't recommend you guys to the first year of trading. If you're not even profitable at trading, you're much
[42:01] better off sticking to like whatever I've been teaching you for like the past 15 minutes or so, right? Like I said, this is the advanced version of the entry model itself. We teach this inside the mentorship program. So, for now,
[42:14] right? If you want to learn the advanced stuff, you want to learn about all of the nuances in which you can apply these entry models, all the tips and tricks, and the hacks, then yeah, the mentorship program, that's the right place for you.
[42:27] By the ways, in this case, you can see what happens is that price came down, giving me us an internal break of structure, which further validates this that price is indeed bearish. And after this my after this internal break of
[42:41] structure, where did the price pull back to? Price pull back to this level supply zone right here, that swept liquidity. Okay, so this was the new supply zone that swept liquidity itself. Price mitigated that, and then continued
[42:55] collapsing. So, this is where advanced students will try to scale in for another position right here, and capture the next move to the downside. So, now, they not only have one trade running to TP, right?
[43:07] But they have two positions running to TP, right? So, now, the first trade, you know, they had like a 1:8 risk to reward somewhere around here, right? 1:8 risk to reward. The second trade, they have 1:10 risk to reward. Now, they are able
[43:20] to capture a total of 18 R on the trade. What this essentially means is that if you're risking 1% of your account, you have a chance to actually make 80% of right? So, if you're risking $1,000 a trade, guess what? If you win these two
[43:35] trades, you have made $18,000. If you're risking 10K on the trade and in this trade, if you won both of these trades, you have made about 180K.
[43:47] Right, 10K, yeah, 180K. So, that's the power of sniper entries, and this is how we're able to capture these insane entries, 1:5 R, 1:8 R, 1:9 R. bit more advanced. I wouldn't recommend you guys to even like synthesize this,
[44:03] that with you, just to give you like more options as well for my fellow traders who want to take things to the next level. But like I said, these sort of advanced entry models, they don't work all the time. You have to make sure
[44:17] that you are using it in the right market conditions at the right location. Okay, like this sort of advanced aggressive version of the entry model, we teach our students to use it in very specific market condition. You cannot
[44:29] condition, right? You have to use it in very specific market condition at a high into account the timing, you know, the location and all the other variables before you actually enter for the trade. But yeah, I don't want to confuse you
[44:43] for now. Just understand that these are the entry models right here. Your goal is to make sure that you look price mitigate a medium-term point of interest, right? Your goal is not to
[44:57] predict first. Your goal is to react correctly once the model is clear. Once then you react accordingly and you enter for the long or the short position. I'll say I'll just end up by saying that a good entry model is not just about
[45:13] forcing trades, it's about waiting for the market to tell a clear story, then executing with precision. Waiting for the market to give you the signal, then you enter for the trade itself.
[45:26] have the patience to just wait for these entry models to appear in the market at the desired point of interest at a medium-term point of interest, trust me, you will save yourself a lot of unnecessary losses and
[45:40] you will be able to make a lot of money. All right? So, with that being said, I hope you guys have enjoyed this lengthy lesson and as always, remember, you're lesson and as always, remember, you're just one trade away.



⚡ Saved you 0h 45m reading this? Transcribe any YouTube video for free — no signup needed.