
AI Summary
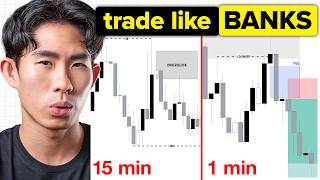
This video presents a five-step framework for trading market reversals, emphasizing the importance of higher time frame narratives, patience, and confirmation over prediction. The trader explains how to identify high-probability reversal zones, observe candlestick momentum, wait for liquidity sweeps, and confirm market shifts before entering trades.
Chapters
Most traders lose money trying to call tops and bottoms to feel like heroes, but the market pays for being right over time, not for heroics.
Buying the exact bottom or selling the exact top is usually ego, not skill. Most traders get wiped out predicting reversals too early.
Before trading reversals, understand the market context: who controls price (buyers or sellers) and the overall sentiment. This determines institutional flow.
Price eventually pulls back to fair value. In a downtrend, expect short-term pullbacks to create lower highs before continuing down.
Price testing a level twice and failing indicates an institutional level with significant buy or sell orders, a high-probability reversal zone.
Avoid trading reversals in the middle of nowhere. Focus on supply and demand zones where sufficient orders exist to shift price.
Wait for price to reach the supply or demand zone. Do not act prematurely; patience is key.
Watch candlesticks near the zone. Smaller candles and dojis signal loss of momentum and potential reversal, but they are not confirmation.
An upper wick at a supply zone shows buyers failed to close higher, indicating selling pressure and potential reversal.
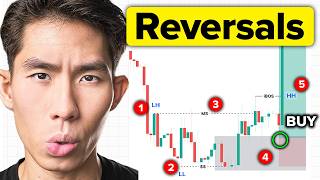
Reversals require a liquidity sweep—a sharp V-shaped move that takes out a structural low or high. Without it, no reversal.
After a liquidity sweep, a market shift (breaking the last higher low or lower high) confirms the reversal. This is the entry trigger.
The trader shares a recent trade on EUR/USD that made $264,000 using this framework, emphasizing preparation and risk management.
Reversals often occur around London and New York session opens. Prepare before these sessions to capitalize on institutional activity.
Avoid predicting reversals too early. Confuse slowing momentum with confirmation, ignore higher time frame narrative, or enter before liquidity sweeps—these lead to losses.
Successful reversal trading is about patience and process, not prediction. By following the five-step framework—identify narrative, wait for zones, observe candles, wait for liquidity sweep, and confirm market shift—traders can trade reversals with structure and discipline.
Mentioned in this Video
Tutorial Checklist
Study Flashcards (8)
What is the main reason most traders lose money trading reversals?
easy
Click to reveal answer
What is the main reason most traders lose money trading reversals?
They try to predict tops and bottoms too early, driven by ego rather than skill.
00:02
What is the first step in the reversal trading framework?
easy
Click to reveal answer
What is the first step in the reversal trading framework?
Identify the higher time frame narrative: who controls price and overall sentiment.
02:09
What does a liquidity sweep indicate?
medium
Click to reveal answer
What does a liquidity sweep indicate?
A sharp V-shaped move that takes out a structural low or high, signaling that smart money has used liquidity to shift the trend.
12:08
What is a market shift in this context?
medium
Click to reveal answer
What is a market shift in this context?
Breaking the last higher low (in a downtrend) or last lower high (in an uptrend), confirming the reversal.
15:05
Why should you wait for a liquidity sweep before entering a reversal trade?
medium
Click to reveal answer
Why should you wait for a liquidity sweep before entering a reversal trade?
Because reversals cannot happen without a liquidity sweep; entering before it often results in being stopped out.
13:58
What does an upper wick at a supply zone indicate?
medium
Click to reveal answer
What does an upper wick at a supply zone indicate?
Buyers failed to close at that price, showing selling pressure and potential reversal.
10:05
When do reversals often occur according to the trader?
easy
Click to reveal answer
When do reversals often occur according to the trader?
Around the opening of London or New York sessions, often a few minutes before or at the open.
23:14
What is the trader's warning about slowing momentum?
medium
Click to reveal answer
What is the trader's warning about slowing momentum?
Do not confuse slowing momentum (smaller candles, dojis) with actual confirmation; it is only a signal, not a guarantee.
25:18
💡 Key Takeaways
Market Pays for Consistency, Not Heroics
Reframes trading success as a long-term probability game rather than a quest for perfect entries.
00:16Institutional Levels as Reversal Zones
Explains how repeated tests of a level reveal institutional order flow, a key concept for high-probability trading.
04:05If You Can't Spot Liquidity, You Are the Liquidity
A memorable warning that traders who ignore liquidity concepts become the exit liquidity for smart money.
13:58Money Is Made in Preparation, Not Execution
Emphasizes that trading success comes from pre-trade planning and post-trade review, not the click itself.
22:32Session Timing for Reversals
Provides a practical, actionable tip: reversals often align with London/New York session opens.
23:14Full Transcript
[00:02] a bad strategy, but because they're trying to be a hero. They want to call tops and bottoms, catch the perfect reversal, get that insane sniper entry, predict the next market crash, and feel like a genius.
[00:16] But here's the thing, the market doesn't pay you to be a hero. It pays you for being right often enough over time. And this is exactly why most traders get destroyed trading reversals. Cuz let's be honest, all of us love the ideal of
[00:31] buying the exact bottom and selling the exact top. But most of the time, that's not skill talking, that's just your ego talking. Most traders get wiped out because they try to predict the top or the bottom way too early. They see price
[00:46] getting extended, they assume that it has to reverse, and then they jump in before the market has actually confirmed anything. So, in this video, I'm going to show you how to trade reversals properly. Not based on hope, not based
[00:58] on guessing, not based on lagging indicators like the moving average or Bollinger Bands or whatever BS, and definitely not based on some random candlestick or chart pattern. I'm going to break down the exact framework that I
[01:12] personally use to identify high probability reversals, understand higher time frame narrative, read price action properly, and wait for real confirmation
[01:24] I've been trading for 7 years. Last month alone, I made nearly $1 million in trading profits with every single trade documented live on my second channel, Club, which is a mentorship program that's helped hundreds of students
[01:39] become funded traders, and I'm also the founder of Edge Flow, the trading app that I personally use to plan, execute, journal, and review my trades, which has already helped hundreds of traders execute with more discipline and
[01:53] structure. So, quite simply put, I don't want your money. I want you to become a Now that you know who I am, let's get straight into it. Now, before you can even think about identifying reversals, you must understand the objective of
[02:09] price right now. What is the market doing right now? Who's in control of price? The sellers or the buyers? And what is the overall sentiment of the market right now? Those are the questions that you must constantly ask
[02:23] yourself to figure out the higher time frame narrative because that determines the institutional flow of money, which is what we want to be trading with. So, to put it in English, basically, what you want to do is to identify the
[02:35] you want to do is to identify the overall market context, the overall higher time frame trend direction before you can even think about trading reversals. So, if I'm looking at a market just like this on NQ, Nasdaq, you
[02:48] can see that right now it's very obvious that the sellers are in control of price, right? Price is heavily bearish. You know, price has just been collapsing for the past few hours or so. So, ideally, I want to actually look for
[03:01] shorts. But the thing is, you must understand that whatever goes up will eventually come down. When price keep on going up, eventually it will start pulling back to fair value. It's the same as that concept when the market is
[03:13] in a downtrend. If the market keep on going down, eventually there's going to be some demand, eventually there's going to be some buyers that cause price to start going up and start to pull back. So, this is where we can potentially
[03:25] So, this is where we can potentially expect price to reverse, maybe make like a short-term pullback just like this to create like a new lower high for price to continue going down even further. Right? So, if I'm looking at this chart
[03:37] price will do next. Since price has essentially lost momentum right here, down anymore. It started pausing over here, and it started creating this swing low, and then later on it came down creating this another swing low, and it
[03:51] started to reversing. Right, so price has literally tested this area right here twice. Okay, first here failed to take out that level, second time again failed to take out that level again, which signaled to us that this $24,000
[04:05] level right here is a institutional level where there's a lot of buy orders. There's a lot of demand. So right now, since there's not enough selling pressure, not enough selling momentum in the market, we can expect price to
[04:18] actually start pushing to the upside. Okay, so in this particular case, you can see price is potentially pulling back and this is where you can try to identify where price is going to pull back to. Right, so you can just map out
[04:31] the left-hand side right here. Right, so there's a supply zone right here, there's another supply zone right here, and then there's also another supply zone right here. So our hypothesis right now is that
[04:43] right now price is heavily bearish and it's just shifting bullish in the short-term to facilitate the pull back into any one of these supply zone. this supply zone right here, we can expect price to reverse and just
[04:59] continue with the higher time frame downtrend. That's our hypothesis. So at this point of time, I'm just going to be doing nothing until price mitigate each actually mitigate each one of this zone,
[05:14] paying attention to what price is doing to see whether it actually give me the confirmation that I need to short the market down. So that's how you want to be trading reversals. You don't want to try to
[05:28] predict reversals all the time in the market. You only want to focus on the reversals that actually matter, which more often than not is going to be at some form of supply or demand zone. So basically what we are doing right here
[05:40] is that we are trying to understand where price is likely moving toward and whether the reversal makes sense there or not. So, once again, you don't want to try to trade reversals in the middle of nowhere. Like for example, right
[05:53] here, you don't want to enter for a sell right here, because this is price being in the middle of nowhere. So, it's incredibly low probability. There's a very low chance that price will reverse right here compared to
[06:05] because this is actually where there is going to be sufficient sell orders that can allow price to shift in the trend direction in the short term. So, that's identify the higher time frame narrative, develop your daily bias, and
[06:21] to just determine where price is moving towards next, so that you can pay attention to those point of interest that actually matter, where we can actually matter. Which brings us to step two, right? So, step two, do nothing.
[06:36] Just wait for price to reach the supply zone. Okay, so as you watch price reach the supply zone, I want you to pay attention to the candlesticks that is being formed near the zone itself. Okay, so once again, you don't want to do
[06:51] anything until price reach some form of zones just like this. And then the minute price actually reach the zone, you want to pay attention to the candlestick momentum and pressure. That is step three. Okay? So,
[07:07] time frame bias, right? Just try to identify the higher time frame narrative. Step two, do nothing and wait for price to mitigate a supply and for price to mitigate a supply and demand zone. Step three is to observe
[07:21] the candlestick momentum and pressure. This will give you all the signs you need to know whether price is actually going to reverse right here or not, or is it just going to continue to just move up even further and just blast
[07:36] The answer lies in the candlesticks that's being formed. Now, what does reversal means? Reversal basically means that at some point in time, the buyers has overwhelmed the sellers or the sellers has overwhelmed the buyers and
[07:52] it caused the prevailing trend to actually change from bullish to bearish or to bearish to bullish. That's what reversal essentially means. It basically means a shift in the trend direction. So, when we are observing the
[08:06] candlestick momentum and pressure, what we want to see is a shift in sentiment, a shift in trend direction. What we want to see is whether the candlesticks are actually changing at the point of interest right here because that could
[08:22] signal the changing of hands between the sellers and the buyers. Okay, so what you want to see is the candlesticks to start getting smaller and smaller as price enters the zone because that signal to us that what is going on right
[08:38] now is that the buyers are losing momentum. There is not enough buy orders in the market for price to continue bullish. So, as a result, this is where stepping to the market at this point of interest to short the market down and
[08:54] just take back control of the market and cause price to move to the downside. So, like what's going on right here. So, obviously price has blast right through this point of interest over here. You can see when price actually mitigated
[09:08] this first supply zone that we have marked up, there was not enough selling pressure right here. Okay, still there is a lot of bullish momentum, big fat juicy candlestick right here, big bullish candlestick
[09:22] further. And then next thing you know, price has blast right through it. So, like I said, candlesticks are literally everything. They tell you all the story time, this point of interest has already been disrespected, price just absolutely
[09:37] demolish it and just blush right through it so you can just get rid of that. Now, supply zone that we have marked up right here. Okay, let's once again pay this point of time you can see what happens that there's a big bullish
[09:51] candlestick, but the minute price actually mitigate this supply zone what we saw was that there was this upper wick being formed right here. What this upper wick tell us is that at some point in time
[10:05] the buyers tried price all the way up here this 24840 level right here, but they failed to do so. The candlestick failed to close at that price point. As a result, the sellers actually step into the market at this supply zone and cause
[10:19] price to come all the way down, push price all the way down and it ended up closing at this 24.8k level right here. Which pretty much indicate that there is indeed sell orders within this point of interest. There is indeed selling
[10:32] pressure, selling momentum at this point of interest. And then let's look at the next candlestick right here. It's followed by a doji candlestick just like this which signals indecision in the market. So this is potentially the next
[10:47] we are about to reverse." Because you can see this candlestick that is long upper wick, long lower wick, and then there's like a small candlestick body are that are playing this tug-of-war right now and they are at a stalemate.
[11:02] Nobody is winning, nobody is losing. They are just at a stalemate. So at any point of time right now, what can potentially happen is that if there is enough sell orders in the market, it's going to cause price to start dumping.
[11:15] But with that said, like I said, this signals indecision. It does not affirm that price is going to reverse straight away. Because what can happen also is that the buyers can still end up gaining back control of price and price can just
[11:29] continue going up as well. Okay, so this is where it's important for you to is doing next. Right, so as a result right here, you can see bearish candlestick over here at this supply zone. So, this is where we kind of know
[11:42] that potentially what can happen is that price can start shifting bearish a little bit. Okay, once again, these are just signs that the market is potentially reversing. It's not a confirmation, it is just signs. It is
[11:56] just signals. Now, let's continue to observe what price does next. Right, so observe what price does next. Right, so as you can nothing actually happen until
[12:08] it starts coming down and take out the last structural low right here, which brings us to the next step, which is to wait for some form of liquidity sweep. You must understand that it requires a lot a lot of money for price to break a
[12:22] strong structure. What I basically means by that is that in a bullish internal outflow just like this, when price goes up, pulls back, create a higher low, and then goes up, pulls back, and then goes up just like this,
[12:36] it requires a lot a lot of money, a lot of sell orders for price to come down of sell orders for price to come down and take out the last strong low at this Because when that happens, this is our market shift and this tells us that the
[12:50] market is reversing. But, it also tells us that at this point in time, there's a lot of sell orders in the market. So much sell orders that price actually took out strong structure. A liquidity sweep is usually like a very sharp
[13:04] V-shaped reaction, where the market go out fast and come in fast. Right, so the V-shaped reaction reversal, this indicate to us that there is some form of liquidity sweep. Once again, this is more of like a advanced sort of concept,
[13:19] which I've covered a lot in my YouTube videos. So, if you don't understand this, please go and check out those other liquidity concepts videos. But for entire liquidity concept. I'm just going to tell you that in this particular
[13:31] case, there was liquidity sweep because price actually went up there, pulled back, created like a inducement right here at this swing high. Guess what? That is available liquidity. Later on, price went up there, swept the liquidity
[13:44] above that high, started reversing. Same thing, there's also some liquidity right here above this lower high here as well. So, this pretty much was another could potentially happen. Right? Because reversals tends to happen after the
[13:58] market grabs liquidity. Remember that. Write that down somewhere. Reversal cannot happen unless there is liquidity sweep. And this is the step where a lot of traders miss. Because a lot of traders think that, "Oh, I might thought
[14:12] this supply zone right here. So, the minute price actually mitigate this supply zone somewhere around here, I'm just going to happily enter for a sell. Or maybe I wait for my doji candlestick right here. After all, the candlestick
[14:25] pattern cannot be wrong, right?" Okay. So, good old John has decided to enter for a sell right here and place the stop loss above this high right here before the liquidity has been swept. And as a result, John gets
[14:38] stopped out and he become the liquidity instead. All because he doesn't understand market mechanics. flow. All because he doesn't understand liquidity concepts. Remember, if you
[14:52] cannot spot the liquidity, then my friend, you are the liquidity. So, do not forget to wait for step four, which is wait for the damn liquidity sweep. And that brings us to step five, right? So, after you get a liquidity sweep,
[15:05] what you want to see is a structural shift, a market shift to indicate to us that, "Yes, smart money has indeed used the liquidity to cause the entire trend direction to shift bearish." So, like I
[15:21] said earlier on, this is the last higher low, right? Because this is the last internal break of structure right here, which makes this the last higher low. the last higher low, what we do have is a market shift.
[15:37] Which signal to us that the sellers has officially took control of price. The sellers have officially kicked the buyers out of the arena. The order flow
[15:49] buyers out of the arena. The order flow has essentially changed from demand to supply. So, that is step five. It's to wait for some form of market shift. Because when you get that, that is the confirmation you need that price has
[16:04] officially shifted bearish, and right Okay, so let's just continue to play price forward and see what price does, like a little pullback just like this, and then started reversing, and it went
[16:18] all the way up here. Okay, so in this case, you can see after the market pullback to like somewhere around here, right? Which is this demand zone right here on the 15-minute timeframe as well. And once again, this is an opportunity
[16:33] for you to apply the five steps that I've just covered right here. Okay, that is essentially how you look for reversals. You need all five steps. You cannot just miss one step itself. Now, as you can see, what happens is that as
[16:47] price started shifting bearish right here after the market shift is formed, it came down to this next 15-minute demand zone. And when it came down to like a 15-minute demand zone right here, we can expect some form of demand to
[16:59] reverse. And once again, you want to what the market is trying to tell you. Pay attention to the candlesticks that is being formed as it approach this demand zone. Because if you look at
[17:12] start to see that the bearish momentum start fading away, right? the sellers are starting to exit the arena because the buyers are coming to the market and just pushing them out. Right, the buyers are taking back control of price right
[17:27] here. Guess what? We have next we got a good old liquidity shift right here. getting smaller and smaller and started consolidating right here which signal a
[17:39] loss of selling momentum, selling pressure and then that is followed by a came down and shift the liquidity below this low right here. And then later on price went up there and take out the last lower high giving
[17:54] us a market shift which tells us that the market is once again about to reverse. Right, so you can literally see me just apply those five steps in like under five minutes because it's really just as
[18:07] simple as that because I fundamentally believe that a simple framework is repeatable. That means it's scalable which means it's profitable. So those are the five steps you need to actually identify and trade reverses. So with
[18:21] through a live trade breakdown right now. So this was literally a trade that I've taken yesterday. I you not, I literally just took this yesterday and I made about $264,000 on this trade itself and it's all using
[18:36] this exact framework that I just showed you. You can see this was pretty much my trade plan that I follow, my trade management method, my mistakes, my entry and exit emotion and my reflection. Everything is on a screen right now for
[18:49] transparency purposes. Once again, this is actually on my seven surprised by the the huge lots right here because this is still around 1% of my account. So now let me just quickly explain like how I pretty much apply
[19:03] this five step framework into this particular trade itself. So I was pretty much analyzing EU yesterday during the London session. You know, I did all my chart markups to prepare my charts for success. So, I know exactly where to
[19:17] actually enter for the trade, where to sell. Right? So, this is where I determine the higher time frame bias, and I knew that price was actually bearish. Okay? So, clear as day, price is bearish. This is the 15-minute swing
[19:29] high, 15-minute swing low, and this is the range we were playing within. And I also mapped out a premium discount because ideally I want price to come up to like my premium pricing, some form of supply zone that is within this premium
[19:41] pricing itself. And I mapped out the point of interest. Like I said, the goal for step one is to identify your higher time frame narrative, identify your higher time frame bias. And then also use it to map out your point of
[19:54] interest, map out your supply and demand zone. So, in this case, that is exactly what I did today. Price is bearish, swing structure is bearish right now. That means we are waiting for price to come up to a certain supply zone. As
[20:07] simple as that. Then the step two is to like just wait for price to actually Right? So, in this particular case, there was two supply zones I've marked up. In this case, price did not went up to the extreme supply zone. Instead, it
[20:21] went up to this supply zone right here. So, the minute price actually mitigated this supply zone, this is where I started to get a little bit interested, actually giving me, what the market was actually showing. And this is where you
[20:34] can see that there was clear as day like a liquidity sweep followed by a fractal market shift which tells us that the market is potentially going to reverse. confirmation that okay, price is officially reversing. And then the
[20:47] following day during the London session, around 30 minutes before London session, this is where I saw my opportunity for me to actually enter for this trade, for me to like just capitalize on this entire reversal itself. So, after the
[21:00] market shift, all I did was that I just mapped out the lower time frame point of interest, the lower time frame supply zone that led to the fractal market shift, and I do nothing until price actually mitigated a supply zone. The
[21:13] right here, guess what? I'm looking for my confluences. I'm looking for my liquidity sweep. I already got my market shift right here, so I don't have to get a market shift again, and I'm looking
[21:26] for some form of confirmation in terms of the candlesticks to tell me that the market is about to reverse. So, in this particular case, what we have was that the minute price actually reacted from this zone, we got a doji candlestick,
[21:38] once again, just signaling indecision in the market, followed by a bearish another bearish candlestick, which signaled to us that there is indeed a the market right now, and this is where I entered for the trade somewhere right
[21:53] in my way. Instead, what happened was that price actually did like a little pullback, so I was in a little bit of drawdown, but because I placed my stop loss at the right price point, which is a few pips above this high right here, I
[22:06] did not get stopped out. I did not become the victim of faking liquidity, and then, luckily, price actually reversed and hit down all the way and smashed my TP right here at the next demand zone, where I'm expecting the
[22:19] next reversal to happen. Right, so this was a very simple bread and butter was a very simple bread and butter setup, and made me 264K. And I can tell you right now that the money is not made in clicking the buy and sell button. The
[22:32] money is made in the preparation. It's made in what you do before you start trading. How you map out your charts, how you develop your bias, what confluences are you looking for, how you manage your risk,
[22:45] and it's also made after you're done trading, right? In your journaling, in your reviewing, in your reflecting, in thinking about how you can actually refine your strategy and make it even better based on data. All right, with
[22:59] that being said, since you're still watching this video right here, I think you deserve a bonus tip. So, here's a bonus tip. Listen up. Timing matters. Reversals often happen around the opening of London on New York session.
[23:14] So, in this particular case, guess when the market actually reversed. This was literally just right when the market is actually open. Right? So, around 15 minutes before London session actually open,
[23:29] the market actually reversed and start heading down. And then, let's look at another example, right? So, maybe this is another example. So, this was during the New York session. Price was going up before New York session, started coming
[23:42] down. Right before New York session, the market start reversing. Or during the again. So, that's like a little tip that you can actually use. The reversal tends to form either a few minutes before the
[23:56] form either a few minutes before the session opens or when the session opens. kicking in, the institutions start trading, start dumping their big buy and sell orders. So, you want to make sure that you're able to capitalize on this
[24:10] huge reversal move by ensuring that you are well prepared by ensuring that you are well prepared before the session opens. Before the London on New York session open, you want to sit down, do step one to step
[24:24] point of interest, identify a trend direction, determine which one of reversals. So, basically, in order to catch sniper entries, what you want to catch sniper entries, what you want to do is to combine timing with location
[24:40] do is to combine timing with location with liquidity and structure. If you have all of these aligned, I can triple guarantee you'll make a lot of money in the market, you will get sniper entries, and
[24:53] this market. So, with that being said, I'm just going to end off this video by just telling you guys exactly when not to trade. It's important to know when to trade, when to spot these reversals, but it's even more important to know when to
[25:06] stay off the market so that you can avoid the unnecessary losses. Please, ladies and gentlemen, for the love of God, do not try to predict the reversal too early. Like I said, you want to wait for the confirmation, you want to wait
[25:18] wait for the market shift. You don't want to confuse slow momentum with actual confirmation. Just because the candlesticks are getting smaller, just because there's a doji candlestick just like this, does not necessarily
[25:32] straight away. So, if you were actually hoping that that actually happens, then my friend, you are going to be in for a surprise a happened right here, you got a doji candlestick, but there was not enough
[25:47] went up there, swept the liquidity before the real move actually happens. So, do not confuse slowing momentum with actual confirmation. And also, do not ignore the higher time frame narrative. The only reason why
[26:01] the fact that the higher time frame is bearish as well. order flow is bearish, everything is aligned. That is what allowed this trade to actually play out so nicely. Entering before liquidities get swept,
[26:16] like I said, if you do not spot liquidity, then you will become the liquidity. And last but not least, one thing to be a hero instead of following a process. So, stop trading your ego and start trading price. So, if you are to
[26:31] trade reversals is probably stop trying to predict the exact top or bottom just to feed your ego. Stop trading your pride and start trading price. Start wait for price to reach a supply and demand zone, observe the candlestick
[26:45] momentum and pressure, let liquidity get swept, wait for the market shift, and then enter on confirmation. And that, my friend, is how you stop forcing reversals and start trading them with
[26:59] actual structure. Because, remember, at the end of the day, the traders who win with reversals are not the ones trying to look the smartest, not the ones trying to predict the exact top or bottom. They are simply the ones patient
[27:13] enough to let the market confirm everything first. So, if you want to learn more about market mechanics, how to think and trade like big banks and professional traders, check out this playlist right here. And as always,
[27:25] remember, you're just one trade away. Mwah.