What is Candle Range Theory?
60sClear, concise explanation of a trading concept with visual hook, appealing to traders seeking edge.
▶ Play Clip"Delivers a solid, practical breakdown of CRT with real chart examples, though the sponsor segment and repetitive explanations add some padding."
This video explains the Candle Range Theory (CRT) trading model, a concept that uses the high and low of a single candlestick as key liquidity levels. The presenter simplifies the model, demonstrates how to identify setups on charts, and reveals a trend-following CRT strategy that combines candlestick ranges with smart money concepts like fair value gaps and premium/discount zones.
CRT is a trading concept that focuses on the price range (high to low) of a single candlestick. Each candle represents a trading range, and its high and low often act as turning points on lower time frames, forming important liquidity levels.
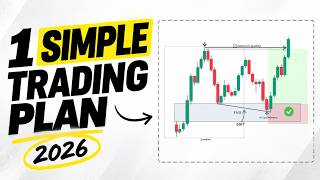
The typical CRT strategy involves three candles: the first defines the range, the second creates the sweep, and the third provides the entry. The high is called the candle range high (CRH) and the low is the candle range low (CRL).
If the second candle attacks liquidity above the CRH and immediately reverses, there's a high probability the next target will be the liquidity below the CRL. If the second candle closes above the CRH, the setup is invalidated.
A common approach is to apply CRT to the 1-hour candle just before the New York session opens. The NY session often sweeps London liquidity and reverses, creating high-probability setups.
To trade with the trend, wait for a clear uptrend or downtrend and a correction. Apply CRT only to bearish candles in an uptrend (or bullish candles in a downtrend). A valid setup occurs when a candle sweeps beyond the range but closes back inside.
Instead of entering immediately after the sweep candle closes, zoom into a lower time frame (e.g., 5-minute or 15-minute) and wait for a fair value gap (FVG) to form after the sweep. Place the entry at the FVG and set the stop loss beyond it.
Close half the position at a 1:1 risk-to-reward ratio to make the trade risk-free. Let the remaining half run toward the next strong level or liquidity zone.
In a downtrend, wait for a correction into a premium zone before applying CRT. This combines trend direction, manipulation, and entry from a premium/discount zone for a high-probability setup.
Avoid trading CRT in choppy markets, entering too early without a proper sweep and close back inside the range, and ignoring market context such as news releases or higher time frame levels.
The presenter backtests EUR/USD on the 1-hour chart, applying CRT to bearish candles in an uptrend. Entries are taken on 5-minute FVGs, with partial profits at 1:1 and the rest running. One trade ended break-even after hitting stop loss, but the half-close saved the account.
Candle Range Theory is a powerful liquidity-based model that can be adapted to trade with the trend by combining candlestick ranges with fair value gaps and premium/discount zones. Proper execution requires patience for valid sweeps and disciplined risk management.
What does CRT stand for and what does it focus on?
Candle Range Theory. It focuses on the price range (high to low) of a single candlestick.
00:31
What are the roles of the three candles in a typical CRT setup?
The first candle defines the range, the second creates the sweep, and the third provides the entry.
01:13
What is the candle range high (CRH) and candle range low (CRL)?
CRH is the upper liquidity level (the high of the candle), and CRL is the lower liquidity level (the low of the candle).
02:06
What happens if the second candle closes above the CRH?
The potential CRT setup becomes invalid because it's more likely the market will continue pushing upward rather than targeting the low of the range.
02:58
Why is the 1-hour candle before the New York session popular for CRT?
The New York session is known for strong reversal movements, often sweeping London liquidity and then reversing, creating high-probability setups.
03:39
How do you apply CRT to trade with the trend?
Wait for a correction in a trending market, then apply CRT only to bearish candles in an uptrend (or bullish in downtrend). A valid setup occurs when a candle sweeps beyond the range but closes back inside.
05:02
What is the entry optimization technique mentioned in the video?
Zoom into a lower time frame and wait for a fair value gap (FVG) to form after the sweep, then place the entry at that level.
06:12
What is the risk management rule for taking partial profits?
Close half the position at a 1:1 risk-to-reward ratio to make the trade risk-free, then let the rest run.
06:39
What are three common mistakes traders make with CRT?
Trading in choppy markets, entering too early without a proper sweep and close back inside the range, and ignoring market context like news or higher time frame levels.
09:10
CRT Definition
Provides the foundational concept that each candle's range acts as a liquidity map.
00:31Three-Candle Structure
Simplifies the model into a clear, actionable sequence.
01:13Liquidity Sweep Logic
Explains the psychological mechanism behind sweeps and reversals.
02:20Trend-Following Adaptation
Shows how to align CRT with the trend, increasing confidence and probability.
04:48Risk-Free Trade Management
Demonstrates a practical method to protect capital while letting profits run.
06:39[00:01] trading model. However, some traders make it complicated and confusing when it comes to actual trading. So, in this video, we'll simplify the CRT trading model, explain the reasoning behind it, show you how to spot it
[00:15] correctly on the chart, and reveal the best CRT trading strategy. So, guys, if smash the like button to show your support, and let's get started. So what exactly is the candle range theory?
[00:31] Candle range theory or CRT is a trading concept that focuses on the price range high to low of a single candlestick on the chart. The general idea behind this model is that each candle represents a trading range. If you break this candle
[00:45] down into lower time frame candles, you'll notice that the high and low of the candle often act as turning points on the lower time frame. These points form the most important liquidity levels. The highest and lowest
[00:59] price traded during the previous trading period. This period can be a day, a week, or even a one minute candlestick. So, let me show you how combining this single candle structure with smart money concepts can offer high probability
[01:13] trading opportunities. The typical concept of this strategy usually involves three candles and each candle has its own important role. The first candle defines the range. The second candle creates the sweep. The
[01:26] third candle provides the entry. Let's break this down step by step as a concept. Starting with the first candle, the candle range theory suggests that every candle's high and low act as the most important liquidity levels that the
[01:40] following candles will use as targets. The reason is that if you break this candle down into lower time frame candles, you'll notice that the high and low of the candle often act as turning points on the lower time frame.
[01:53] For the daily candlestick, these turning points are the highest and lowest traded price during that day, which emphasizes the importance of these prices. So without analyzing the lower time frames, we can identify where important
[02:06] liquidity levels are just by observing a single candlestick. The upper liquidity level is called the candle range high CR and the lower liquidity level is called the candle range low CRL.
[02:20] We can use any candle that appears on a chart and this applies to any time frame chart and this applies to any time frame as well. However, certain criteria help us define what makes a candle ideal to use, which we'll be covering later in
[02:32] the video. Now, if the second candle attacks the liquidity above the candle range high and immediately reverses, there's a high probability that the next target will be the liquidity below the candle range low.
[02:45] In other words, this liquidity sweep from the CR suggests that the market is likely to shift direction and seek out liquidity resting at the opposite end of the range. If instead we see the second candle
[02:58] close above the CR, then the potential candle range theory setup becomes This is because it's more likely that the market will continue pushing upward rather than targeting the low of the
[03:10] first candle's range. However, if the criteria are met and the second candle fails to close above the candle range high, we can then look to the third candle for a potential short setup with our target being the candle range low.
[03:25] Now that was just the general idea and reasoning behind candle range theory. Let's move on to the actual rules and break down how to trade it step by step on the chart. Now the first question is which candle
[03:39] should you choose to apply the candle range theory. If you've studied this topic, you'll know that one of the most popular approaches among traders is to focus on the 1-hour candle just before the New York session opens. Why? Because
[03:53] the New York session is known for its strong reversal movements, especially right after the open. Typically, it starts by sweeping the liquidity built up during the London session and then often reverses direction. This makes it
[04:07] a great trading opportunity. So, here's a smart approach. Apply the CRT model to the 1-hour candle before the New York open. If the price sweeps liquidity beyond that candle's range and then returns back inside it, you're
[04:21] witnessing a setup that aligns both with CRT principles and the natural behavior of the New York session. This confluence can provide high probability trade setups, especially if you're timing your entries correctly and managing risk with
[04:35] precision. However, there is only one problem with this approach. We are trading against the trend. Trading alongside the trend gives us more confidence and better high probability setups.
[04:48] So, is there any way to use CRT while following the market direction? The answer is yes. We have developed a trading setup that works with the trend and still follows the CRT idea. Let me show you how it works.
[05:02] First, we want to see a market that is clearly trending up or down. Then we wait for a correction because that gives us a better price to enter and a safe place to put our stop loss. Let's say the latest impulsive move started from
[05:15] this point and went all the way up to here. We expect the correction to happen inside this range. From here, we start using the CRT model, but only on bearish candles. Since the market is in an uptrend, we mark the high and low of
[05:30] each bearish candle and then watch how the next candle reacts. If the next candle breaks below and closes under the range, the setup is invalid and we don't take a trade. Then we move to the next bearish candle and do the same. This
[05:43] continues until we see a candle that sweeps below the low but then closes back inside the range. That's when we have a valid setup. We now have both the range and the sweep. Now the question is where do we enter?
[05:58] One simple way is to open a buy position right after the sweep candle closes. But there's a better and more optimized way. We can zoom into a lower time frame to find a more accurate entry. For example, if we are on the 1 hour chart, we can go
[06:12] down to the 5 minute or 15minut chart. On the lower time frame, we can see more details. In this strategy, we use the fair value gaps that appear after the sweep as our entry zone. So, all we need
[06:25] to do is wait for a fair value gap to form and then place our buy order at that level. We put the stop loss below the gap. For targets, we can make the trade risk-free by closing half of our position when the
[06:39] price reaches a one:1 risk-to-reward level. That way, even if the price reverses later and hits our stop-loss, we don't lose any money. For the rest of the trade, we let the profit run until the price reaches a strong level ahead.
[06:54] Since this is a trend continuation setup, this combination gives us a powerful and smart way to trade CRT, but this time with the direction of the market. Now, let's have a recap of the bearish
[07:07] scenario, but this time include the discount and premium concepts. But before we continue, if you want to get a funded account quickly, check out Funded Next's new stellar instant plan, which does not require a challenge phase.
[07:21] That's right. You get instant access to trading capital from day one. There is no daily draw down limit, no minimum trading days, and you can withdraw profits anytime. The best part, make just 10% and funded next doubles your
[07:34] account. They also offer plenty of other plans ranging from $5,000 to $200,000 accounts. And finally, some of the best offers if you are a futures trader. If that's something you're interested in,
[07:47] check out the link in the description. This time, we're adding the concept of the premium and discount. In this case, the market is in a downtrend. We don't want to jump in right away. Instead, we wait for a correction to pull the price
[08:01] back up into a premium zone, which gives us a better entry and increases the chance of a successful trade. Once price enters this premium area, we apply the CRT model. But this time, we only focus
[08:14] on bullish candles within the correction. Just like before, we mark and wait to see how the next candle behaves. If the next one breaks and closes above the range, the setup is not valid. But if it sweeps above and then
[08:28] closes back inside the range, we have a valid CRT signal in line with the bearish trend. To improve the entry, we zoom into a lower time frame and wait for a fair value gap to form right after the sweep.
[08:42] Then we place our sell order at that gap and set the stop loss above it. Again, we can take partial profit at 1:1 and let the rest run toward the next major support or liquidity zone. By waiting for a pullback into a premium
[08:56] area before applying the CRT, we combine three powerful elements: trend direction, manipulation, and entry from a discount premium zone, giving us a clean, smart, and high probability setup.
[09:10] Now that we've gone through how to apply CRT properly, let's quickly look at some common mistakes traders often make and how you can avoid them. One big mistake is trading CRT during a choppy market where there's no clear
[09:23] direction. CRT works best in trending conditions where you can clearly identify impulse and correction legs. Without that, the sweeps can become meaningless. Another common issue is entering too
[09:35] early. for example, taking a trade just because the price reversed. But that's not enough. You need to wait for a proper liquidity sweep followed by a close back inside the candle range. Wait for the candlestick to complete. If you
[09:49] enter before that, it might continue pushing downwards again. Traders also often forget about market context. Even a perfectl looking CRT setup can fail if it happens right into a major news release or near a strong
[10:02] higher time frame level like a daily resistance or support. Always check the bigger picture. Avoiding these simple mistakes will help CRT.
[10:14] real chart examples and see how we approach different market scenarios. So here we have Euro dollar on the 1 hour chart. We are going to take every CRT trading pattern we spot during the back testing. Let's begin. By breaking
[10:29] above this swing high, the latest price action shows that the bulls are in control and we are in an uptrend. So we are only interested in buying opportunities. Therefore, we are going to apply the CRT model to the bearish
[10:43] candles. Here we have our first pullback candlestick. We mark the highest point as candle range high and the lowest point as candle range low. Now the only thing we want to see is that the price
[10:55] breaks below the CRL and returns back inside the range. But if we get another bearish candle completely breaking below the CRL, then we will skip the trade and let's see what happens when the next candle forms.
[11:11] Here we can see that the price penetrated below the CRL with a wick and closed back inside the range. So with our range candle and sweep candle formation, we will look for a long trade and expect the price to complete the CRT
[11:24] model with an upward move. But the question is where do we enter the market? To execute the trade, let's zoom into the 5-minut chart to set our entry. Here on the 5-minut chart, we can
[11:38] observe much more detail. This is our latest impulse that swept the liquidity latest impulse that swept the liquidity and closed back inside the range. So right now the only thing we need is to find a bullish fair value gap area to
[11:51] enter the trade. If you focus on the latest move, you can see that it has already created an FVG and is currently being rejected by the price. So everything is ready to open a buy position here and set our stop loss in a
[12:04] safe place. Now for the targets, as mentioned before, we always close half of the position when the price reaches our one:1 target. And for the second our one:1 target. And for the second half, we let the profits run.
[12:19] many times price created FVGs along the upside move and gave us trading So here we had our first successful trade. But let's continue on the 1 hour chart to find more setups. Here once again we have a bearish
[12:34] candlestick formation where we can apply the CRT model. We mark the high and low and wait for the next candle to close. Once again, sweep forms. Let's zoom into trade. On the five-minute chart, we can see
[12:50] that the price has already formed multiple fair value gaps. We will set a buy limit at the lowest FG because it's located in the discount zone, giving us a better risk-to-reward ratio and a safer stop-loss placement. We use the
[13:05] same exit rules as in the previous trade. Now, let's see what happens. The price triggers our buy limit, hits our first target, but then reverses downwards and eventually hits our stop loss. However, since we closed half of
[13:20] the position at the 1:1 target, we ended up with a break even trade. So, we didn't lose any money and got out safely. Still, let's zoom out to the 1 hour chart to find more entries.
[13:33] Once more, we can see a big bearish candlestick where we can apply the CRT The following candle sweeps the liquidity below the candle range low. And once again, it's time to zoom into the lower time frame to execute the
[13:47] trade. With the sweep candle formation on the want to see in this lower time frame is a bullish FVG forming. So, we can set a bullish FVG forming. So, we can set our entry. So, let's move forward.
[14:01] Here we have a small FVG. So, we set a buy limit with a relatively larger stop loss. Following that, we have another FVG formation. So, without canceling the first trade, we set up another one.
[14:16] Once again, we get a great winning trade. Of course, this was just back testing, and fortunately, we found multiple successful trades, but that's not always the case in real trading. However, this
[14:29] was just to show you how we approach the market in different scenarios. So guys, I hope you enjoyed this video. If you did, please hit the like button to to share your ideas in the comment section. See you in the next video.
⚡ Saved you 0h 14m reading this? Transcribe any YouTube video for free — no signup needed.