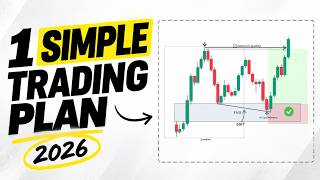

The Most Accurate Day Trading Strategy?
45sThe opening promises a highly accurate, tested strategy, creating curiosity and high expectations.
▶ Play Clip"The title promises an accurate strategy and delivers a detailed breakdown, but the sponsor segment and repetitive explanations add some padding."
This video presents a day trading strategy for correlated pairs, combining higher timeframe liquidity delivery, proper session timing, and SMT divergence. The presenter explains the conditions for high-quality setups, entry models, and provides a real chart example to illustrate the process.
The strategy combines three elements: higher timeframe liquidity delivery, proper session timing, and SMT divergence. When all three align, it can produce clean A+ setups.
Traders often look for SMT divergence between any correlated pairs at random times. The alignment matters: you need to know which pairs to compare, when to look, and which timeframes to use.
SMT stands for Smart Money Tool. It highlights divergence between two correlated markets, allowing traders to compare relative strength and identify potential shifts in price direction.
Examples include S&P 500 and Nasdaq, or Eurodollar and Pounddollar. Normally, correlated pairs should follow a similar price pattern; a break in correlation signals potential reversal.
An SMT divergence or liquidity sweep at a random time doesn't carry the same weight as one around a major session open. Timing is a critical factor.
Wait for price to trade into a higher timeframe key area, such as a 15-minute unfilled fair value gap or unmitigated supply zone, or sweep buy-side liquidity above previous session's high.
Zoom into a lower timeframe (5-min or 1-min) to track delivery and look for SMT divergence. For bearish, one pair forms a higher high, the other a lower high, leaving liquidity untouched.
Focus on the pair where the liquidity sweep has occurred. That pair has already taken liquidity, giving stronger confirmation of manipulation before reversal, and often cleaner entry signals.
Prefer an inversion fair value gap (IFVG) forming after the liquidity sweep. Once the IFVG forms, it acts as new resistance. Enter immediately at next candle open or place a sell limit at the lower boundary.
Look for a breaker block or mitigation block. For a bearish breaker block: swing high, swing low, higher high, then bearish expansion. For a mitigation block: swing high, swing low, lower high, then bearish displacement.
On NASDAQ 15-min, price swept buy-side liquidity above Asian high during London open, then dropped. On 1-min, NASDAQ formed higher high while S&P 500 formed lower high, creating bearish SMT divergence. A breaker block formed, leading to a sell entry and 3.2R profit.
The strategy requires precise alignment of timing, liquidity delivery, and SMT divergence. By focusing on the pair that swept liquidity and using appropriate entry models, traders can execute high-probability setups.
Three-Part Strategy
Defines the core framework that the entire video is built on.
00:53SMT Divergence Explained
Provides a clear definition and example of a key technical concept.
02:42Timing is Critical
Emphasizes that session timing is a non-negotiable filter for high-quality setups.
04:55Focus on the Swept Pair
Offers a practical pro tip that improves entry selection and confirmation.
06:23Real Chart Example
Demonstrates the strategy in action, showing a 3.2R trade from start to finish.
10:21[00:00] Hey traders, and welcome back to Smart Risk. In today's video, I'm going to show you one of the most accurate day trading strategies we've tested so far. It's a simple trading model designed to help you identify high-quality setups,
[00:13] avoid random entries, and know exactly what you're looking for before taking a trade. But what makes this strategy different is that we're not relying on just one confirmation. There are a few specific conditions that need to line up.
[00:25] And when they do, they can create some incredibly clean A-plus trading setups. So make sure you watch until the end, because I'll break down the entire strategy step by step and show you exactly how to apply it on real charts.
[00:39] See you after the intro. Welcome back, traders. So, let's get started.
[00:53] This is one of the most accurate strategies you can use when trading correlated pairs because it brings together three things. higher timeframe liquidity delivery, proper session timing, and SMT divergence.
[01:06] When all three line up, you can get some incredibly clean A-plus setups. In a bullish scenario, we want to see price sweep a key sell-side liquidity level or tap into a higher timeframe key zone,
[01:19] while at the same time creating an SMT divergence with the other correlated pair. From there, price quickly rejects that area, trades back inside the range, and starts pushing higher.
[01:31] But here's where most traders get it wrong. You can't just look for SMT divergence between any two correlated pairs at any random time and expect it to work just because you also have a liquidity sweep or higher timeframe delivery.
[01:44] The alignment matters. For the highest quality setups, you need to know which correlated pairs to compare, when to look for the SMT divergence, and which timeframes to use. And that's exactly what we're going to break down
[01:57] in this video. The exact opposite applies in a bearish scenario. Price sweeps a keyed buy side liquidity level at a specific time or trades into a higher time frame key area while simultaneously forming an SMT divergence with a correlated pair.
[02:13] From there, price quickly rejects that area, returns back inside the range, and starts pushing lower. But it's not as simple as it looks. For this setup to work properly, certain conditions need to line up,
[02:26] especially when it comes to the SMT divergence. But before we get into those conditions and break down exactly how to use this trading plan to execute trades, let's first understand what an SMT divergence actually is and how to identify it properly.
[02:42] SMT stands for Smart Money Tool. It's a confluence tool that highlights divergence between two correlated markets, allowing traders to compare their relative strength and identify potential shifts in price direction.
[02:54] But there's one important thing to keep in mind. For this trading strategy, we only want to focus on properly correlated pairs, such as the S&P 500 and Nasdaq, or Eurodollar and Pounddollar. Normally,
[03:08] correlated pairs should follow a similar price pattern. For example, on the left we have pair 1 where price forms a low followed by a lower low On the right pair 2 does the exact same thing also forming a low followed by a lower low In both cases the sell liquidity below the previous low has
[03:26] been taken. Since both pairs are moving in sync, there's no break in correlation, which means there's no S&P divergence. But now imagine the S&P 500 forms a lower low and sweeps its sell-side
[03:39] liquidity, while NASDAQ forms a higher low and leaves its sell-side liquidity untouched. Now we have a clear break in correlation. One market has taken the liquidity, while the other has failed to do the same. This shows a clear imbalance in strength between the two correlated
[03:56] markets and can signal a potential reversal to the downside. The exact opposite applies in a bearish scenario. Now that we understand how SMT divergence works, let's put all the pieces together, break this setup down step by step, and see exactly how we can use it to execute trades.
[04:13] But before we continue, if you're looking for a trusted prop firm with fast and reliable payouts, then you need to check out FundedNext. FundedNext is one of the pioneer prop firms that offers both futures accounts and CFDs all in one place. They provide a wide range of challenge accounts from
[04:30] $5,000 all the way up to $200,000. And recently, the 70% margin rule has officially been removed from both existing and new funded Next accounts. And for the smart risk community, there's a
[04:43] special offer. You can get an exclusive 7% discount plus a 120% account reward, available only through our link in the description. Before applying any of the steps in this trading model,
[04:55] there's one very important factor you need to consider. The time of day. An SMT divergence, liquidity sweep, or higher time frame delivery that happens at a random time of day doesn't carry the same weight as one that forms around a major session open. So in a bearish scenario,
[05:13] the first step is to wait for price to trade into a higher time frame key area, such as a 15-minute unfilled fair value gap or an unmitigated supply zone from a previous session. Alternatively, price can sweep the buy side liquidity above the previous session's 15-minute high and then
[05:29] quickly reverse back inside its range. Let's say our first pair is NASDAQ. From there, we zoom into a lower time frame, such as the five-minute or one-minute chart, to track the higher time frame
[05:41] delivery and look for reversal confirmation. And this is where we want to see our SMT divergence before looking for a trade. So we check the other correlated pair and compare how both markets are
[05:54] reacting. For a bearish SMT divergence, one pair should form a higher high and take the buy-side liquidity, while the other correlated pair forms a lower high instead, leaving its buy-side liquidity untouched. That difference creates the crack in correlation we're looking
[06:10] for. And now, we have exactly what we want to see. The right timing, higher time frame delivery, and a clear SMT divergence between the two correlated pairs. But here's a pro tip that
[06:23] can make this setup even stronger. When an SMT divergence forms, technically, you can analyze either correlated pair and look for an entry. But which one should you choose? In most cases it better to focus on the pair where the liquidity sweep has already occurred The reason is simple That pair has already taken the relevant buy or sell liquidity
[06:47] giving you stronger confirmation that the sweep may have been the manipulation before the reversal. Once that liquidity has been cleared, price can also have a cleaner path toward the opposing side liquidity.
[06:59] And more importantly, the pair that performed the sweep will often give you cleaner reversal confirmation, such as a market structure shift followed by a clear entry model. So instead of randomly choosing between the two correlated pairs,
[07:13] focus on the one that actually swept the liquidity. Once you've chosen the right pair, the next step is to wait for a suitable entry model before opening the trade. At this stage, if I'm trading on the one-minute chart,
[07:26] I usually prefer to look for an inversion fair value gap forming right after the liquidity sweep. But if I'm using the five-minute chart, I prefer looking for a breaker block or mitigation block that forms after the manipulation move. Now, if we're using
[07:40] the one-minute time frame, we want to see an existing fair value gap get violated and flip into an inversion fair value gap. Once the ISDG forms, it can act as a new resistance level, giving us a strong area for a potential sell entry. And if we get a market structure shift
[07:56] at the same time, that adds another layer of confluence and makes the setup even stronger. When it comes to entering the trade, you have two options. Option one is to enter immediately after the ISVG forms by opening your position at the next candle open. Option two is to place a
[08:13] sell limit order at the lower boundary of the newly formed inversion fair value gap and wait for price to retrace back into the zone and trigger your entry. For take profit, you also have a few options. You can target the nearest sell-side liquidity on the one-minute chart,
[08:29] or if you're looking to capture a larger move, you can target the Asian session midpoint or the Asian session low. Another clean approach is to use a fixed risk-to-reward target, such as 2.5R or 3R, depending on your trading style. However, if you're using the five-minute
[08:46] chart as your entry time frame, then after the liquidity sweep and higher time frame fair value gap delivery, you want to look for either a breaker block or a mitigation block. For a valid bearish breaker block, price should first create a swing high, followed by a swing
[09:02] low, and then a higher high. From there, we want to see an immediate bearish expansion that breaks structure and confirms the shift. In this case, the down-close candle, or a series of down-close candles, formed between
[09:15] the first swing high and the swing low becomes our breaker block zone. This is the area where we'll look for a potential short entry. The next step is to place a sell limit order at the lowest point of the breaker block
[09:27] and wait for price to retrace back into the zone. Now, keep in mind that a mitigation block forms a little differently. Instead of looking for a higher high, we want to see a lower high.
[09:39] So, for a valid bearish mitigation block, price should first create a swing high, followed by a swing low, and then a lower high. From there, we want to see strong bearish displacement that breaks below the previous swing low.
[09:52] In this case the last down candle or series of down candles formed between the first swing high and the swing low becomes our mitigation block zone From there we place a
[10:05] sell limit order at the lowest point of the mitigation block, with our stop loss a few pips above the nearest swing high, and wait for price to retrace back into the zone and trigger our entry. Now that we have all the pieces in place, let's move into some real chart examples and see exactly
[10:21] how to apply this trading model step by step. Here we have the NASDAQ 15-minute chart on the screen, and if you look closely, you'll notice that as the Frankfurt and London sessions open,
[10:33] price starts pushing higher, sweeps the buy side liquidity above the Asian high, and then quickly drops back inside the Asian range. So right away, we have the first condition we were looking for. At this point, I zoom into the one-minute chart to closely monitor the price
[10:48] action, look for signs of a reversal and identify a potential SMT divergence. Now we have the NASDAQ one-minute chart on the screen. You can clearly see that after sweeping the liquidity above the
[11:00] Asian high, price immediately drops back below the level and trades back inside the range. But now, let's bring in NASDAQ's correlated pair, the S&P 500. This is where things get interesting.
[11:14] NASDAQ creates a higher high and takes the buy side liquidity, but the S&P 500 fails to do the same and instead forms a lower high. So the two correlated markets are no longer moving in sync, giving us the bearish SMT divergence we were looking for.
[11:30] And at the same time, we also get a bearish market structure shift right here, adding another strong layer of confluence to the setup. So now, we have everything lining up in one place. the liquidity sweep, the bearish SMT divergence, and the market structure shift.
[11:47] The next step is to look for a suitable entry model before opening the trade. If you look closely, we have a bearish one-minute breaker block, represented by these two bearish down-close candles.
[11:59] Price first creates a swing high, followed by a swing low, and then a higher high. From there, we get an immediate bearish expansion that causes the market structure shift.
[12:11] With all these confirmations in place, we can anticipate a retracement back into the breaker block before price continues lower. So, I place a sell limit order at the lowest point of the breaker block, with my stop loss above the most recent swing high.
[12:30] For take profit, I target the nearest key sell side liquidity on the current time frame, giving us roughly a 3.2R setup. Now let's play the chart forward.
[12:43] As you can see, price retraces back into the breaker block, triggers our entry, and then continues pushing lower exactly as expected.
[12:59] Eventually reaching our take profit target. That's it traders. Thanks for watching. I hope you found this video valuable. If you did, hit subscribe and turn on notifications so you never miss an update.
[13:12] Drop a comment below with your thoughts or topics you'd like to see next. Your support means the world to us. See you in the next video.
⚡ Saved you 0h 13m reading this? Transcribe any YouTube video for free — no signup needed.