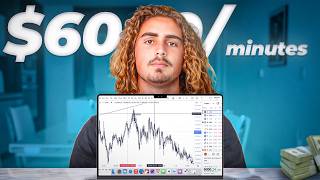

Made $6,000 in Under an Hour with ICT
45sThe high monetary claim and promise of a simple strategy hook viewers seeking quick profits.
▶ Play Clip"Title accurately reflects the trade result and educational content, though the $6,000 claim is specific to one trade."
A trader breaks down a trade that made $6,000 in under an hour, explaining the top-down analysis, confluences, and execution steps. The focus is on using ICT concepts like SMT divergence, liquidity sweeps, and fair value gaps to find high-probability setups.
From top-down analysis, the market was significantly overbought from Wednesday, indicating a bearish bias. Sweeping daily highs added confluence for profit-taking.
On the hourly timeframe, the S&P swept out highs right at market open, confirming a liquidity sweep to the upside with a bearish bias.
SMT divergence appeared: ES made a higher high while NQ made a lower high, signaling that price would likely go lower.
A bullish fair value gap was invalidated, creating an inverse fair value gap that confirmed bearish momentum. Price then filled a bearish FVG to the downside.
Entry was taken after confluences. One contract was managed at 15-minute lows (1:2 RR), and the rest ran to high timeframe drawn liquidity for final take profit.
The trade demonstrates how combining multiple ICT concepts—daily bias, liquidity sweeps, SMT divergence, and fair value gaps—can lead to a high-probability setup with significant profit potential.
What is SMT divergence?
When two correlated indices (e.g., ES and NQ) make opposing highs/lows, indicating a potential reversal.
01:53
What does an inverse fair value gap indicate?
It indicates that a bullish FVG has been invalidated, suggesting price will likely move lower.
02:58
What was the daily bias for the trade?
Bearish, because the market was significantly overbought from Wednesday and had swept daily highs.
00:30
What was the first confluence on the hourly timeframe?
A liquidity sweep of highs right at market open.
01:23
How was the trade managed?
One contract was taken off at 15-minute lows (1:2 RR), and the rest ran to high timeframe drawn liquidity.
03:55
Daily Bias from Overbought Condition
Shows how to derive a bearish bias from simple price structure analysis.
00:30SMT Divergence as a Signal
Demonstrates a key ICT concept for confirming directional bias across indices.
01:53FVG Invalidation Confirmation
Illustrates how to use fair value gap invalidation as a high-probability entry trigger.
02:58[00:00] I'm about to lay down the ICT strategy that made me $6,000 in under an hour. This isn't going to be one of those videos that makes you feel like you're on the spectrum or, you know, a little bit messed up in the head. All right, I'm going to break this down super
[00:13] simply so you guys can copy and apply it to your trading today. If you guys are struggling trying to understand ICT or just being consistent in general, this video is going to help a lot. So just sit back, let it happen. Let's get in the charts. So let's jump right into this. This was on
[00:26] June 6th, so super recently, Thursday, okay, of last week. First and foremost, we're just going to get into top-down analysis, okay, how I found my daily bias for this day, right? So first of all,
[00:39] I'm looking in here and I'm seeing, okay, cool, we are significantly overbought from Wednesday, okay? We definitely want to come down into the equilibrium of this range from down here to up
[00:51] here. So I'm looking for bearish bias. On top of that, we just came through and swept out some daily highs. Okay. So again, that's more of a confluence for at least some profits to be taken off of these daily highs getting hit. So from here again, what am I looking for? I'm looking
[01:07] for equilibrium from these range lows up to these range highs. And again, we're not necessarily going to be including this price action because that was from before. But again, I want to see this equilibrium hit. And again, we're kind of ranging right now, but I do think that we can
[01:20] come back down to this area at some point in time. So boom, I got a bearish bias going into that scale down a little bit further. Okay, on the hourly timeframe, we can see on the S&P, we came right on up swept up these highs right when market opened boom liquidity sweeper okay Liquidity sweep to the top side while having a bearish bias moneymaker
[01:44] Scaling down even further, oh, what's that you say? SMT divergence. And all of these concepts that I'm talking about right now, I have videos on the trading transformation that talk about all of these, okay?
[01:57] So again, I'm doing like kind of a interactive trade recap for you guys. So you guys can fully understand this more. But if you guys need or hear like a concept that you've never heard before, it's already been covered in trading transformation or in the bootcamp several times over.
[02:10] So boom, we see initial sweep right when market opens. Beautiful, right? From there, we see an SMT divergence. We see a high made right here and then a higher high on ES.
[02:24] And then if we go over to NQ, let me show where market opens so you guys can see and understand what I'm talking about. We have a high and then we have a lower high. So NQ, because it has SMT divergence, is pretty much telling us, hey, we are going to go lower. So from there, what am I doing?
[02:42] Scaling down even lower. I see the SMT divergence on the higher time frame. We scale down. Boom, we can see this again. From there, we got the liquidity sweep. We see an SMT divergence. I'm
[02:54] on the one minute okay i'm trying to get in and i'm trying to get active what am i looking for to execute i'm looking for a confirmation and i'm looking for a third confluence okay so what do we get we get a liquidity sweep what do we have right here a bullish fair value gap that gets
[03:07] invalidated okay an inverse fair value gap boom we get that break one of our confirmations with an inverse fair value gap saying hey price is probably going to go lower From there what do we see happen right after that
[03:20] Boom, price comes in, fills in this bearish fair value gap perfectly, gives us a reaction to the downside, execute on that shit.
[03:32] And if you guys have seen, I'm pretty sure I posted this on my Instagram story, so you guys know I ain't capping. okay i showed the executions on that and i was talking about all of these confluences live on kick so we have a couple confluences here we have boom these lows right here which
[03:49] were 15 minute lows for a one to two risk reward ratio and then also on top of that boom what do we have these high time frame lows all the way down here and as you guys know i've already done a trade recap on this for you guys that you guys can go back and watch again but we can see that
[04:05] because of that SMT divergence on NASDAQ over here, we can see, oh, well, NASDAQ, when that happened, immediately came down, took out these same lows that the S&P did, but also came down
[04:21] and took out these high timeframe lows. So maybe in my case, I managed one of my contracts right here, boom, managed one of the contracts right here, and then let the rest run all the way down
[04:34] until final take profit right here, which happened over time. Why? Because NASDAQ was going to be able to tell us hey we hit this high timeframe draw on liquidity Our bias was bearish because boom we were really overbought We had equilibrium that price is probably going to seek out We had an SMT divergence along with a sweep of liquidity along with an inverse fair value gap giving us confirmation along with a bearish
[04:57] a bearish fair value gap that gives us even more confirmation of the downside entry off that stops above this high boom, final take profit on this drawn liquidity. Simple as that, man.
[05:09] If y'all made it this far into the video, you guys better go. Like, I don't, I'm not even going to ask you to you guys to like and subscribe but if you want to you know might as well bang that shit up and give me a little yeet bell button as well but if you guys made it this far you guys might
[05:22] as well go into the fucking charts and apply what i just taught you okay i've given literally all of these confluences to you guys within the boot camp i'll you know send a fucking link bank up here to the boot camp bank up here to the trading transformation okay there's also links in the
[05:35] description to all this shit which is free information to teach you guys how to trade like me okay i didn't just spend all this time for you guys so okay give a pre-market edge okay i want to give you guys an actual edge in the market i already went ahead and did you guys a
[05:50] favor by the way okay and i grabbed pretty much the best videos from the boot camp because right now okay look i mean i'm gonna be real with y'all youtube revenue striking i got ads on on the boot camp but i did you guys a favor okay and put the boot camp in a nice little package for a free ski
[06:05] without any ads and I grabbed some videos from the trading transformation, put it together. Because again, like I said, the bootcamp is pretty much my free course that was gifted to you guys because I'm such a nice guy. Okay. So if you guys want access to that, again,
[06:17] it's completely free, not trying to sell you guys anything, get access to that link is in the description. Tap in with that. I appreciate you guys. I love you guys. Peace.
⚡ Saved you 0h 06m reading this? Transcribe any YouTube video for free — no signup needed.