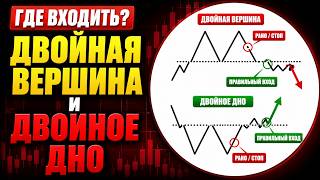

The Double Top Liquidity Trap
58sExplains the smart money manipulation behind double tops, making traders realize they've been trading the pattern wrong.
▶ Play Clip"Delivers exactly what the title promises — a detailed breakdown of double top/bottom entry criteria, with only minor repetition."
The video is an educational lesson on trading double top and double bottom patterns using Smart Money Concepts (SMC). It explains the liquidity mechanics behind these reversal patterns, the required confirmation via structural breaks and imbalances, proper entry and stop placement, and how to use higher timeframes for directional bias. Real chart examples on hourly and 45-minute timeframes illustrate the criteria in action.
In Smart Money, the first peak removes liquidity, and the second peak only updates the first, adding manipulation to stop out traders. This is different from technical analysis, where peaks can be equal or arbitrary.
A valid double top requires the second peak to only update the first. If it removes additional liquidity from the left side, the interpretation as a double top is wrong and can lead to false entries.
After the price forms two swings and updates the first, there must be a structural break on the internal structure (BOS or MSS). The breakdown of internal structure is more common than of the pig structure.
An imbalance is required because it becomes the zone from which an entry point is selected. If no imbalance forms, the reversal signal is weaker and less reliable.
Entries can be placed from the 50% level of the imbalance or from its base. The base is preferable because it offers a better chance of getting filled if the price reverses from the edge.
Double tops and bottoms form on any timeframe, from 1-minute to 4-hour. A pattern on a higher timeframe can be used as a directional guide, with entries taken on lower timeframes like M5 or M15.
While not mandatory, a tested zone of interest (support/resistance) near the pattern greatly improves success. An untested zone remaining behind the pattern is a cancellation factor.
Both peaks may test the zone, or only the second peak may test it. Both situations are acceptable and considered valid configurations.
The double bottom follows the same logic: first bottom collects liquidity, second bottom only updates the first, then a structural break with an imbalance provides the entry zone.
Always place the stop behind the second top or bottom (manipulation point). Imbalances can have imprecise boundaries across timeframes and are sometimes briefly broken through, so they are not safe stop levels.
The video delivers a clear, criteria-based framework for trading double top and double bottom patterns using Smart Money concepts. The keys are confirming liquidity sweeps, structural breaks, and imbalances, always placing stops behind swings, and using higher timeframes for directional bias.
What is the main difference between a double top in technical analysis and in Smart Money concepts?
In Smart Money, the first peak removes liquidity and the second peak only updates the first, while in technical analysis peaks can be equal or different without considering liquidity.
00:01
What is the common mistake students make when interpreting a double top?
They think the second peak can also remove additional liquidity; actually, it must only update the first peak.
00:29
What must occur after the second peak updates the first in a valid double top?
A structural break (BOS or MSS) — usually of the internal structure.
02:05
Why is an imbalance required during the structural break?
It serves as the zone from which to select an entry point, giving a likely reversal area.
02:20
What are the two entry options when trading from an imbalance?
From 50% of the imbalance or from its base.
03:29
Which entry is preferable and why?
The base of the imbalance, because it gives a better chance of getting filled if the price reverses from the edge.
03:43
How can a higher-timeframe pattern be used in intraday trading?
Use it as a directional guide and switch to a lower timeframe (M5/M15) to find a trend or impulse entry in the same direction.
04:53
What is the role of a zone of interest in pattern reliability?
A tested zone increases reliability; an untested zone behind the pattern is a cancellation factor.
07:33
Where should the stop-loss be placed when trading double tops/bottoms?
Behind the manipulation point — the second peak/bottom, not behind the imbalance.
11:36
Why should you never place a stop behind an imbalance?
Because imbalance boundaries can be imprecise across timeframes, and price may briefly break through the imbalance.
12:05
The 'only update' rule
This is the most common mistake in double top/bottom trading — understanding that the second extreme must only update the first prevents false interpretations.
00:29Imbalance is mandatory
Without an imbalance during the structural break, there is no clean entry zone, making the trade unreliable.
02:20Zone of interest as a reliability filter
Running the pattern at a tested zone of interest dramatically improves the probability of success, while an untested zone behind acts as a cancellation.
07:33Stops behind swings, not imbalances
Imbalance boundaries are timeframe-dependent and can be overshot, so stops must be placed behind structural swing points instead.
11:36[00:01] pattern. This is a double top, so it's a bear market setup, right? And the regular market. What are our criteria for forming a double top, in general? What is this pattern? Ah, we have this kind of structure. I'll say right away that
[00:16] yes, those who used to trade using technical analysis, that is, uh, double top, double bottom, in Smartman are different from technical analysis. Ah, yes, because in technical analysis, that is, it doesn’t matter which bottom is, or which top is
[00:29] higher, or they can be equal. That is, we forget about this, yes, in a smartphone it’s a little different, but everything works. That is, here we definitely see the withdrawal of liquidity as the first peak. That is, our first peak removes some
[00:42] liquidity on the left side and then the second peak only updates the first. So, in other words, additional manipulation is happening, right? That is, in essence, yes, this peak has already carried out manipulation, that is, removed
[00:55] liquidity. And, accordingly, everyone who went short here, yes, additional manipulation occurs, they are knocked out, that is, these traders are stopped out . Well, and, accordingly, then it really goes in this
[01:09] direction, yes, that is, in which the people who entered here, and, that is, the price still rushes in that direction. That is, in essence, yes, this additional manipulation that was carried out in order to knock out, well, kind of
[01:22] make money on this, yes, that is, the stops were collected and the price went, well, in the right direction. A very common mistake students make is when they, uh, by a double that is, a construction that looks something like
[01:36] was work here with liquidity, and this peak also removed liquidity. And this is wrong, right? That is, it is impossible to interpret the double top in this way. exclusively the case when the second top removes only the first and that’s it. And the
[01:53] first one removes all liquidity, right? If the second one works additionally, that is, this , yes, top with some other liquidity on the left side, then we as a double top. Accordingly, yes, be careful,
[02:05] don’t get caught. This means that after we have formed these two swings, updated it, we experience a structural sleep. Here's the thing boss and boss - it doesn't matter. That is, there may be a breakdown of the pig structure, there may be a breakdown of the
[02:20] internal structure. More often we will talk here about the breakdown of the internal structure. And it is imperative to see the formation of an imbalance during the breakdown of the structure. Why is it necessary? Because the imbalance will be, yes, that
[02:34] zone from which we can select our entry point. That is, for example, if there was a breakdown here, but in such a way, yes, the price moved here that it did not create an imbalance for us, that is, uh, yes, we need to understand that if the
[02:47] price returns here, yes, that is, it is possible, but such a thing, that is, in this to set the price, and how could this happen, . That is, we need the imbalance in order to serve as a
[03:02] can additionally, yes, say that the price will reverse from it. And it is precisely in this zone that we place our entry point, yes, our limit order. If we decide to work with such a pattern. We have
[03:16] decide to work with such a pattern. We have two entry options, yes, it is either from 50% of the imbalance, or we can also set a limit based on the imbalance. So here you need to look at how you are doing in terms of risk-
[03:29] doing in terms of risk- reward ratio, right? It turns out that we enter from the base from the base, that is, I am before, well, it would be preferable, yes, for me it is preferable to work from the base of imbalance. Why? Because in this format we have a better
[03:43] chance of getting an entry point. Yes, I hope everyone understands this, because I hope everyone understands this, because accordingly, it may happen that the price will come here, yes, from here, for
[03:56] example, it will turn around, and we with our limit order will be there in the middle, that is, we may be left without a position. This means that when it comes to patterns, they are formed and work the same on all time frames. That is, such patterns can
[04:10] form in a minute or a five-minute period. So we can see this picture, yes, and there, say, on a four-hour time frame. What is important to understand here? Ah, if you see, yes, for example, such a pattern on the four-hour timeframe,
[04:25] and you are trading intraday, yes, that is, it is important to you that your deal say, yes, that is, closed today, then it is clear that going based on such a pattern, naturally, if you enter from it, then it will be very
[04:40] because, yes, that is, it can work out, if again, yes, for is, a very, very long time, there up intraday trading, then, of course, we are interested in trading patterns that
[04:53] have formed there on lower timeframes, yes, accordingly, 5, 15, looking at the hourly timeframe too, yes, it is definitely necessary, that is, because such patterns are very often formed on the hourly timeframe. Well, in general, all patterns are formed, yes.
[05:06] formed on higher timeframes? That is, here, look at the algorithm. But to enter, let's say, from an imbalance, as I have shown here, yes, in the screenshot, as I already said, that is, you will not be able to, because the transaction
[05:18] will be very long. That is, in this case, we can take patterns from higher timeframes as a guide to where the price is moving. That is, if we see a pattern on a higher time frame, yes, well, for example, we see that the price
[05:33] it comes to this imbalance, that is, we understand, yes, seeing this pattern, that on higher time frames the price is going down. So, what can we do in this case ? In this case, we can switch to lower timeframes and
[05:47] impulse that we are waiting for on higher timeframes on lower ones, but not in this way, that is, trading the pattern itself, but, that is, right here , yes, if we switch there to M15, M5 and so on, that is, there will be
[06:01] its own trend movement, yes, which on four will look like an impulse, say, on M5, M15, that is, there will be a full-fledged trend. That is, you can switch and simply look for an entry point on a lower time frame, but
[06:14] based on the pattern of a higher time frame. That is, patterns, yes, let's sum it up briefly, and they can be traded directly, yes, or they can be used on higher timeframes as a guide for, that is,
[06:27] price movement in the near future. That is, not directly, yes, not to trade them, but based on them, select some entry points for yourself, just like I showed you here. That's why, yes, don't ignore the patterns that you
[06:39] see there on H4, on the daily chart, for example, there too, yes, 12 hours and so on, because they will give you a hint where, in principle, yes, the price will move in the near future. Based on this information, you can now
[06:51] understand where you need to work. That is, it is clear that if you see a reversal pattern at four o’clock, at 12 o’clock , then what is the point for you, yes, to look for That is, if a particularly elephantine structure has already occurred, yes, you see an
[07:05] imbalance, then it is clear that, well, we would give preference to working short, situation. That is, you already understand where you need to be on the lower time frame, in which direction, and look for a position for yourself. Therefore, it is very, yes, important to also look at
[07:18] only reversal patterns , but always, yes, when we are looking for an time frames, because they give us very important information in the higher, yes, relative to the lower ones. What else about the pattern itself? Yes, she didn't
[07:33] say. This is what you are looking at, this condition will not be mandatory, but it is highly desirable that it be there. This is a zone of interest test, right? Here I have it zone of interest test, right? Here I have it drawn in blue. Aa it won't always
[07:47] be like this. That is, there will not always be a zone of interest that is being tested, but if there is one, it will greatly increase the reliability of the pattern. Why? Any area of interest is, yes, either support or resistance. That
[08:00] is, some kind of price containment zone. Accordingly, if we see that the price, yes, is drawing us a reversal pattern, and even in a zone that in itself this is like an additional factor, yes, that is, here we already have several factors
[08:15] certain movement of one of the sides. That is, we understand that, short here, we already have more grounds, yes, the zone of interest is unfolding, we see a is, a picture is emerging, we understand that here the price is going short, and we,
[08:30] accordingly, can work in this direction . Ah, I will say, yes, in my own trading I also try not to trade without pattern interest zones. That is, I’m interested in when a pattern is formed either in the
[08:43] imbalance zone, or it is formed, say, in the order block zone, or an order block plus imbalance, yes, a very common combination. That is, when there may not be one zone of interest here, they may be here in two, yes, somewhere nearby, yes, or there,
[08:58] on the border with one another. That is, I will be interested to see the intersection, ae, that is, a test of the intersection of these two zones. And I can tell you from experience that such patterns work better. That is, when we see a test of the zone of interest, then, in
[09:12] a word, then this is a very good additional factor, real reversal, yes, of such a pattern, based on such a pattern, that is, they will be much higher. Regarding the test, look, it happens
[09:27] that the zone of interest can be tested by both the first peak and the second. It happens that the zone of interest is tested only by the second peak. That the zone of interest is tested only by the second peak. That is, it happens that I will draw now too.
[09:40] It happens that such zones of interest, and we already stop at the first peak in it , and, accordingly, the second. This is also a variant of the norm. It may , that is, only the second vertex. That is, both ways
[09:54] will be acceptable and correct. But just be careful with that situation when, for example, the zone of interest remains somewhere here, but a reversal pattern has formed here, without reaching the zone of interest.
[10:09] For me, this is a cancellation factor, because very often you can then see some kind of picture like this. the price still comes here, gives from the zone of interest, breaks this pattern and then really there, ah, goes, yes, and corrects, or
[10:24] goes there and gives a new impulse. That is, if an untested zone of interest remains behind the pattern, cancellation factor, while a tested zone of increases the reliability of the pattern. Therefore, pay close attention to the areas of interest, yes, around which
[10:38] patterns are formed . So, let's look at the double bottom. Everything here, in principle, is by analogy, yes, but, accordingly, only the bullish option. Let me comment, yes, we will also train a little
[10:52] observation in one direction and another . This means that we have the first bottom, which is collecting liquidity. Rollback. Second bottom, I remind you, right? That is, it only updates the first one. That's it, there
[11:07] updates the first one. That's it, there will be a stop hunt. We'll talk about it separately now. Then the BOS or Moss structure is broken . Both are acceptable. And when there is a breakdown, we need to see the formation of an
[11:22] a breakdown, we need to see the formation of an imbalance. And the imbalance, its bases or its 50%, they will serve as an entry point for us, respectively. Regarding the stop, by the way, yes, I said, we always place a stop for manipulation, that is,
[11:36] either for the second top, or in the future version for the second bottom, right? That is, not for imbalance in any case, yes, because people like to enter somewhere from the imbalance, yes, there, from the base somewhere, put a stop here. That is,
[11:50] uh, you also need to understand the following about imbalance : sometimes the price just imbalance, it can even break through it a little . This is absolutely normal, unlike all the other zones of interest, which should not be broken through and then
[12:05] move away from these ranges like that. This happens very often. Why? Because, well, for example, on a fifteen-minute chart you see an imbalance drawn. And if you switch, for example, to an hour, on an hour the
[12:19] imbalance will look like this, for example, because on different time frames they can have slightly different outlines. That is, here in any case, yes, for the algorithms it is like the same testing zone, but on different time frames. That
[12:32] different. That is, somewhere the boundaries may not exactly coincide. This doesn't happen. Well, it almost never happens that all timeframes. That is, on different time frames, it will have slightly
[12:45] different boundaries in order to avoid a situation where, yes, imbalances on different time frames are different and the price can go to test yes, but you don’t see it, there, say, on fifteen minutes, then the stop should
[13:00] only to reversal patterns, by the way. I'm just telling you this in principle, yes, that's why you should never set your stop behind an imbalance. Because there may be imprecise boundaries, yes, on the time frame where you work, but on another you simply,
[13:16] notice. Therefore, you should always bet behind the swings, that is, behind the structural elements of your foot. This applies to absolutely all cases when you trade. So, let's look at the double top.
[13:28] So, let's look at the double top. Ah, hourly timeframe. Coin dasш. And what do we see? Our first summit. Here she works with liquidity. Here, well, here's something else, yes, a rollback
[13:42] and a new peak, the second one. And now, you see, we’re just filming the to shoot the first peak. You see, there was no more liquidity here
[13:54] , right? That is, the second peak did not work with any liquidity . And we went and broke the structure of this point here. Here you go, boss. When we broke down we had two consecutive
[14:10] imbalances. When they are in a row, that is, when imbalances have formed in into one single zone, yes, which is what I actually did here. And what do we see next? That is, right here we still, yes, went down quite well, but
[14:24] nevertheless, then the price returned to test the imbalance. Here, right in the middle, you see, they tested it right and then, that is, we went down. Here, yes, a pattern of actions, so to speak. It all worked out very well here, really.
[14:38] Well, considering that it’s an hour, yes, if we had come in here, then we would have been standing here for many hours, too, we must understand. That is, such a pattern on the hour could also be taken as, uh, well, as a reference point for where the price is going, right? And somewhere already, for example,
[14:52] there, well, in these ranges, look at something, choose something for yourself. That imbalance, for example, has been tested, that is, somewhere around here we start to select a short, yes, that is, on small timeframes, there we switch to M5, M15. So, and what else
[15:06] resistance. Here we have an imbalance. I've had it since four o'clock. Ah, well, here and on the hour, in fact, some ranges are visible there, yes, but on took it from a higher timeframe. This is also possible and necessary to do. Here. That is,
[15:22] peak, and the price, accordingly, went down. That is, all the criteria, yes, that we have discussed here, absolutely all of them. Interest zone, two peaks, work with liquidity, only here there is a breakdown, imbalance, that is, absolutely all the criteria
[15:37] were met here, right? And here you go , how this pattern worked. So. And now we see a double bottom. Let's also analyze it according to the criteria. And our Let's also analyze it according to the criteria. And our first bottom,
[15:51] that is, there was liquidity, here were, yes, these equal lows, here is the low. The first, first bottom collected all the liquidity , right? There was no longer any lower liquidity here. Below there was only a zone of interest, yes. The
[16:05] zone of interest here is the order block, yes, which worked with this liquidity, and the imbalance within the order block. That is, there are two zones of interest in one range. And so we see, yes,
[16:19] that is, the first bottom has formed, a rollback and the second bottom is clearly testing the intersection of two imbalance zones and an order block. After which, yes, there is an aggressive upward movement, and we see a breakdown of the structure. Here are the OS
[16:35] imbalances. And after the imbalance test, yes, that is, by the way, yes, the time frame is 45 minutes, that is, after the imbalance test, we see how the price is very, very active. Well, it was active here, yes, they stood there for a little while
[16:48] in some kind of sideways movement and then the price, that is, completely flew away. That is too, which is simple, yes, that is, all the criteria were met and how well it worked out here.




⚡ Saved you 0h 16m reading this? Transcribe any YouTube video for free — no signup needed.