
Do ICT Entry Zones Actually Work?
45sPoses a controversial question that challenges popular trading concepts, sparking curiosity.
▶ Play Clip"Delivers exactly what the title promises — honest backtest data with clear results."
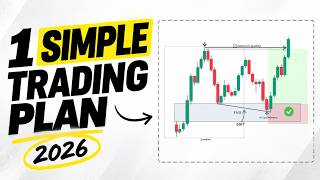
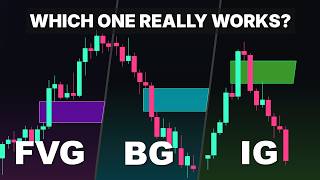
This video backtests three popular ICT entry zones—fair value gaps, breakaway gaps, and inversion gaps—on EUR/USD over three months. The creator provides honest win rates, drawdowns, and net results, then shows how adding market structure and direction filters dramatically improves profitability.
Fair value gap forms when price moves too quickly, leaving a space between the wick of the first and third candle in a three-candle sequence.
Breakaway gap is a type of FVG where the third candle closes beyond the high of the second candle, showing stronger momentum.
Inversion gap is a failed FVG or breakaway gap that gets broken by price, signaling a momentum shift.
Strategy uses entry at start of gap, stop loss below zone, and 1:2 risk-to-reward target. Large gaps entered in the middle; very small or large gaps skipped.
ATR measures average price range of past 14 candles. Stop loss set at half ATR below the gap; skip trades if gap is smaller than 1/3 ATR or larger than 2 ATRs.
FVG: 29 trades, 31% win rate, 6% net loss, 18% max drawdown.
Breakaway: 45 trades, 31% win rate, 9% net loss, 18% max drawdown.
Inversion: 27 trades, 33% win rate, breakeven, 6% max drawdown.
Adding market direction and structure filters improved results significantly. Combined FVG/breakaway: 29 trades, 48.3% win rate, $390 profit, 9% max drawdown.
Inversion gap with filters: 12 trades, 50% win rate, $180 profit, 6% max drawdown. Small sample size noted.
ICT entry zones alone are not profitable, but adding market structure and direction filters significantly improves results, turning a losing system into a profitable one.
FVG raw win rate 31%
Shows that raw FVG trading is not profitable without filters.
05:31Using ATR for objective gap sizing
Provides a systematic way to filter gaps and set stop-losses.
03:54Market structure filters boost profitability
Adding trend and structure turned a losing strategy into a profitable one.
10:31Protected low concept
Key level that defines buyer control and trade direction.
08:09[00:00] Fair value gap, breakaway gap, and inversion gap. These are three types of ICT entry zones. You can find many YouTube tutorials on how to trade them, but do they actually work on the real chart?
[00:12] Can you make profits trading these setups? If so, which one has the highest win rate? There's no other way to answer these questions except by going to the charts and backtesting them. So in this video, we are going to put them through a major backtest
[00:26] and share a valuable result. Today, we are going to provide the honest data from our backtesting to you. So if you want to see the results and potentially save yourself tons of time backtesting,
[00:38] smash that like button, and let's get into it.
[00:51] Before we start, let's have a quick recap. A fair value gap forms when price moves too quickly, leaving a space between the wick of the first candle and the third candle in a three-candle sequence.
[01:04] Similarly, a bearish FVG is a space between the lower wick of the first candle and the upper wick of the third candle. The fair value gap simply shows there was an imbalance between supply and demand that caused this aggressive move.
[01:19] Later, when price returns to this zone, we expect a reaction and a possible trading opportunity. Now, what is a breakaway gap? A breakaway gap is a type of fair value gap where the third candle breaks through and closes beyond the high of the second candlestick.
[01:36] This shows even stronger price momentum. Similar to fair value gaps, if price makes a pullback into the breakaway gap, it can provide a great trading opportunity with a potentially high risk-to-reward ratio.
[01:49] Now, what is an inversion gap? An inversion gap is simply a failed fair value gap or failed breakaway gap that gets broken by price. For example, this bullish fair value gap should act as support when price pulls back to it.
[02:06] But if price breaks below it right away and the gap fails, it becomes an inversion. The psychology is simple. It shows that the side that created the imbalance has lost control, signaling a possible momentum shift.
[02:20] Just like broken support can become resistance, a bullish fair value gap can turn into a supply zone after being broken. So, we can look for a rejection from the inversion to the downside.
[02:34] Now, the question is, do these strategies really work on the real chart? To answer this, we need a simple trading strategy with clearly defined rules for entry, stop loss, and profit targets so we can test them on the chart.
[02:48] Here is the first and simple trading strategy. When a fair value gap forms, we place an order at the start of the gap and set the stop loss below the zone. For the take profit, we aim for a fixed 1 to 2 risk to reward ratio.
[03:04] But here is an important rule. if the fair value gap is large we enter in the middle of the gap to enter at a better price we also ignore gaps that are too small or extremely large and unreasonable to trade But these rules make the strategy subjective meaning that if I ask a group of traders whether
[03:24] this gap is too small to trade, some of them might say no and take the trade while others might say yes and skip it. Another problem is that you might take a trade during backtesting, but skip a similar setup when trading live because you feel the gap is too small.
[03:40] This can make our backtesting results impractical, so we need an objective way to measure the size of fair value gaps and decide which gaps we want to trade. We also need a consistent way to determine our stop-loss distance.
[03:54] This is where the ATR indicator comes into play. The ATR measures the average price range of the past 14 candles. For example, in this chart, the ATR is showing 20 pips.
[04:08] This means that, on average, the past 14 candles have moved about 20 pips from low to high. So, here is how we are going to use the ATR in this strategy. We will place our stop loss, half an ATR, below the fair value gap for a long trade.
[04:26] We will skip the trade if the fair value gap is smaller than one-third of the ATR or larger than two ATRs. This helps us maintain a reasonable risk-to-reward ratio.
[04:38] Now, our strategy is much more objective If we give the same chart and the same rules to 10 different traders there is a much higher chance that they will identify the same setups
[04:51] and achieve similar backtesting results And this is exactly what we want clear backtesting results We use the same entry and exit rules for breakaway gaps and inversions
[05:03] Now, for risk management we start with $1,000 in capital and risk 3% per trade. To start with, we're going to backtest the euro-dollar pair on the one-hour chart using the past three months from the time of this video, June, July, and August
[05:19] 2026. Now, here are the results from our backtesting. Keep in mind that all of this backtesting was done using TradingView's replay mode. We took each trade as if we were trading
[05:31] it live, without looking at future candles. This makes the backtest more realistic and applicable. Starting with the fair value gap backtesting results, out of 29 trades, 9 were winners and 20 were losers,
[05:44] giving us a 31% win rate. The account started at $1,000 and finished at $940, resulting in a 6% net loss. The lowest point during the test was $820,
[05:57] representing an 18% drawdown from the initial balance. Moving on to the breakaway gap backtesting results, Out of 45 trades, 14 were winners and 31 were losers, giving us a 31% win rate.
[06:11] The account started at $1,000 and finished at $910, resulting in a 9% net loss. The lowest point during the test was $820, representing an 18% drawdown from the initial balance.
[06:26] Finally looking at the inversion gap backtesting results Out of 27 trades 9 were winners and 18 were losers giving us a 33 win rate The account started and finished at resulting in a break net result The lowest
[06:42] point during the test was $940, representing a 6% drawdown from the initial balance. Keep in mind that we took almost every gap that formed on the chart without any additional filters. Naturally, not every gap will lead to a profitable trade. We also haven't accounted for
[06:59] spread and commissions, which would make these results even worse. So now, it's time to add some rules and filters to make this more like a real trading strategy, and then backtest it again to see if the results improve. In this part of the video, we're going to add the concepts of market
[07:15] structure and market direction to our trading plan. Our first step is to identify the trend, and then look for trading opportunities in the direction of the market. Identifying market direction is the first step in analyzing any price chart.
[07:30] The goal is to determine the trend and identify whether buyers or sellers are in control of the market. Trading in the direction of the dominant side increases the probability of success
[07:42] and helps you stay aligned with the overall market momentum. We all know that in a clean-up trend, price forms higher highs and higher lows, respecting the swing lows. When price breaks above a previous high
[07:55] and creates a new structure, it signals trend continuation. We then mark the lowest point that started this move as our new higher low, which is also called the protected low. As long as the price stays above this level,
[08:09] buyers are in control, and we should only look for buying opportunities. Once again, price breaks out and creates a new structure, and we remain bullish as long as price stays above the new protected low.
[08:22] The reason this level is important is that if the price returns to it, buyers are likely to step in again to protect their positions. But what happens if price fails to make a new high and then breaks below the previous swing low?
[08:37] This shows that buyers are no longer in control and strong selling pressure has entered the market. This shift in behavior is known as a change of character and it can act as an early signal of a potential reversal,
[08:49] it suggests that the trend may be weakening and a move in the opposite direction could follow. However, here are two early signals that the trend is weakening and a reversal may be on the way.
[09:01] Number one, failure to make a new high. When price is in an uptrend, after a pullback, if it fails to make a new higher high and starts falling, this shows a loss of momentum. Buyers were unable to push the price higher,
[09:14] which is a sign that the trend is weakening. The reversal is later confirmed when price breaks downward through the previous structure. The same concept applies to a bearish trend. If price fails to make a new low after a pullback
[09:28] and starts moving higher, this shows a loss of momentum. Sellers were unable to push the price lower, which is a sign that the bearish trend is weakening. The reversal is later confirmed when price breaks upward through the previous structure.
[09:41] Number two, change in state of delivery. Change in state of delivery is a chart pattern where the momentum of the candles suddenly shifts in the opposite direction For example here the latest impulsive move created a fair value gap suggesting strong buying pressure
[09:59] We would normally expect price to continue pushing higher because of this bullish momentum. But what happens if the following candles suddenly move sharply lower, suggesting the opposite? it. This sudden shift in momentum is called a change in state of delivery, and it can be an
[10:14] early sign that a reversal may be coming. If this move to the downside also creates a bearish fair value gap, it provides additional confirmation that the bullish trend may be reversing. Now, with all that said, we applied these concepts to our trading strategy and back-tested it one
[10:31] more time to see how the results changed. Now, let's take a look at the results. For this back test, we combined fair value gaps and breakaway gaps and recorded their results together. The reason is that in our previous back tests, both setups performed very similarly. So instead of
[10:48] analyzing them separately, we decided to combine them into one trading strategy. Over the three months from June to August 2026, we took 29 trades with 14 winners and 15 losers, giving us a 48.3%
[11:02] win rate. This resulted in a net profit of $390, growing the account from $1,000 to $1,390. The maximum drawdown was 9%, meaning the account experienced a maximum decline of $90 from the
[11:18] initial balance during the backtest. So, despite having a win rate below 50%, the 1 to 2 risk to reward ratio allowed the strategy to remain profitable. But more importantly, adding market
[11:31] structure and market direction made a huge improvement to the overall results. Instead of taking every fair value gap or breakaway gap that formed on the chart, we now filter these setups based on the overall market direction and structure. This helped us avoid many lower quality setups
[11:48] and focus on trades that aligned with the market's current momentum. Now, let's take a look at the results for the inversion gap trading strategy. Over the three months, we took 12 trades with six winners and six losers for a 50% win rate. This gave us a net profit of $180, growing the account
[12:07] from $1,000 to $1,180. The maximum drawdown was only 6%, meaning the largest decline from the initial balance was $60. Compared to our previous results, the inversion gap strategy also remained
[12:22] profitable with a relatively low drawdown. However, we only took 12 trades during these three months, so the sample size is still quite small. Overall, these results show that the inversion gap can work as part of our strategy,
[12:36] especially when combined with market direction and market structure to filter out lower quality setups. But we would need more data and a larger sample size before drawing stronger conclusions about its performance.
[12:49] And that brings us to the end of this backtesting experiment. Adding market direction and market structure made a significant improvement to the results, but we still need more data and testing to see how these strategies perform over the long term.
[13:03] Thanks for watching, and I'll see you in the next one!
⚡ Saved you 0h 13m reading this? Transcribe any YouTube video for free — no signup needed.