
Why 90% of Traders Fail at Supply & Demand
45sHigh-impact opening with a bold claim that grabs attention and promises to solve a common trading problem.
▶ Play Clip"Delivers solid, actionable content on zone identification, but the 'zero experience' promise is oversold—the material assumes some familiarity with SMC/ICT concepts."
This video teaches traders how to identify high-probability institutional supply and demand zones, emphasizing that most traders mark these zones incorrectly, which hurts their win rates. It explains the formation of these zones, provides mechanical rules for filtering high-quality zones, and demonstrates how to draw them using candlesticks, all within the framework of smart money concepts (SMC) and ICT.
90% of traders mark supply and demand zones incorrectly, which kills their win rate. This applies regardless of trading style (price action, SMC, ICT).
Before a drastic move, price forms a base (accumulation) – a narrow range. This is a trap where the market induces players to build liquidity on both sides of the range.
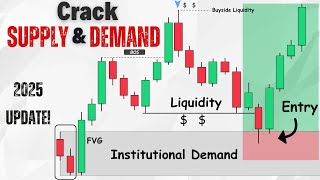
Price explodes through the base with force, creating a massive imbalance between supply and demand. The demand zone is born at the origin of this aggressive move. The smart play is to wait for a retracement into the zone, not chase the breakout.
Price breaks through a base with strong bearish momentum, creating a sharp imbalance in favor of supply. The supply zone forms at the origin of the drop. Wait for a pullback into the zone for a short entry.
Zones are powerful because they represent where institutions previously placed long positions (for demand) or short positions (for supply). Institutions defend their territory, and they scale in gradually, often filling remaining orders when price returns.
The process plays out in four steps: base, expansion (rally or drop), retracement and mitigation, and continuation. The highest probability entries are in the continuation phase.
Wait for price to tap a higher time frame (HTF) supply or demand zone, then zoom into a lower time frame (LTF) and look for a market structure shift (MSS) or change of character (CHoCH). Then look for a PD array (fair value gap, order block, breaker block, mitigation block) for entry.
Patterns repeat across all time frames. A demand zone on the 1-minute chart may appear as a single bullish order block on the 15-minute chart. An order block is the candle where institutional money steps in and creates a break of structure.
Method 1: Range zone – draw from wick to wick of the entire candle before the breakout. Broader zone, wider stop-loss. Method 2: Pivot zone – use the last bearish/bullish candle before the move. Tighter stop-loss, higher reward-to-risk, but may miss entries.
Three types: 1) Inside bar candle zones (consolidation on LTF), 2) Wick zones (hidden LTF pullbacks), 3) Wick only optimization (using just the wick for maximum precision).
The most powerful filter. If a zone caused a structure shift, it's statistically more likely to hold because structure breaks indicate strong momentum and institutional involvement.
The bigger and cleaner the move away from the zone, the stronger the imbalance. Look for large impulsive candles with little to no overlap. The strength of the expansion reveals the strength of the zone.
The less time price spends inside a zone before launching out, the more out of balance that level is. This indicates heavy institutional orders hit the market fast.
Each time price returns to a zone, it drains the remaining orders, weakening it. Fresh zones (not yet retested) give the strongest reactions. Avoid zones that have been tapped multiple times.
The most powerful zones often form right after a liquidity sweep. Institutions need opposing liquidity to get filled. For example, they push price below equal lows to trigger sell stops, then use that supply to fill their long positions. Zones formed after a sweep are high probability.
What is the 'base' in supply and demand trading?
A narrow range where price accumulates before a drastic move. It's a trap being set to build liquidity on both sides of the range.
01:11
What are the four steps of the market cycle described in the video?
Base, expansion (rally or drop), retracement and mitigation, and continuation.
05:23
What is an order block?
The candle where institutional money steps in, manipulates price, and creates a clear break of structure or market structure shift.
07:58
What is the difference between a range zone and a pivot zone?
Range zone uses the entire candle range (wick to wick) before the breakout, giving a broader zone and wider stop-loss. Pivot zone uses the last bearish/bullish candle before the move, giving a tighter stop-loss and higher reward-to-risk.
08:27
What are the three types of fractal model zones?
Inside bar candle zones, wick zones, and wick only optimization.
09:58
Why do zones formed after a liquidity sweep have high probability?
Because institutions need opposing liquidity to get filled. They push price to trigger stops, then use that surge of supply/demand to fill their positions, creating a strong zone they will defend.
14:59
Demand Zone Formation
Explains the core mechanism of how a demand zone is born from an explosive move, emphasizing the importance of waiting for a retracement.
01:53Institutional Footprints
Reveals why zones are respected: they represent institutional entry points that are defended, a key psychological driver of price reversals.
03:29HTF Zone + LTF Confirmation
Provides a concrete, actionable approach: wait for HTF zone, then use LTF structure shifts and PD arrays for entry confirmation.
05:52Rule 1: Break Structure
The most powerful filter—zones that break structure are statistically more likely to hold, a simple yet effective heuristic.
11:25Liquidity Sweeps
Highlights the institutional need for opposing liquidity and how sweeps create high-probability zones, a sophisticated concept.
14:59[00:02] episode of Smart Risk. 90% of traders are marking supply and demand zones wrong and it's killing their win rate. It doesn't matter what you trade, price It doesn't matter what you trade, price action, SMC, ICT, or anything else. If
[00:16] you can't spot highquality institutional zones, you're trading blind. These zones are where the market truly shifts. Miss them and your win rate drops, or worse, you get caught on the wrong side of a trap. In this video, I'll show you
[00:29] exactly how these zones form, how they work, and most importantly, how to identify the high probability ones in the simplest, most mechanical way possible, so you can finally spot the zones that actually move the market and
[00:43] trade with the flow of institutional money, not against it. We always appreciate your support. So, please give this video a thumbs up and subscribe to our channel if you are new. See you after intro. I don't slow up. No, I
[00:57] don't take I got no love for the fakess. If you want to play tough and want to hate this when we show up. Before we dive into the exact tools and criteria for filtering out risky supply and demand zones and locking in on the
[01:11] ones that actually matter, let's start with a quick refresher to set the stage. Price doesn't just explode out of nowhere. before making any drastic move. It usually forms an accumulation or moves sideways within a narrow range on
[01:24] the chart. We call this the base. This phase isn't just a pause. It's a trap being set. A quiet moment where the market builds up enough momentum for the next big move. But here's what most traders miss during this base phase. The
[01:38] market is busy inducing more players, including retail traders and even institutions. Why? To build liquidity on both sides of the range. And once that liquidity is loaded, the real move begins.
[01:53] Let's break down what actually happens in a bullish scenario. Price doesn't just drift upward, it explodes, breaking through the base zone explodes, breaking through the base zone with force. And if you're asking why,
[02:05] surge in buying pressure, creating a massive imbalance between supply and demand. And that imbalance, it sends prices flying. This aggressive push upward isn't
[02:18] consuming remaining supply and rebalancing all that fresh demand created in the move. And right there, that's where your demand zone is born. But here's the key. You don't want to chase the price after the breakout. You
[02:32] want to wait for price to retrace back into that demand zone. That's your opportunity. That's when you zoom in, look for your entry confirmation models, and go long. This is how you trade with the big players, not against them.
[02:47] Conversely, in the bearish scenario, if price breaks through a base with strong bearish momentum, it causes a sudden surge in selling pressure, creating a sharp imbalance. This time in favor of supply. That imbalance overwhelms demand
[03:01] and price starts to fall fast. As price breaks through the base, it aggressively liquidity is available to consume available demand and rebalance the excess supply created during the drop. And right there at the origin of that
[03:16] sharp move, your supply zone is formed. But rather than jumping in late, the smart move is to wait for price to pull back into that supply zone. Once it revisits the zone, you can begin looking for your confirmation models, whether
[03:29] it's rejection, a change of character, or another entry trigger to take a short trade. Now, you might be asking, why does price react to a demand zone and reverse from it? The main reason is simple. At some point, there just isn't
[03:45] higher. So once price finds enough supply to consume and starts filling the unfilled demand left behind, it triggers a shift leading to a drop in price and a natural pullback. But here's what really makes
[04:01] that zone powerful. It's not just any random support area. previously stepped in and placed long positions. These are footprints of smart money and they don't want price falling below their original entries.
[04:17] So when price returns to that zone, institutions often step in again to defend their positions, keeping price from dropping further and triggering another upward move. In simple terms, institutional buyers protect their
[04:31] territory. And that defense is what creates the reversal. Another big reason these zones are respected and why price often reverses from them so cleanly often reverses from them so cleanly comes down to how institutions operate.
[04:45] Large institutions don't enter the market all at once. They scale in gradually, often in multiple stages, especially around zones where their previous trades left clear footprints. This means that not all of their
[04:57] original orders were filled during the first move. So when price returns to the demand zone, they see it as a second chance to execute the rest of their orders and they step in. That's exactly why we wait for the price to come back
[05:09] to these zones. If we want to trade with institutional money and not end up on the wrong side of the market, we need to let price return to these key areas before executing our trades. The exact opposite applies to supply
[05:23] zones where institutions manage their sellside positions the same way in phases. Now, here's the bigger picture. All of this plays out in four key steps. the base, the expansion, which could be a
[05:36] rally or a drop, the retracement and mitigation, and finally the continuation. And here's the part that matters most. We always focus on the continuation phase because that's where the highest probability entries show up.
[05:52] So, how do we catch them? Our approach is simple but precise. Wait for price to tap into a higher time frame supply or demand zone. Then zoom into a lower time frame and watch closely for signs of a reversal like a
[06:07] market structure shift or a change of character. That's your first layer of confirmation. Once you spot that structure shift, the next step is to look for a PD array. That could be a fair value gap, an order block, a
[06:20] fair value gap, an order block, a breaker block, or a mitigation block. Which one do you choose? That depends on your trading model and personal strategy, but the concept is the same. Wait for the market structure shift,
[06:32] then enter the market. So, how do we use supply and demand zones in smart money supply and demand zones in smart money concepts or ICT? But before we continue, if you're an experienced trader and need more capital, Funded Next is an
[06:45] excellent option. They're one of the top rated prop firms on Trustpilot and offer some of the most unique services in the industry, including a 15% profit share from the challenge phase, the lowest package priced at $32, and many more.
[07:00] Plus, they provide flexible funding options to support your trading needs. Check out the link below to stay updated on the latest offers and special deals. Well, first, let's remember this. The market is fractal, meaning what happens
[07:15] on one time frame also happens on every other time frame. Whether you're watching a one minute chart or a daily chart, the same patterns repeat. Now, let's say you spot a demand zone on the one minute chart. When you zoom out
[07:30] to the 15-minut, that entire base might compress into just one single down candle sitting right before a strong bullish rally. That candle, we call it a bullish order block. And in a bearish scenario, it's the exact opposite. The
[07:45] base might appear as a single up candle before a massive drop. That becomes your bearish order block. So, what's an order block exactly?
[07:58] right before price explodes, up or down. It's the candle where institutional money steps in, manipulates price, and creates a clear break of the structure or a market structure shift. It's where the real game begins. and it's a key
[08:12] tool for spotting where smart money is positioning itself before the big move. Now, next, let's see how do we actually draw supply and demand zones on the chart using candlesticks. Method number one, the range zone.
[08:27] Method number one, the range zone. This one is simple and powerful. You draw your zone based on the entire candle range from wick to wick right before price breaks out with a strong aggressive move. This gives you a
[08:40] broader zone, which can reduce your chances of missing the trade. But keep in mind, it also means a wider stop-loss and possibly a lower risk-to-reward ratio. Method number two, the pivot zone.
[08:55] This is more refined and offers greater precision. Here you look for a pivot candle. the last bearish candle before a bullish rally for a demand zone or the last bullish candle before a bearish drop for
[09:09] a supply zone. You draw your zone from that candle or include one more if it fits better based on your style. It gives you a tighter stop-loss, often with a higher reward to risk. You may miss more entries if price doesn't come
[09:23] all the way back. So, which one is better? Neither. It all depends on your personality and risk tolerance. Some traders prefer precision. Others want to catch more setups. There's no right or
[09:38] wrong, just consistency. What really matters is this. Stick to one method, master it, and build your edge with discipline. The third method for drawing supply and demand zones is the fractal model.
[09:58] behaves within candles and it's divided into three powerful types. Type one, into three powerful types. Type one, inside bar candle zones. This one shows up during strong expansion moves where price is aggressively pushing but
[10:12] suddenly stalls. You'll spot a candle that doesn't break the high or low of the previous candle. That's your inside bar. And what it's actually showing you is a range or consolidation on the lower time frame. Type two wick zones. Now,
[10:28] this one's sneaky and smart money loves using it. In a bullish rally, you might see nothing but big green momentum candles. No visible demand zone, right? But look at those wicks. They're not just noise. They're lower time frame
[10:42] pullbacks. Those wick zones represent hidden sell to buy ranges where price briefly dipped to grab liquidity before pushing higher. The same thing applies in bearish moves. Large candles with long upper wicks often hide buy to sell
[10:56] zones on the lower time frame. Type three, wick only optimization. This one's for traders who want maximum precision. Sometimes a pivot zone is just too large. The full candle might give you a massive zone that's hard to
[11:10] manage. Here's the fix. Just use the wick. That long wick often is the real footprint, the actual reaction zone from the lower time frame. By focusing only on the wick instead of the whole candle, you're narrowing down your entry zone
[11:25] without losing accuracy. Not all zones are created equal. Now, obviously, not every supply or demand zone you see on the chart deserves your attention because some zones just don't hold. They get broken, ignored, or
[11:40] barely respected by price. That's why we don't just mark every little pause in price as a zone. We only care about the ones with real weight behind them, the ones smart money actually respects. And to find those, we need clear mechanical
[11:54] rules. So before you start marking every base or breakout as a supply or demand zone, let's break down the exact rules that separate the fake out zones from the ones that actually move the market. Rule number one, only focus on zones
[12:07] that break structure. This is the easiest and by far the most powerful filter you can apply. Here's the logic. If a supply or demand zone caused a structure shift, that zone is statistically more likely to hold. Why?
[12:23] Because structure breaks usually means strong momentum and momentum means institutional money is involved. So instead of guessing, let the structure tell you what matters. Rule number two, look for strong moves
[12:38] away from the zone. The bigger and cleaner the move away from the zone, the stronger the imbalance. You want large impulsive candles with little to no overlap. Here's one of the most important signs that a supply or demand
[12:52] zone actually matters. The strength of the expansion move. When price shoots away from a zone with clean, impulsive candles and minimal overlap, that's not just random price action. It's a clear sign of a strong imbalance between
[13:07] movement tells us that smart money placed a heavy order at that level. And when institutions are involved, you better believe price is more likely to respect that zone on the way back. As you can see in the examples, the
[13:21] followed by the cleanest and most aggressive bearish move. The weaker the expansion, the weaker the zone. So always ask yourself, how strong was the reaction? Because the strength of the move reveals the strength of the zone.
[13:37] Rule number three, time spent equals strength revealed. Want to know how aggressive the smart money was at a level? Just look at how long price stayed there. When price barely pauses at a zone before launching
[13:50] out of it, that's your clue. It means a strong imbalance. It means heavy institutional orders hit the market fast. The logic is simple. The less time price spends inside a supply or demand zone, the more out of balance that level
[14:04] is. And that kind of imbalance usually comes from smart money stepping in with serious volume. So when you see price tap a zone and explode out, that's not hesitation. That's precision. That's institutional activity. And that zone is
[14:18] returns. Rule number four, freshness. Every time price comes back to a supply or demand zone, it's not just tapping it, it's draining it. Each mitigation
[14:32] reduces the remaining orders in that zone, weakening its strength and making it less likely to hold in the future. That's why fresh zones, the ones that haven't been retested, tend to give the strongest reactions. The more times
[14:45] price returns, the weaker that zone becomes. So avoid zones that have been tapped multiple times, they've already served their purpose. Stick to fresh, untouched zones if you want high probability reactions.
[14:59] probability reactions. Number five, look for liquidity sweeps. Now, this one's a gamecher and one of the clearest signs of smart money activity. The most powerful supply and demand zones often form right after
[15:11] liquidity is swept because those zones are created by institutional moves. Institutions can't just jump into the market blindly. They need opposing liquidity to get filled without heavy slippage. If they want to buy, they need
[15:24] a pool of sell orders. And if they want to sell, they need buyers lined up. Let's say they want to go long, they need sellers. So what do they do here?
[15:36] The market sweeps sellside liquidity right below these equal lows. That's where early buyers have their stop losses stacked and breakout traders have their sell stops waiting to get triggered. Smart money knows this. They
[15:50] intentionally push price below these lows to trigger those orders and then use that surge of supply to fill their long positions. That's why when price returns to that zone, institutions often defend it fiercely because that's where
[16:04] they entered before. The zone becomes a strong demand area likely to trigger the next big move. So remember, zones formed immediately after a liquidity sweep are some of the highest probability supply or demand
[16:17] zones you'll ever find. That's it traders. Thanks for watching. I hope you found this video useful. If you did, hit subscribe and turn on update. Drop a comment below with your thoughts or topics you'd like to see
[16:31] next. Your support means the world to us. See you in the next video.
⚡ Saved you 0h 16m reading this? Transcribe any YouTube video for free — no signup needed.