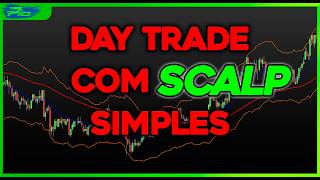

Simple Scalping Strategy with 2 MAs and Keltner Channel
45sOffers a clear, simple trading strategy that appeals to aspiring traders looking for actionable tips.
▶ Play Clip"Delivers a clear, actionable scalping strategy with examples and backtests, though the promotion of bots at the end slightly dilutes the value."
This video presents a simple and effective scalping strategy for mini-dollar futures, using only two exponential moving averages (17 and 72 periods) and a Keltner Channel (20 periods, deviation 3). The strategy is objective, based on trend behavior, and includes strict risk management rules. The creator demonstrates the setup with real chart examples and backtests, emphasizing discipline and adaptability.
The video introduces an objective scalping strategy for mini-dollar futures using only two moving averages and a Keltner Channel, emphasizing simplicity and objectivity.
On the 1-minute timeframe, use a Keltner Channel with 20 periods, exponential type, deviation 3. Also use a 17-period exponential moving average (shift 1, blue) and a 72-period exponential moving average (shift 1, red).
The Keltner Channel with deviation 3 makes it difficult for price to close outside, so a close below indicates downward momentum, above indicates upward momentum. Moving averages confirm direction and provide dynamic support/resistance.
The setup formula is: force (Keltner close) + direction (MA cross) + reaction zone (MA region) = entry.
Use a 10-point risk management: positive daily goal of two consecutive wins, stop loss after one loss, monthly target of 50 points, monthly loss limit of -50 points. Stop trading for the day/month when these are hit.
On November 6, 2025, the averages crossed downwards, and a candle closed below the Keltner Channel. Place a sell order one tick below the 17-period MA. The price pulled back to the MA region (resistance) and then fell, triggering the exit.
Later on November 6, the averages crossed upwards, and a candle closed above the Keltner Channel. Place a buy order one tick above the 17-period MA. The price pulled back to the MA region (support) and then rose, triggering the exit.
If the market opens with price outside the Keltner Channel, wait for at least one candle to close inside before starting. Only search for signals until 1:50 PM; if no valid entry, close for the day.
The creator shows backtests from September 5-11, demonstrating multiple wins and one loss, and emphasizes that no strategy works forever; adjustments may be needed as market conditions change.
The creator promotes a Black November offer for their trading bots, with over 15 robots for Profit Chart and MetaTrader 5, and invites viewers to test them in a free group.
The strategy is simple, objective, and based on trend behavior, but requires strict risk management and discipline. The creator emphasizes that no strategy works forever and encourages backtesting and adaptation.
What are the settings for the Keltner Channel in this strategy?
20 periods, exponential type, deviation 3.
00:29
What is the purpose of the 17-period and 72-period moving averages?
To confirm direction and create dynamic support/resistance zones.
02:34
What is the strategy formula?
Force + direction + reaction zone = entry.
03:15
What is the daily positive goal in risk management?
Two consecutive wins.
03:59
What is the monthly loss limit?
-50 points.
04:24
When should you stop looking for signals?
At 1:50 PM.
08:47
What should you do if the market opens with price outside the Keltner Channel?
Wait for at least one candle to close inside the channel before starting.
08:32
Strategy Formula
Provides a clear, memorable formula for the entry logic.
03:15Risk Management Rules
Emphasizes the importance of risk management in turning a setup into a winning strategy.
03:43No Strategy Works Forever
Acknowledges the need for adaptation as market conditions change.
13:47[00:01] unforgiving assets, because if you hesitate, it takes you out of the game. If you try to force dismantle you. That's why today I'm going to show you an objective scalping strategy for the mini- dollar futures, using only two moving averages and a Kner channel, nothing more, nothing
[00:16] less. It's a straightforward, clean, and objective setup. And that, of course, doesn't depend on opinion, it only depends on the behavior of the trend. And I chose to bring this strategy in celebration of reaching 22,000 subscribers. I'm so grateful, man. Come
[00:29] with me to the chart. Mini dollar settings. One-minute timeframe on the graph, dude. And in this strategy we're going to use the Keltner channel with 20 periods, an exponential type with a deviation of 3. In terms of values, we've changed here, look,
[00:43] for the opening. I left the color as default. We will also use the 17-period exponential moving average with a shift of one, shown in blue. And in red, we'll use the 72-period exponential moving average, also with a
[00:56] shift of one. Okay, man. These are the indicators. Simple, clean, and to the point. Function of the indicators. Hey, here, okay? Because to arrive at this streamlined setup that you see in your
[01:09] chart, I spent days testing variations, filters, and adjustments. Everything is geared towards reaching the minimum number of necessary indicators, so the chart looks clean and clear, okay? OK. But now let's understand, as I said, the function of the
[01:24] indicators. Here's the logic, man. Most people use the Keltner canal or Bollinger bands in that famous way. In other words, did the price close above the Bollinger Bands or above the Kelner Channel? Resale. Did the price close
[01:38] below the Bollinger Bands or below the Kelchner Channel? Oh man, buy it again. Most people use the Keltner channel in this way, but that only generates random entries, depending on the strategy, right? But it's different here,
[01:52] man. Since we are using the Keltner channel with a D3 deviation, as you can see here, it becomes difficult for the price to close outside the channel. So, when the price manages to close below the Keltner channel, we can believe in
[02:07] downward momentum. And of course, when the price closes above the Keler channel, we can add upward momentum. So, this price closing above or below the Keltner level is a trigger that
[02:21] demonstrates strength. And this is where moving averages come in. The 17.72 average serves to confirm the direction and also to create an objective zone of
[02:34] dynamic support and resistance. So that's how it works , man. If a candle closes below the Keltner mark, it indicates selling pressure. And if the averages are crossing downwards, well, we have the moving average region to use as
[02:47] resistance, where we can open sell positions, you understand? And of course, if a candle closes above the Keltner mark, it demonstrates buying strength. And if the moving averages are crossing upwards, well, man, then we use the
[03:02] moving average region as support for buying, you know? So, man, there's no guessing, no feeling, I think it's not now. Dude, this setup I'm showing you has the following
[03:15] formula: force plus direction plus reaction zone equals input. And I managed to transform all of that for you into something simple, objective, and replicable in your chart. Hey Pu, okay, I understand the logic of the strategy, but how does that
[03:31] actually work on the mini- dollar chart? How does the step-by-step process work? No problem, man. Now that you understand why this strategy tends to work, I'm going to show you how it works. But first, just a minute to
[03:43] align our risk management, because that's what transforms a setup into a winning strategy. Risk management. We will use a 10-point management strategy is as follows: a positive daily goal, two consecutive wins.
[03:59] Dude, you followed the risk-off strategy and had two consecutive wins, alright? Close the chart and come back on the next trading day. Limit the loss of the area, a stop. You followed the strategy to the letter, but ended up with a stop loss. No problem, man. Close the
[04:11] chart and return only on the next trading day. Monthly target: 50 points. You will operate this strategy throughout the month, and if at a certain point you reach 50 positive points, you stop operating and
[04:24] only return the following month. The monthly loss limit is -50 points. Man, you were trading, but this month the strategy went wrong. You ended up with 50 negative points. You stop and only come back the following month. And look
[04:38] , this risk management isn't just a fad; it exists to protect your capital, protect your emotional well-being, and increase your chances of ending the month challenging as mini-dollar futures. Okay, let 's go through the step-by-step process. Example:
[04:53] 's go through the step-by-step process. Example: selling scenario, November 6th, 2025. Dude, November 6th started with this candle right here, which opened inside the Keltner channel, as you can see. And the first step is: wait for the averages
[05:07] to cross upwards or downwards. Wow, it's easy to see that the 17-period average is below the 72-period average. So, the first step is complete. The second step is, since the averages are crossed downwards,
[05:22] wait for a candle to close below the Kelt channel, right? Wow, man, this first sail right here, look, it's already closed below the Keltner Channel. Here is the Keltner channel and here is this negative candle. It closed below the
[05:35] Keltner Channel. Second step completed. Third step, since the moving averages and the Kelner channel are showing a downward trend, place this sell order one tick below the 17-period moving average, which in
[05:49] my case is the blue moving average. So, man, you would initially come in with this sell order from up here, look, you would follow the moving average, always one following it, following it until your
[06:03] triggered down here. And you can see where the price went to get into trouble, right? The price started battling between the moving averages, which is our region of dynamic resistance. The price struggled in that region, but when it started to fall again, it caught the exit point for the
[06:18] price movement was exactly what we expected. The moving averages were crossing downwards, and the price closed below the Kelten channel, downward movement. So the price caused this movement here. As it started to rise again,
[06:33] making a sort of pullback in the moving averages, it encountered this resistance zone, and as it fell again, as I told you, it caught the exit point of the trade down here. This is how this strategy works in a
[06:46] sales scenario. Example, purchase scenario, November 6, 2025. November 6, 2025. Dude, it's still November 6th, right? And he realizes that further ahead the averages crossed upwards. And as you
[06:58] recall, the first step is: wait for the averages to cross upwards or downwards. Notice that here the averages were crossed upwards. So, at the Second step, since the averages are crossed upwards, wait for a candle to
[07:13] close above here, look, the Keltner channel. So, some candle needs to come here and close above the Kelner channel, while the averages are crossing while the averages are crossing upwards. Okay, so here we had a candle that
[07:25] closed, look, above the Keltner channel, with the moving averages crossing upwards. . The third step is, since the moving averages and the Kelton channel are showing an upward trend, to place a buy order. One tick
[07:39] above the 17-period average, which in this case is the blue moving average. So, of moment you have that signal, you're going to place your buy order above the moving average, right? One tick above the moving average, it follows the
[07:53] In that case, your order would be triggered at that point. The price then struggled here, look, in the moving average region and started to rise again, catching the exit from the operation up here . Look, the logic here is
[08:05] this: the averages were crossed upwards. At that point, the price showed strength, since it closed above the Kelt channel, right? Then the price went up. When it started to fall again, it found support in this region here,
[08:18] look, of moving averages. And as I said, when it started climbing again, it would take the exit from our operation. This is how this strategy works in a purchasing scenario. Observations, man, I only have two simple observations. And the
[08:32] first thing to note, man, is that often the mini-dollar will open with the price below or above the K channel, right? In this case, my friend, you need to wait for at least one candle to close within the channel before you can begin the step-by-
[08:47] you. My second observation is very simple. We only search for signals very simple. We only search for signals until 1:50 PM, OK? If no valid entry appears by then , we'll close for the day and return
[09:01] on the next trading day. Look, discipline is also part of the strategy, so you need to respect these observations, okay? Quick backtests. Dude, to make sure there's no doubt about how this strategy works, let's do a few
[09:15] quick backtests. Dude, of course I've already done several months of backtesting this strategy. I advise you to do the same, OK? If you don't trust me, put that strategy on a chart and backtest it. And by choosing here, man,
[09:28] randomly, we can do the backtesting in September. Let's take day 5 through day 11 to complete five days of backtesting. Starting then, here on September 5th. Let's go. And here on September 5th, I realize that
[09:42] the first executed signal would be right here, look at this point, a sell signal. That's because, as you can see, the averages are crossed downwards. We had several sails closing below the Kelt channel here, right?
[09:54] Therefore, we would place our sell order one tick below the 17-period moving average. And here, look, our sell order in this region would be triggered, okay? And here below, the price would be to exit the operation.
[10:07] That would be the first profit of the day. And then we redo the step-by-step process, right? Since the moving averages are crossing downwards, we need a candle to close below the Keltner channel. And here a sail closed below the
[10:19] Keltner channel. Since it closed below the Kelner channel, we're hitting the sell signal again at the 17-period moving average. Our sell order would be triggered down here, look, the price would be what would get you out of the operation. That would be their second win of the day.
[10:32] We would hit our daily positive goal on September 5th. Let's move on to September 8th. So, on September 8th, the first signal that was actually triggered, strictly following the strategy, would be, look, a buy signal, okay? That's
[10:46] because the averages were crossed upwards . We had a candle here that closed above the Keltner channel, but this time the strategy fell within the error statistics, okay? Our order would be executed here, a buy order,
[10:58] have the strength to keep going up, to continue the trend, and ended up stopping limit for area loss would have been reached. We would return the 10 points we earned here on September 5th. Now let's wait
[11:11] until September 9th to see if we can recover from this, shall we? And here on September 9th we would have a sell signal executed at this very point right here, look. And that's clear, man, it happens because the averages were crossed
[11:23] downwards. We had here, look, candles below the Keltner Channel demonstrating strength. So, when the price returns to the moving average, we would sell here. The price would be lower when you would be the first profit of the day. And then we redo the step-by-step process, right?
[11:36] we need one of the candles to close below the Kelter channel, right? But in reality, the price didn't close any lower than the Kelt channel, right? As you can see, in reality the averages crossed upwards and here the price, look, closed above the
[11:49] Keter channel. So we would buy a tick above the 17-period moving average. So I zoomed out quite a bit on Our buy order would be triggered here, following the moving average, has been selected at this point. The price was struggling here in the moving average region,
[12:04] but then it decided to go up, and up here , look, it would trigger the exit of the trade. That would be our second gain of the day, and we would recover those 10 points, right? 10th of September. The thing is, on September 10th I already realized that we would have
[12:17] a sell signal executed here and another sell signal executed further ahead, okay? I'm getting ahead of myself because, man, the averages were crossing downwards, this candle closed below the Kelt channel, right, which allows us to sell
[12:29] here, look, a tick that's below the 17-period moving average and down here, So here would be the first profit of the day. And as I said, the other operation would be done here. That's because the averages continue to cross downwards. That
[12:42] Kelt channel, nero. So we could sell here, look, one tick below the 17-period moving average. Our sell order would then be triggered at this point, and down here, look, the price would enter the exit of the trade; it would be the second profit
[12:55] of the day, a positive sell order in this trading session. And finally, let's move on to September 11th, man, we would have a buy signal executed at this point. That's because the averages are crossed upwards . We had here, look, candles closing
[13:08] above the Keltner channel. When the price returns to the moving average, we operation up here. That would then be the first profit of the day. And the last signal we would operate on this day, September 11th, would be here. Look, that's
[13:22] clear, because the averages are crossed downwards. Look, we had these candles closing below the KT channel, right? When the price returns to the we would be ready to sell. Down here, this guy would get out of the
[13:34] operation. That would then be my second profit of the day, a positive goal achieved. And this is how the backtests of this strategy would go from September 5th to September 11th. I repeat, man, I did months of backtesting on this strategy. I
[13:47] advise you to do the same, draw your own conclusions. Hey, let me tell you something important. No strategy works forever. The market changes, speed changes, volatility changes, and any strategy that is
[13:59] excellent today may need some adjustments in a few months to continue performing well, because that's normal. And this is exactly where the work we do in the Pilsar 3.0 method and with the boto comes in. We monitor
[14:13] the strategies and robots week after week and update them when necessary, keeping everything running smoothly and efficiently, okay? Hey guys, listen up, as a way of thanking you for 22,000 subscribers, we're releasing a special
[14:27] Black November offer just for bot 2.0, not for the Pilsar method, okay? It's for the bot. At Botepi, we only work with robots. There are over 15 robots with various professional linear gradients , both for Profit Chart and
[14:43] Metatrader 5. But before making any decision, I want you to test them. So I've left a link in the description for you to join our free group. And inside, we 'll release some robots for you to
[14:56] test, either in a simulator or a real account, it's up to you, in the next few days, with no commitment. This way, you'll find out if our robots fit your operational profile or not. Could it be? You'll draw your own
[15:09] description of this video and also in the first pinned comment. And man, I sincerely appreciate you sticking with me this far and helping me reach 22,000 subscribers. And today's strategy was yet another way of
[15:24] enjoyed it. And to receive more activated, because I won't rest until you become a
[15:37] successful trader. I'll be staying here, man, and see you in the next video. เฮ
![The Moving Average That Anticipates Reversals (Forget the EMA) 🔓💰 [FREE]](https://img.youtube.com/vi/Hds7IuhwzFY/mqdefault.jpg)
![The Only Order Blocks Indicator You'll Ever Need [FREE]](https://img.youtube.com/vi/q10Cimko20g/mqdefault.jpg)
![The Exhaustions Indicator Is Much Better Than You Think [FREE]](https://img.youtube.com/vi/JL0ZXQmZKPo/mqdefault.jpg)
⚡ Saved you 0h 16m reading this? Transcribe any YouTube video for free — no signup needed.